Article
*e-mail: [email protected]
Singlet Oxygen Quantum Yields (
φ
D)
in Water using Beetroot Extract and an Array of LEDs
Juliano A. Bonacin, Fábio M. Engelmann, Divinomar Severino, Henrique E. Toma and Mauricio S. Baptista*
Instituto de Química, Universidade de São Paulo, Av. Prof. Lineu Prestes, 748, CP 26077, 05513-970 São Paulo-SP, Brazil
É proposta uma estratégia simples e barata para determinar rendimentos quânticos (φD) de
oxigênio singlete (1O
2) de fotossensibilizadores (PS) em água utilizando extrato de beterraba
contendo betacianina (Bc) e um conjunto de diodos emissores de luz (LEDs) para excitação. Bc, um corante catiônico natural, foi obtida por purificação através de cromatografia a partir do
extrato de beterraba vermelha (Beta vulgaris), e utilizada como uma sonda para detecção de 1O
2.
Soluções do Bc e PS foram iluminadas com um arranjo de LEDs adaptado no compartimento de um espectrofotômetro comercial e a diminuição da absorvância de Bc foi seguida em função do tempo. O fotobranqueamento de Bc diminuiu em solução purgada com nitrogênio e aumentou em
D2O, indicando o envolvimento de 1O
2. A constante de velocidade de fotobranqueamento observada
(kobs) foi proporcional à intensidade do LED, à concentração e ao φD do PS. Mantendo a fonte de
luz constante pudemos estimar a integral de sobreposição (R) entre a absorção do PS e a emissão
do LED para diferentes concentrações de PS. A inclinação da curva de R em função de kobs é o
valor da constante de velocidade de fotobranqueamento (k), que foi mostrada ser proporcional a φD.
Valores de φDobtidos por este método foram comparados com aqueles obtidos através da medição
da emissão no NIR (infravermelho próximo) para uma série de corantes fenotiazínicos.
It is proposed a simple and inexpensive strategy to determine singlet oxygen (1O
2) quantum
yields (φD)of photosensitizers (PS) in water using beetroot extract containing betacyanin (Bc)
and a set of light emitting diodes (LEDs) for excitation. Bc, a cationic natural dye, was obtained
by flash chromatography purification from the red beet extract (Beta vulgaris)and employed as
a convenient probe for 1O
2 detection. Solutions of Bc and PS were illuminated with an array of
LEDs adapted in the cuvette compartment of a commercial spectrophotometer, and the decrease in Bc absorbance was followed as a function of time. Bc photobleaching decreased in de-aerated
solution and increased in D2O, indicating the involvement of 1O
2. The observed photobleaching rate
constant (kobs) was proportional to the LED intensity, concentration and φD of the PS. By keeping
the light source constant we could estimate the overlap integral (R) between the LED emission
and PS absorbance for different PS concentrations. The slope of R versus kobs is the value of the
photobleaching rate constant (k), which was shown to be proportional to φD. Values of φD obtained
by this method were compared with those obtained by measuring NIR (near infrared) emission for a series phenothiazine dyes.
Keywords:beetroot, betacyanin, quantum yield, singlet oxygen, phenothiazines, photodynamic therapy
Introduction
Singlet oxygen (1O
2)is the most reactive form of
molecular oxygen. Its 1D
g electronic configuration allows
efficient reactions with double bounds presented in
unsaturated lipids, proteins and nucleic acids.1,2
1O
2 has deleterius effects to human beings, for example,
it is involved in skin damage caused by sun exposition.3,4
However, it is also the main species responsible for killing diseased cells in the treatment of tumors or other
pathological conditions by photodynamic therapy (PDT).5-7
In PDT, the electronic excitation of photosensitizers (PS)
leads to triplets that undergo energy transfer, yielding 1O
2.
The efficiency of 1O
2 generation by a specific PS, which can
be measured as its 1O
property to be evaluated concerning the application of PS in PDT. Because of the low costs of LEDs and of other non-coherent light sources, PDT has now the possibility to be widely used and relatively inexpensive protocols have
been proposed.8-11 It is also important that inexpensive new
drugs can be found and consequently it is quite relevant to
develop inexpensive methods to estimate φD.8-10
The most specific method to determine 1O
2 is to measure
its emission at 1270 nm.12,13 Usually, φ
Dis obtained by
measuring the slope of emission versus energy plots and
comparing them with standard compounds.14-16 However,
expensive lasers and detection schemes are required, specially if the detection is to be performed in aqueous
solutions where the lifetime of 1O
2 is only ca. 4 µs.10-16
Perhaps the most commonly used method to quantify
the production of 1O
2 is based in chemical trapping,12,13,17-19
i.e., 1O2 reacts with compounds that absorb in the UV-Vis
region, causing the decay of its absorption and/or emission bands and/or the rise of the absorption/emission bands associated with the oxidized species. Several compounds have been proposed and used as scavengers including, Rubrene, DPBF (1,3-diphenylisobenzofuran) or other
water-soluble compounds.17-19 Highly selective probes for
1O
2 have been recently reported.20,21
In this work, we propose a rather simple, convenient and
inexpensive chemical trapping method to measure φD, based
on the use of beetroot extract containing betacyanin (Bc) as chemical trap and an array of LEDs, which is adapted in the cuvette compartment of a spectrophotometer, as excitation source.
Experimental
Chemicals
The PS utilized in the experiments were Methylene Blue (MB), Azure A, Azure B and thionine. They were recrystallized from ethanol. Water was double distilled and de-ionized.
Extraction and purification of Bc
Betacyanin (Bc) was extracted from beetroot or beet
red (Beta vulgaris) following literature procedure.22-24
Two hydro-soluble compounds: betacyanin (Bc) and
betaxanthins (Bx), which present absorption bands at 540 and 480 nm, respectively are obtained from a aqueous
extraction of beet red.22-24 Extraction was realized by
addition of the triturated beetroot (50 g) on 30 mL of milli-Q water under stirring by 90-120 min. Heating should be avoided because Bc is very susceptible to oxidation upon
heating. In fact, the color of the extract changes from pink to brown when the solution is heated. While Bc is very
sensible to oxidation by 1O
2, Bx is not (Figure 1). Therefore,
in order to obtain a sensitive probe for 1O
2 it was necessary
to separate Bc from Bx. The separation of Bc from the other components of the extract was carried out by column chromatography using silica gel as stationary phase and water as eluent. The first fraction was predominantly Bc,
as determined by UV-Vis spectroscopy.22-24
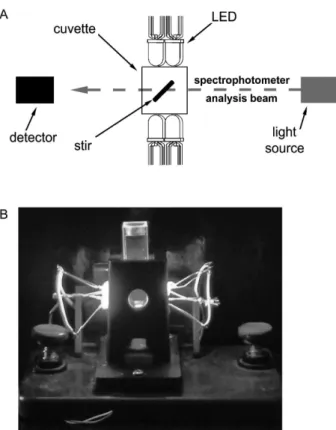
Photochemical set up
All experiments were carried out in a diode-array spectrophotometer (Agilent model 8453) working in kinetic mode and using a quartz cuvette with magnetic stirring. For the irradiation, we have built a photo device using a set of
commercial LEDs positioned at 90o to the analyzer beam
of the spectrophotometer (Figure 2). They were assembled in groups of four and placed at the laterals of a perforated cuvette holder. A picture of this device taken under working conditions can be seen in Figure 2B. The LEDs had maximum emission around 640 nm with total nominal power output of 16 mW (2 mW/LED, as measured in the Power meter Fieldmate-Coherent) and were connected in series, powered by an electric source of 3.0 V (DC). The photobleaching experiments were performed using 1 mL of milli-Q water, 10 µL of the Bc extract and a PS with maximum absorption smaller than 1 a.u. Under continuous irradiation, spectra were acquired every three seconds.
Near Infrared (NIR) emission
Phosphorescence decay curves at 1270 nm were recorded with a time-resolved NIR fluorometer (Edinburgh
Figure 1. Structure of the main beetroot dyes. (A) betacyanins (Bc) also
Analytical Instruments) equipped with a Nd:YAG laser (Continuum Surelite III) for sample excitation at 532 nm. The emitted light was passed through a silicon filter and a monochromator before detection by NIR-PMT (Hamamatsu Co. R5509). Data acquisition was performed by a MSA 300 MHz acquisition board (Becker&Hickl
GmbH, Berlin).16,25,26 The experiments were performed
at room temperature, in air-saturated aqueous solution. The sample absorbance was adjusted to 0.1 a.u. at 532 nm
([Dye] ca.70 µmol L-1). To avoid dimerization at these
relatively large dye concentrations sodium dodecyl sulfate (SDS) was added to the solution at final concentrations of
10 mmol L-1.26,27 In the absence of dimerization the value
of singlet oxygen quantum yield (φD)for MB is 0.52 in
several media (even in naflon films) and measured with
different techniques.12,26-29φ
D values were calculated using
equation 1:12-16
(1)
where φDa and Ia are, respectively, the quantum yield and
initial phosphorescence intensity of 1O
2 at 1270 nm of
the MB species, which was used as standard. Ib is the
phosphorescence emission intensity of the other cationic phenothiazine derivatives.
fD by trapping with Bc and LED excitation
There are several chemical methods used for the
determination of φD.17-21 In the simplest one, which use
monochromatic light sources, the solution absorbance at the irradiation wavelength of the standard and sample is set at the same value, in order to guarantee that the same
number of photons is absorbed. During the irradiation 1O
2 is
formed and reacts preferentially with the scavenger, which is in large excess compared with PS, causing a decrease in the scavenger absorption band. The absorbance change monitored as a function of time is typically fitted by a
monoexponential function.18 The exponential constant gives
the observed photobleaching rate constant (kobs), which
should be proportional to φD. Strategies based in varying
the concentration of trapping agents are also common.12
In this work, another strategy was implemented in order to allow the use of an inexpensive polychromatic light
source (LED) to promote irradiation. kobs was obtained using
different PS concentrations (Bc being always in large excess)
and a relationship between kobs and φD was found and used,
considering several assumptions as described bellow.
The actual value of kobs depends on the quantum yield of
1O
2 production (φD), on the photon flux absorbed by the PS,
on the bimolecular rate constant of the chemical reaction
between Bc and 1O
2, on the concentration of Bc and on the
1O
2 lifetime.12,13,29 Because Bc is photochemically inert, we
only have to consider the photochemical reactions that start with PS excitation.
Calculation of the exact photon flux absorbed by the PS is not trivial because the LED device exhibits a spectral band of emission. It is necessary to calculate the absorption
factor of the sensitizer (1-10-Abs
PS) integrated on the overall
spectral region of the LED emission, which should be
expressed in photonic units (PELED), and this integral
should also be corrected by the fraction of incident light
transmitted by the Bc (10-Abs
Bc), (equation 2).
(2)
Because the main idea of this work is to provide an
easy method to calculate φD, it is fundamental to simplify
this calculation. Considering that measurements will be made at different PS concentrations and compared with a standard, even if the simplified equation proposed bellow has systematic errors, these errors will be the same for samples and standard.
Figure 2. (A) Top view of the schematic arrays of LEDs arranged around
the spectrophometric cuvette. The LEDs were connected in series and powered by a 3.0 V (DC) source. (B) Picture of the irradiation device at working conditions; the LEDs exhibited maximum emission at ca.
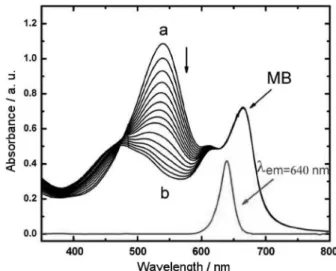
The first assumption is related with the Bc absorption. Although Bc does absorb the LED emission, this absorption
basically does not change during irradiation, i.e., the LED
emission maximum is just in an isosbestic point of the Bc absorption change profile during the photochemical reaction (Figure 3). Also the Bc concentration was kept constant in all experiments. Therefore, we will not consider the Bc absorption in the calculations, assuming that the changes that are due to Bc absorption are the same for samples and standard.
In terms of the PS absorption factor and LED emission, because the PS absorption is not large and does not change during irradiation, we propose to estimate the relative fraction of PS excited by the LED at each PS concentration by calculating the overlap integral (R) between PS
absorption (ABSPS) and LED emission (ELED) (equation 3),
instead of calculating the exact photon flux absorbed by the PS (equation 2).
(3)
Depending on the acceptor and on the solvent, 1O
2
lifetime may vary during irradiation. However, in water
the total quenching of 1O
2 by Bc (physical and chemical
reactions) is negligible compared to quenching by the
solvent (we have always obtained 1O
2 lifetime of 4 ± 0.5 µs
in all experimental conditions). Consequently, the PS
absorption and the 1O
2 lifetime did not change during
irradiation.
Considering that the Bcconcentration was kept constant
and in excess compared with PS, the Bc bleaching (kobs)
should follow pseudo first-order kinetics and can be calculated by mono-exponential fitting. Also the plot of kobs versus R can be approximated by a linear fit. The slope
of this curve is the rate constant of the chemical reaction of Bc with singlet oxygen (k), which is theoretically
proportional to the quantum yield of 1O
2 production (φD).
Note that the other factors that could affect the value of k,
i.e., the bimolecular rate constant of the chemical reaction
between Bc and 1O
2 and the 1O2 lifetime are unchanged.
In these experiments small dye concentrations were used and therefore there was no need to add SDS to avoid dimerization.
Results and Discussion
Before starting the chemical trapping experiments, it was important to test for the stability of the Bc solutions under illumination. The Bc solution was illuminated for several minutes using either a laser source that specifically excites Bc (Nd:YAG laser, 20 mW, 532 nm) or LEDs that
do not excite Bc (640 nm, set-up mount, see Experimental section). There was no absorbance change in both control experiments. Therefore, although Bc is susceptible to oxidation upon heating, it is photochemically inert.
When an aqueous solution containing Bc (1.0 a.u. in
540 nm) and MB (ca.10 µmol L-1) was irradiated with the
LED set up (Figure 2) the Bc absorbance decreased during the 8 min irradiation (Figure 3) and the color of the solution changed from purple to blue. Note that the MB absorption did not change during the experiment, indicating that electron transfer reactions that could lead to MB photobleaching, are
not taking place under such experimental conditions.25,30,31
In none of the phenothiazines tested, there was any change in the dye absorption during irradiation.
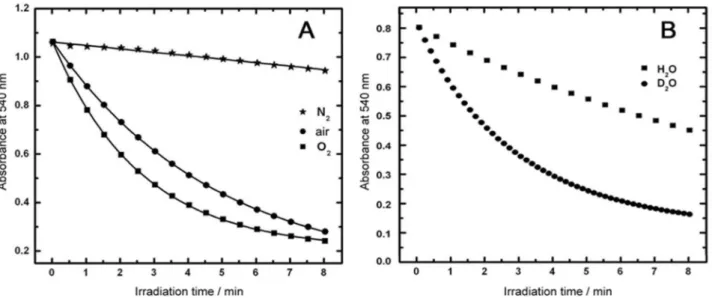
Decrease in Bc absorbance at 540 nm during the irradiation followed an exponential profile and fitted well to a single exponential function, allowing the calculation
of kobs (Figure 4A). The temporal decay of the Bc
photobleaching in the presence of MB was also compared in solutions with different oxygen concentrations. The bleaching efficiency increased with the increase in the oxygen concentration suggesting again the presence of type II oxidation processes (Figure 4A). Photobleaching induced by electron transfer reactions are usually accelerated in nitrogen-purged samples, because oxygen can suppress
triplet and radical intermediates.30,31
Lifetime of 1O
2 is longer in D2O (35-40 µs) than in
water.6,12,13 Assuming that no other interference occurs,
the steady-state concentration of 1O
2 would be ca.10 times
larger giving consequently ca.10 times faster reaction rate
in ca.100% D2O. This effect has been used to study the
role of 1O
2 in specific photochemical events by carrying
Figure 3. Absorption spectra of the Bc and MB (11.2 µmol L-1) solution
out experiments in water and in D2O under the same experimental conditions (Figure 4B). However, it is
important to emphasize that we were not using ca.100%
D2O in our experiments because the reaction mixture is
prepared in situ by using Bc solution in water (giving
around 90% D2O:H2O mixture). Even so, we have observed
ca. 4 times faster rate indicating that the bleaching of Bc
by MB excitation is more efficient in D2O than in water,
which proves that 1O
2 is the main species responsible for
the bleaching. These observations also indicate that Bc is
a specific 1O
2 scavenger and therefore, a good probe for
estimating φD.
Monoexponential decays of Bc absorbance as a function of time were observed for all dyes and concentrations
tested, facilitating the calculation of kobs. kobs was plotted
as a function of R, which was calculated for each dye concentration (Figure 5). The slope of these curves, found by least square fitting of the experimental data, allows the calculation of k (Table 1, first column). Assuming
the proportionality between k and φD and using MB as
standard it was possible to calculate φDvalues of azure A,
azure B and thionine (Table 1, second column). It is clear that the calculated values are very similar to those found in the literature or obtained by measuring NIR emission (Table 1, third column).
Conclusions
The chemical trapping protocol based in Bc and LED provides an efficient, inexpensive and simple method to
Figure 4. Absorbance at 540 nm as function of irradiation time:(A) in water samples purged with nitrogen (), air-saturated (), oxygen (); (B) air
saturated solutions in water () and in deuterium oxide (). The data were obtained in solutions similar to those used to obtain data of Figure 3.
Figure 5. Observable kinetic decays (kobs) of Bc absorbance at 540 nm
as a function of overlap integral (R, equation 2) obtained for different concentrations of MB (,[MB] in µmol L-1= 2.6; 5.3; 7.4; 11.2), Azure
A (, [Azure A] in µmol L-1 = 5.1; 8.1; 11.4), Azure B (,[Azure B] in
µmol L-1 = 3.4; 7.1; 9.4) and thionine (, [thionine] in µmol L-1 = 4.9;
8.0; 10.1).
Table 1. Quantum yield of singlet oxygen in water using Methylene Blue as reference (φD = 0.52), and red light emitting LED sources
(λem = 640 nm)
photosensitizers ka φ
D φD (literature)
Methylene Blue 0.47 ± 0.05 0.52 (reference) 0.52b,c
Azure A 0.41 ± 0.06 0.45 0.47d
Azure B 0.28 ± 0.05 0.31 0.29d
Thionine 0.54 ± 0.10 0.60 0.58c
aSlope k
obs × R. Slope andstandard deviation of three independent
measurements. bReferences 32 and 33; creference 34. dValues obtained
by NIR emission as described in the experimental section in 10 mmol L-1
quantitatively determine 1O
2 formation by a PS.Although
killing organisms and treating diseases with dyes and light is a very old process in humanity, now a days, people have to pay thousands of dollars to be treated by PDT. However, inexpensive PDT protocols can be easily established. Considering that finding new drugs represents an increasingly difficult and expensive task, the discovery of new PS for PDT can be a practical solution, especially for underserved populations. The method here presented may be of relevance in pursuing such solution.
Acknowledgments
The authors gratefully acknowledge the financial support and fellowships from Fundação de Amparo à Pesquisa do Estado de São Paulo (FAPESP), Conselho Nacional de Desenvolvimento Científico e Tecnológico (CNPq), Rede de Nanotecnologia Molecular e Interfaces (RENAMI) and Instituto do Milênio de Materiais Complexos (IMMC).
References
1. Foote, C. S.; Science1968, 162, 963.
2. Foote, C. S.; Photochem. Photobiol.1991, 54, 659.
3. Ichihashi, M.; Ueda, M.; Budiyanto, A.; Bito, T.; Oka, M.; Fukunaga, M.; Tsuru, K.; T. Horikawa; Toxicology2003, 189,
21.
4. Baier, J.; Maisch, T., Maier, M.; Engel, E.; Landthaler, M.; Bäumler, W.;Biophys. J.2006, 91, 1452.
5. Brown, S. B.; Brown, E. A.; Walker, I.; Lancet Oncol.2004, 5,
497.
6. Jarvi, M.T.; Niedre, M.J.; Patterson, M.S.; Wilson, B.C.;
Photochem. Photobiol.2002, 75, 382.
7. Silva, A. R. ; Pelegrino, A. C. ; Tedesco, A. C. ; Jorge, R. A.;
J. Braz. Chem. Soc.2008, 19, 491.
8. Tardivo, J. P.; Del Giglio, A.; Paschoal, L. H.; Baptista, M. S.;
Photomed. Laser Surg.2006,24, 528.
9. Tardivo, J. P.; Del Giglio, A.; Oliveira, C. S.; Gabrielli, D. S.; Junqueira, H. C.; Tada, D. B.; Severino, D.; Turchiello, R.; Baptista, M. S.; Photodiagn. Photodyn. Ther.2005, 2/3, 175.
10. Allison, R. R.; Downie, G. H.; Cuenca, R.; Hu, X.-H.; Childs, C. J. H.; Sibata, C. H. Photodiagn. Photodyn. Ther.2004, 1,
27.
11. Menezes, P. F. C.; Bagnato, V. S.; Johnke, R. M.; Bonnerup, C.; Sibata, C.; Allison, R.R.; Perussi, J. R.; Laser Phys. Lett. 2007, 4, 546.
12. Wilkinson, F.; Helman, W. P.; Ross, A. B.; J. Phys. Chem. Ref. Data1993, 22, 113.
13. Kochevar, I. E.; Redmond, R.W.; Methods Enzymol.2000, 319, 20.
14. Engelmann, F. M.; Mayer, I.; Araki, K.; Toma, H. E.; Baptista, M. S.; Maeda, H.; Osuka, A.; Furuta, H.; J. Photochem. Photobiol., A 2004, 163, 403.
15. Engelmann, F. M.; Mayer, I.; Gabrielli, D.; Araki, K.; Toma, H. E.; Kowaltowski, A.; Baptista, M. S.; J. Bioenerg. Biomembr. 2007, 39, 175.
16. Uchoa, A.F.; Knox, P.P.; Turchielle, R.; Seifullina, N.K.h.; Baptista, M.S.; Eur. Biophys. J.2008, 37, 843.
17. Spiller, W.; Kliesch, H.; Wohrle, D.; Hackbarth, S.; Roder, B.; Schnurpfeil, G.; J. Porphyrins Phthalocyanines 1998, 2, 145.
18. Aubry, J. M.; Rigaudy, J.; Nguyen, K.C.; Photochem. Photobiol. 1981, 33, 149.
19. Nardello, V.; Aubry, J. M.; Tetrahedron Lett. 1997, 38, 7361. 20. Tanaka, K.; Miura, T.; Umezawa, N.; Urano, Y.; Kikuchi, K.;
Higuchi, T.; Nagano, T.; J. Am. Chem. Soc.2001, 123, 2530. 21. Li, X.; Zhang, G.; Ma, H.; Zhang, D.; Li, J.; Zhu, D.; J. Am.
Chem. Soc.2004, 126, 11543.
22. von Elbe, J. H.; Schwartz, S.J.; Hildenbrand, B.E.; J. Food Sci. 1981, 46, 1713.
23. Escribano, J.; Pedreño, M. A.; García-Carmona, F.; Muñoz, R.;
Phytochem. Anal.1998, 9, 124.
24. Gasztonyi, M.N.; Daood, H.; Hájos M.T.; Biacs, P.; J. Sci. Food Agric.2001, 81, 932.
25. Gabrielli, D.; Belisle, E.; Severino, D.; Kowaltowski, A. J.; Baptista, M.S.; Photochem. Photobiol.2004, 79, 227. 26. Severino, D.; Junqueira, H. C.; Gabrielli, D.; Gugliotti, M.;
Baptista, M. S.; Photochem. Photobiol. 2003, 77, 459. 27. Junqueira, H. C.; Severino, D.; Dias, L. G.; Gugliotti, M.; Baptista,
M. S.; Phys. Chem. Chem. Phys.2002, 4, 2320.
28. Wetzler D. E.; Garcia-Fresnadillo, D.; Orellana, G.; Phys. Chem. Chem. Phys.2006, 8, 2249.
29. DeRosa, M C.; Crutchley, R. J.; Coord. Chem. Rev.2002, 233/234, 351.
30. Baptista, M. S.; Indig, G.L.; Chem. Commun.1997, 18, 1791.
31. Baptista, M. S.; Indig, G. L.; J. Phys. Chem. B1998, 102, 4678.
32. Usui, Y.; Tsukada, M.; Nakamura, M.; Bull. Chem. Soc. Jpn. 1978, 51, 379.
33. Tanielian, C.; Golder, L.; Wolff, C.; J. Photochem.1984, 25, 2. 34. Usui, Y.; Chem. Lett.1973, 2, 743.
Received: July 3, 2008
Web Release Date: October 16, 2008