Resources Alter the Structure and Increase
Stochasticity in Bromeliad Microfauna
Communities
Jana S. Petermann1,2,3*, Pavel Kratina4, Nicholas A. C. Marino5, A. Andrew M. MacDonald6, Diane S. Srivastava6
1Institute of Biology, Freie Universität Berlin, Königin-Luise-Str. 1–3, D-14195, Berlin, Germany,2 Berlin-Brandenburg Institute of Advanced Biodiversity Research (BBIB), D-14195, Berlin, Germany,3Department of Ecology and Evolution, University of Salzburg, Hellbrunnerstrasse 34, 5020, Salzburg, Austria,4School of Biological and Chemical Sciences, Queen Mary University of London, London, E1 4NS, United Kingdom,5
Department of Ecology, Biology Institute, Federal University of Rio de Janeiro (UFRJ), 7 Ilha do Fundão, Rio de Janeiro, RJ, PO Box 68020, Brazil,6Department of Zoology & Biodiversity Research Centre, University of British Columbia, 6270 University Blvd., Vancouver, BC, V6T 1Z4, Canada
Abstract
Although stochastic and deterministic processes have been found to jointly shape structure of natural communities, the relative importance of both forces may vary across different en-vironmental conditions and across levels of biological organization. We tested the effects of abiotic environmental conditions, altered trophic interactions and dispersal limitation on the structure of aquatic microfauna communities in Costa Rican tank bromeliads. Our approach combined natural gradients in environmental conditions with experimental manipulations of bottom-up interactions (resources), top-down interactions (predators) and dispersal at two spatial scales in the field. We found that resource addition strongly increased the abun-dance and reduced the richness of microfauna communities. Community composition shifted in a predictable way towards assemblages dominated by flagellates and ciliates but with lower abundance and richness of algae and amoebae. While all functional groups re-sponded strongly and predictably to resource addition, similarity among communities at the species level decreased, suggesting a role of stochasticity in species-level assembly pro-cesses. Dispersal limitation did not affect the communities. Since our design excluded po-tential priority effects we can attribute the differences in community similarity to increased demographic stochasticity of resource-enriched communities related to erratic changes in population sizes of some species. In contrast to resources, predators and environmental conditions had negligible effects on community structure. Our results demonstrate that bro-meliad microfauna communities are strongly controlled by bottom-up forces. They further suggest that the relative importance of stochasticity may change with productivity and with the organizational level at which communities are examined.
OPEN ACCESS
Citation:Petermann JS, Kratina P, Marino NAC, MacDonald AAM, Srivastava DS (2015) Resources Alter the Structure and Increase Stochasticity in Bromeliad Microfauna Communities. PLoS ONE 10 (3): e0118952. doi:10.1371/journal.pone.0118952
Academic Editor:Christopher Joseph Salice, Towson University, UNITED STATES
Received:August 1, 2014
Accepted:December 23, 2014
Published:March 16, 2015
Copyright:© 2015 Petermann et al. This is an open access article distributed under the terms of the Creative Commons Attribution License, which permits unrestricted use, distribution, and reproduction in any medium, provided the original author and source are credited.
Data Availability Statement:Data have been uploaded to Dryad under the following doi:10.5061/ dryad.8k55h(http://dx.doi.org/10.5061/dryad.8k55h).
Introduction
Ecologists have long sought to understand which factors generate the variation within and among communities that is so ubiquitous in nature. Deterministic, niche-related processes such as environmental filtering [1], competition for resources [2] and top-down control [3] have been studied extensively. Species sorting resulting from these environmental conditions and species interactions can cause the predictable dominance of some taxa and the exclusion of others, causing communities of similar environments to converge in to similar species compo-sitions. However, neutral forces such as demographic stochasticity can also generate structure within ecological communities via ecological drift [4]. Dispersal limitation is another structur-ing force that is predominantly regarded as neutral, even though dispersal rates can vary be-tween organisms [5]. Deterministic and stochastic forces likely influence ecological
communities in concert [6]. For example, species sorting resulting from interactions such as competition for resources and predation can be disrupted by dispersal [7], reducing variability among communities (i.e. lower beta diversity) but enhancing local richness by allowing exclud-ed or novel species to enter the community [8–10].
Ecologists have yet to determine under which conditions, in which environments or for which organism groups particular structuring forces or their combinations prevail [11–13]. Partitioning the individual mechanisms in natural settings is particularly challenging as the in-terplay among these key forces often has complex effects on both local richness and composi-tional similarity among communities. Furthermore, priority events in the history of
community assembly can mask potential deterministic influences on community structure [14].
In this study we use a natural system that can be relatively easily manipulated to conduct field tests of three deterministic structuring forces (environmental filtering, resource competi-tion and predacompeti-tion) and one stochastic force (dispersal) identified as potentially important by more controlled but simplified systems [15]. Tank bromeliads are neotropical plants that har-bor diverse multitrophic aquatic communities in the small water bodies that accumulate be-tween their leaves (phytotelmata). These communities largely depend on leaf litter as a basal resource [16]. Due to their small size and relative autonomy from the surroundings bromeliad communities are useful systems for experimental studies involvingin situmanipulations of community assembly. We focus on the microfauna communities in bromeliads, including all non-bacterial, non-viral microscopic organisms such as flagellates, ciliates, amoebae, algae and predatory microscopic metazoans such as rotifers and copepods. In nature, these communities are subject to varying environmental conditions within and among bromeliads such as water temperature and light regimes. Furthermore, resource input may vary strongly and the abun-dance of organisms at higher trophic levels may differ among bromeliads, resulting in differen-tial strengths of bottom-up and top-down control on the microfauna. Dispersal is assumed to act as a neutral driver of community assembly since microfauna are mainly wind-, water- and vector-dispersed [17] and differences in dispersal abilities among species within these nities are relatively small. Because of the growth pattern of bromeliads their inhabiting commu-nities are likely connected by hierarchically structured dispersal: local dispersal among the semi-independent leaf axils within a bromeliad likely may occur more frequently than regional dispersal between individual bromeliad plants.
Here, we examine the influence of environmental conditions, resources, predation and dis-persal on bromeliad microfauna community structure. After homogenizing natural communi-ties to exclude potential priority effects, we measured environmental variables and then explicitly manipulated resource input and predator presence in a field experiment. Because a spatial signal in community structure can result from effects of spatially correlated
environmental variables as well as from dispersal limitation, we experimentally manipulated dispersal at local (among leaf axils) and regional spatial scales (among bromeliads). We then assessed effects of our experimental treatments by examining changes in the structure of mi-crofauna communities consisting of five major functional groups (algae, amoebae, flagellates, ciliates and predatory microfauna).
We hypothesized that:
1. If deterministic processes dominate, then community structure will only respond to differ-ences in environmental conditions and to the manipulation of species interactions such as resource competition and predation.
2. If dispersal as a stochastic process dominates, then community structure will change as a re-sponse to the experimental manipulation of dispersal at both, local and regional scales. 3. If deterministic processes and dispersal both contribute to community structure, then the
experimental increase in regional dispersal rates (among bromeliads) should result in a much greater change in community composition than an experimental increase in local dis-persal rates (within bromeliads). This is because distant sites will develop more different communities, through differences in environmental factors and species interactions, than communities within the same region, exposed to more similar conditions.
Materials and Methods
Study site and system
This study was carried out in April and May 2010 at the Estación Biológica Pitilla (10°59'N, 85° 26'W) in the Área de Conservación Guanacaste (http://www.acguanacaste.ac.cr), north-west-ern Costa Rica under research permit N° ACG-PI-028-2010 (Ministerio del Ambiente, Energía y Telecomunicaciones). The station is situated at an altitude of 700m and is surrounded by pri-mary and secondary tropical rainforest and horse pastures. Bromeliads occur in all of these habitats. We used three dominant tank bromeliad species:Werauhia sanguinolenta(Linden ex Cogn. & Marchal) J.R. Grant,W.gladioliflora(H. Wendland) J.R. Grant andW.kupperiana
(Suessenguth) J.R. Grant and initiated the experiment after the first strong rainfall of the wet season.
Experimental set up and data collection
We selected similar-sized large bromeliads (diameter range: 0.98–2.15m, mean ± standard error of the mean (sem): 1.37±0.05m), in three habitats varying in canopy openness in order to include a large range in environmental conditions: secondary forest (relatively closed canopy with low light conditions), mixed habitat (mostly edge of the forest with mixed light condi-tions) and pasture (mostly open canopy with high light availability). We mixed water collected from 44 bromeliads growing in the same three habitats near our experimental bromeliads to in-clude the same species of inhabiting organisms but homogenize the initial composition of ex-perimental communities. We used a suction device with a tube to extract the water from the bromeliads after careful mixing to make sure all organisms were suspended in the water. With a filter with a mesh size of 850μm we removed large detritus particles and macroscopic
habitats, nine tubes per bromeliad (for a schematic depiction of the experimental design see
Supporting Information, Fig. A inS1 Supporting Information). Those 27 bromeliads were a
subset of the 44 bromeliads from which the initial pool of species for the communities were collected.
The 27 experimental bromeliads were divided into three“trophic”treatments: control, in-crease of bottom-up effects by resource addition, addition of top-down effects by predator ad-dition. For the resource-addition treatment, we collected leaf litter from the forest floor, chopped the material into 1-cm2pieces and sterilized it by boiling it for two 10 minute
inter-vals–with a two-day period in between to eliminate microfauna emerging from resting stages. We added 0.7g dry weight of sterilized litter to each experimental community in the resource-addition treatment group. This amount represents more than double the amount of litter we found on average in natural bromeliad tanks (Kratina et al. unpublished data). The experi-mental communities in the predator-addition treatment each received one large (late develop-mental stage, 4thinstar) and two small (early developmental stage, 2ndinstar)Culex jenningsi
Dyar&Knab mosquito larvae. Those numbers represent average natural densities in bromeli-ads at the field site. Control communities did not receive any additions. All tubes were then covered with fine mosquito mesh to prevent insects from ovipositing and to monitor emerg-ing adult mosquitoes. To keep predation pressure relatively constant over the course of the study, mosquito larvae were replaced whenever they pupated and emerged as adults. We could not observe the number of larvae during the study without disturbing the community, so we could not replace larvae that had died. However, this number was relatively low and all tubes in the predator treatment still contained mosquito larvae at the end of our study. The tubes were placed into separate leaf axils in the bromeliad with no water exchange between the tube and the bromeliad.
We nested a hierarchical dispersal manipulation within each trophic treatment in each bro-meliad. In each bromeliad, three of the nine experimental communities served as manipula-tions of“regional dispersal”between bromeliads, i.e., the removal of any dispersal limitation at the regional scale. After gently mixing the contents of the tube, we extracted 1 ml of water from each of the three experimental communities in each of the three bromeliads of the same trophic treatment in the same habitat. We then mixed the resultant 9 ml in a common vial and redis-tributed 1 ml of this mixture into each regional dispersal community. Manipulations of“local dispersal”within bromeliads (i.e., the removal of dispersal limitation at the local scale) were treated similarly but only the 3 ml from the three“local”communities within a bromeliad were mixed. In three no-dispersal“control”communities we pipetted 1ml out of each community and placed the same liquid back into the tube to control for disturbance from pipetting. In these control communities, natural dispersal was the only means of exchange between commu-nities, so patterns of dispersal limitation were allowed to develop over the course of the experi-ment. We performed the dispersal manipulations every four days over the four-week
experimental duration.
their measurement at the end of the study only represents a snapshot of the environmental conditions and only large effects will be picked up by the analysis. We then collected microfau-na samples from all 243 experimental communities and fixed them with acid 5%-iodine Lugol’s solution. The fixed samples were transferred to the University of British Columbia (Vancouver, Canada) where all organisms were counted under an inverted microscope (in 50-μl subsamples
and 200x magnification). We used and expanded a photographic identification key developed for the microfauna living in bromeliads at our field site [18] to identify taxa based on their mor-phology and grouped them into“morphospecies”(hereafter referred to as“species”). The en-tire samples were screened for larger organisms (rotifers, copepods, flatworms, nematodes and mosquito larvae) under a dissecting scope. Species that occurred in extremely high numbers (several thousand per subsample) were counted in 20 fields of view (200x magnification) and their abundances per 50μl estimated by extrapolation. All algal chain colonies were grouped
into a single morphospecies and counted on a per-strand basis (multiple cells). Their abun-dance was calculated as the number of individual cells to be comparable with the other proto-zoan species using an average number of 17.65 cells per strand (based on a sample of n = 20, standard error of the mean = 5.11).
Statistical analyses
Abundance and richness. We analyzed the effects of resource addition, predation and dis-persal on the overall abundance and species richness (hereafter richness, our measure of alpha diversity) and on the abundance and richness of the main functional groups. All abundance data were natural-log-transformed to achieve normality and homogeneity of variance. This conservative approach removes samples with zero abundance from the analysis. We repeated all analyses after adding a value smaller than the smallest recorded density to the data before log transformation. These additional analyses showed the same results and are therefore not presented.
To account for the hierarchical error structure we analyzed abundance and richness with mixed effects models using the function lme in packagenlme[19] in R, version 2.15.1 [20]. These analyses are described in more detail in the Supporting Information. To explore to what degree patterns in richness were simply due to variations in abundance, we used the function rarefy in R packagevegan[21]. We additionally fit the mixed effects models with a number of different spatial autocorrelation functions [22]. Spatial autocorrelation did not show any effects (for details seeMethodsand Table A inS1 Supporting Information), so we present results from models without autocorrelation structure.
Community composition. We used multivariate analyses to test for the effects of canopy openness, temperature, trophic treatment and dispersal on community composition [23]. Our response variable was a Bray-Curtis-dissimilarity matrix resulting from a Hellinger-trans-formed species-by-site matrix [24], with“site”being one experimental community. We ac-counted for effects of spatial arrangement of the communities (seeSupporting Information) and then conducted a permutational multivariate analysis of variance (PERMANOVA). After detecting significant trophic treatment effects on community composition, we examined dis-persion of community composition within trophic treatment levels (i.e. how much the commu-nities of one treatment differed among each other in terms of their composition). Differences in dispersion between levels of the dispersal manipulation were then analyzed using the same procedure.
To explore effects of varying alpha diversity (richness) on differences in community compo-sition [11,25,26] we additionally used a Raup-Crick dissimilarity measure (seeSupporting
Results
Abundance and richness
We counted a total of 62 species of protozoa and micrometazoa in our experimental communi-ties and classified them into five major functional groups: algae (11 species), flagellates (17 species), ciliates (11 species), amoebae (11 species), predatory microfauna (11 species, includ-ing rotifers, copepods and nematodes).
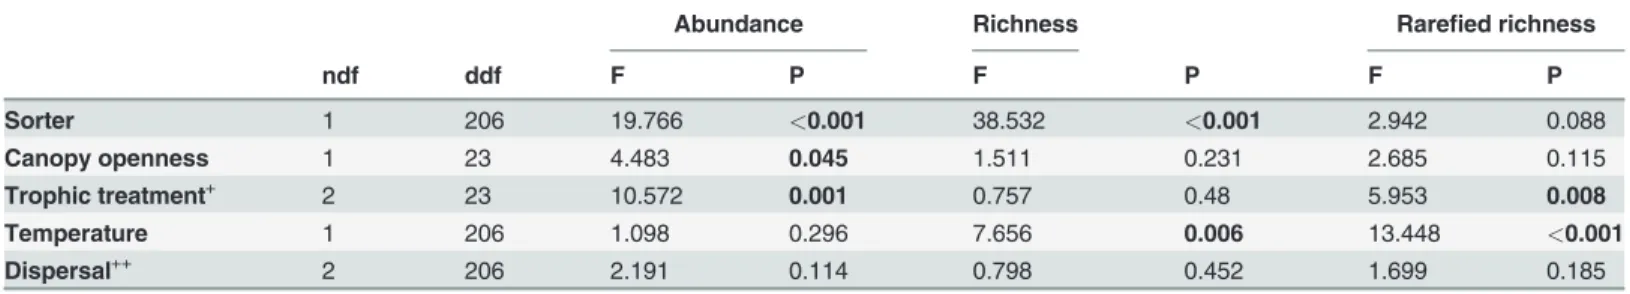
Overall, our trophic treatments had strong effects on microfauna abundance (Table 1), but largely due to the additions of resource rather than predators (Fig. 1A). Trophic treatment effects on overall richness only became apparent after data were rarefied because the large dif-ferences in abundance masked difdif-ferences in richness in terms of the number of species per individuals. Rarefied richness in the resource-addition treatment was significantly lower com-pared with the other treatments (Table 1,Fig. 1B and C). Predator addition had no effect on overall microfauna abundance or richness (Fig. 1).
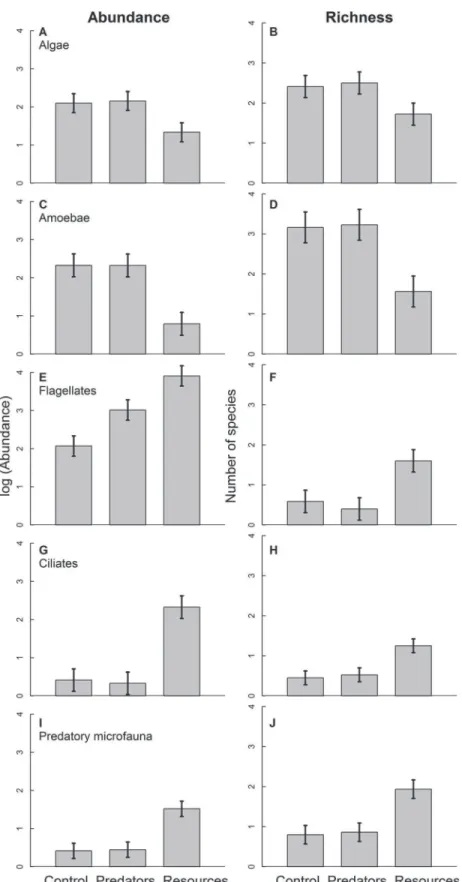
Diverging patterns emerged for individual functional groups (Fig. 2, Tables2and3). Abun-dance and richness of all groups responded to our trophic treatments, however, in different di-rections. This differential reaction shifted functional group composition. Algae and amoebae decreased in abundance and richness with resource addition (Fig. 2A, B, G, H) while the other groups increased (Fig. 2C, D, E, F, I, J). Flagellates were the only group that increased in abun-dance with predator addition (Fig. 2E). Trophic treatment effects on amoeba and ciliate rich-ness disappeared after rarefication (F2,23= 0.267, P = 0.768 and F2,22= 1.520, P = 0.241,
respectively), suggesting that differences in abundance were the main cause for the richness dif-ferences in these groups. Difdif-ferences between trophic treatments in the other groups remained significant after rarefaction, indicating that changes in abundance did not completely explain effects of trophic treatments on the richness of algae, flagellates and predatory microfauna.
Only two environmental variables had significant effects on the experimental communities: canopy openness and water temperature. The other environmental variables were removed from further analyses. Canopy openness and water temperature both showed a spatial signal (i.e., they were both spatially autocorrelated). Canopy openness influenced overall microfauna abundance (Table 1) with higher abundance in bromeliads under more open canopies. Howev-er, this effect was driven by three bromeliads with very open canopy conditions (>40% canopy
openness) and was not significant when those were removed. Similarly, the negative effect of water temperature on overall microfauna richness (Table 1) was largely caused by two experimental communities with extremely high temperatures (>32°C) and very low richness
Table 1. Results of mixed effects model analyses for log-transformed abundance, richness and rarefied richness of all organisms combined, with“bromeliad”treated as a random effect.
Abundance Richness Rarefied richness
ndf ddf F P F P F P
Sorter 1 206 19.766 <0.001 38.532 <0.001 2.942 0.088
Canopy openness 1 23 4.483 0.045 1.511 0.231 2.685 0.115
Trophic treatment+ 2 23 10.572 0.001 0.757 0.48 5.953 0.008
Temperature 1 206 1.098 0.296 7.656 0.006 13.448 <0.001
Dispersal++ 2 206 2.191 0.114 0.798 0.452 1.699 0.185
+Trophic treatment levels: control, predator addition and resource addition. ++Dispersal levels: control, local dispersal and regional dispersal.
P-values<0.05 are printed in bold. ndf = numerator degrees of freedom, ddf = denumerator degrees of freedom.
(3 species). Negative effects of water temperatures on the abundance of ciliates and on the
richness of amoebae (Tables2and3), were also driven by these two communities.
The dispersal manipulation had no effect on abundance or richness of the combined micro-faunal community, or of any of the functional groups (Tables1and2). Interactions between the trophic treatment and the dispersal manipulation (and other interactions such as canopy openness x dispersal and temperature x dispersal) were also not significant in any analysis. In-cluding spatial autocorrelation structures into the models never improved their fit (Supporting Information, Table A inS1 Supporting Information), indicating that the spatial arrangement of bromeliads was not an important driver of microfauna abundance or richness. Only models without autocorrelation structure and without interaction terms are therefore presented.
Community composition
The spatial arrangement of the communities had an influence on their composition (F2,234=
1.8099, P = 0.005 for linear effects, F4,232= 2.8058, P = 0.005 for the four selected PCNM
vec-tors) but this did not qualitatively affect any results. In the following section we present only re-sults from analyses in which we removed the spatial trends.
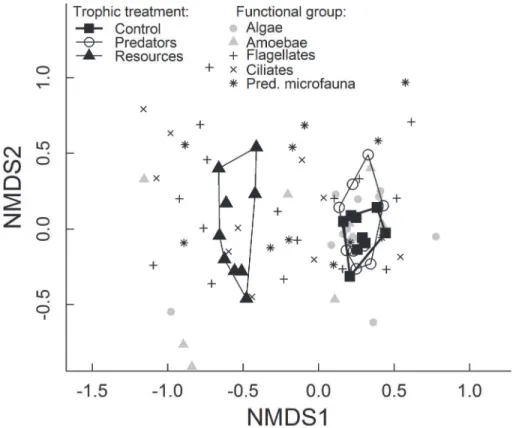
We found that experimental communities with additional resources were dramatically dif-ferent in their species composition from control and predator-addition communities (Fig. 3,
Table 4and Supporting Information, Fig. B inS1 Supporting Information). Furthermore,
dis-persion of community composition (manifested in the spread of symbols of communities in
Fig. 3and measured as their distance to the centroid) among communities within the
resource-addition treatment was larger than among communities within the control and predator-addi-tion treatments, respectively (F2,234= 3.267, P = 0.040). This means that communities receiving
added resources were more dissimilar from each other (higher beta diversity) than control communities and communities with predators. Communities with different dispersal manipu-lations did not differ in their community composition (Table 4), nor did within-group disper-sion differ between dispersal manipulations (F2,234= 1.298, P = 0.275). We detected a small
effect (see R2,Table 4) of canopy openness and temperature on microfauna species
composi-tion. Removing abundance differences between communities by rarefying the community ma-trix before the analysis did not change differences in composition but removed differences in dispersion (results not shown). This suggests that the differences in dispersion are largely driv-en by changes in population sizes of some species.
Differences in composition between communities under different trophic treatments did not solely result from differences in alpha diversities since the analysis of the modified
Fig 2. Mean log-transformed abundance and richness of algae (A, B), amoebae (C, D), flagellates (E, F), ciliates (G, H) and predatory microfauna (I, J).Those levels are control, predator addition and resource addition. The numbers refer to a 50-μl subsample. Error bars show±1 standard error of the mean.
Raup-Crick dissimilarity matrix gave equivalent results to the ones from the Bray-Curtis ma-trix. However, canopy openness and temperature did not show significant effects on communi-ty composition when using the Raup-Crick metric (Supporting Information, Table B inS1
Supporting Information), so differences in composition related to those two environmental
variables were likely driven by changes in alpha diversities.
Discussion
The aim of this study was to disentangle the role of deterministic niche processes from the more stochastic process of dispersal limitation in structuring natural bromeliad microfauna communities. We found strong effects of detrital resources on community abundances, rich-ness and composition, but little effect of dispersal limitation either alone or in combination with niche-based processes. These results substantially support our first hypothesis of a strong influence of species sorting. Resource addition resulted in predictable shifts in functional group composition but caused an increase in the dispersion of community composition at the species level, suggesting that the level of organization (functional group vs. species composition) may define the relative importance of deterministic and stochastic processes.
Table 2. Results of mixed effects model analyses for log-transformed abundance and richness of algae, amoebae andflagellates, with
“bromeliad”treated as a random effect.
Algae: Abundance Richness Amoebae: Abundance
Richness Flagellates: Abundance
Richness
ndf ddf F P F P ddf F P F P ddf F P F P
Sorter 1 189 46.736 <0.001 1.440 0.232 182 20.72 <0.001 14.127 <0.001 74 86.525 <0.001 42.291 <0.001
Canopy openness
1 23 0.041 0.841 3.521 0.073 23 0.774 0.388 1.750 0.199 19 0.304 0.588 0.09 0.768
Trophic treatment+
2 23 25.644 <0.001 7.041 0.004 23 67.304 <0.001 23.208 <0.001 19 14.418 <0.001 7.369 0.004
Temperature 1 189 0.621 0.432 0.937 0.334 182 2.123 0.147 4.987 0.027 74 3.706 0.058 0.335 0.565
Dispersal++ 2 189 1.555 0.214 1.621 0.200 182 1.404 0.248 0.030 0.970 74 0.013 0.987 0.286 0.752
+
Trophic treatment levels: control, predator addition and resource addition.
++
Dispersal levels: control, local dispersal and regional dispersal, P-values<0.05 are printed in bold. ndf = numerator degrees of freedom, ddf =
denumerator degrees of freedom doi:10.1371/journal.pone.0118952.t002
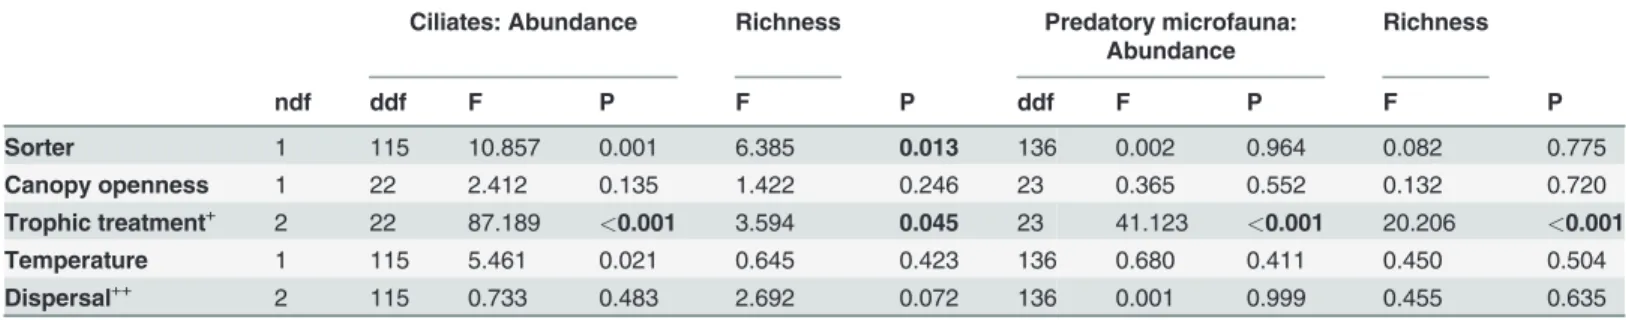
Table 3. Results of mixed effects model analyses for log-transformed abundance and richness of ciliates and predatory microfauna with
“bromeliad”treated as a random effect.
Ciliates: Abundance Richness Predatory microfauna: Abundance
Richness
ndf ddf F P F P ddf F P F P
Sorter 1 115 10.857 0.001 6.385 0.013 136 0.002 0.964 0.082 0.775
Canopy openness 1 22 2.412 0.135 1.422 0.246 23 0.365 0.552 0.132 0.720
Trophic treatment+ 2 22 87.189 <0.001 3.594 0.045 23 41.123 <0.001 20.206 <0.001
Temperature 1 115 5.461 0.021 0.645 0.423 136 0.680 0.411 0.450 0.504
Dispersal++ 2 115 0.733 0.483 2.692 0.072 136 0.001 0.999 0.455 0.635
+Trophic treatment levels: control, predator addition and resource addition.
++Dispersal levels: control, local dispersal and regional dispersal, P-values<0.05 are printed in bold. ndf = numerator degrees of freedom, ddf =
Deterministic processes: bottom-up
Bottom-up control was the strongest and most prevalent effect driving several community characteristics, irrespective of differences in environmental conditions or experimental dispers-al levels. Adding resources in the form of leaf litter increased overdispers-all microfauna abundance,
Fig 3. Non-metric multidimensional scaling (NMDS) representation of community- and species responses to nutrient and predator addition.Average microfauna communities are shown as large symbols with contours drawn around communities of the same trophic treatment (total n = 27). Species are depicted by smaller symbols coded according to their functional group identity. Stress = 0.10, non-metric fit R2= 0.99, linear fit R2= 0.95.
doi:10.1371/journal.pone.0118952.g003
Table 4. Effects of environmental and experimental variables on community composition. Results are from a PERMANOVA on the Bray-Curtis dissimilarity matrix of residuals from the spatial model.
df SS MS F R2 P
Sorter 1 0.642 0.642 13.866 0.048 <0.001
Canopy openness 1 0.295 0.295 6.382 0.022 <0.001
Trophic treatment+ 2 1.544 0.772 16.679 0.116 <0.001
Temperature 1 0.196 0.196 4.23 0.015 <0.001
Dispersal++ 2 0.05 0.025 0.537 0.004 0.984
Residuals 229 10.597 0.046 0.795
Total 236 13.323 1
+Trophic treatment levels were: control, predator addition and resource addition. ++Dispersal levels were: control, local dispersal, regional dispersal.
P-values<0.05 are printed in bold. ndf = numerator degrees of freedom, ddf = denumerator degrees of freedom.
decreased rarefied richness and shifted species composition. Abundances of certain fast-grow-ing species were boosted strongly by the additional resources while overall species incidences remained unchanged, resulting in communities with less species per number of individuals. The decrease in alpha diversity with increased resources agrees with studies from grasslands [27] where strong competitors dominate the plant communities after fertilization.
In our study, resource addition also shifted functional group composition of microfauna communities. Flagellates (the most abundant group) increased most strongly as a response to resource addition, driving overall abundance patterns. Flagellates have short generation times [28] and have been found to respond rapidly to changing conditions [29]. These groups can ex-ploit additional resources more quickly than other groups and therefore benefitted from nutri-ent addition most, at least in the short term [30]. Predatory microfauna (rotifers and
copepods) likely increased in their abundance and richness as a response to the increasing abundance of their prey (flagellates and ciliates). In contrast to the other groups, algae and amoebae declined in abundance and richness with increased resources. The photoautotroph algae likely declined with the associated decrease in light caused by leaf litter addition. Amoe-bae are known to show relatively slow responses to changing environmental conditions [31] and were likely outcompeted by the fast-responding groups (flagellates and ciliates).
Deterministic processes: top-down
Unexpectedly, only flagellate abundance increased with predator presence while overall micro-fauna abundance and the abundance of other groups did not change. Flagellates might have benefited from predators through a reduction in competition or predation by other groups pos-sibly arising from size-selective feeding by mosquitoes [32], but more likely, nutrient cycling enhanced by predators (shown for higher trophic levels in bromeliads by [33]) might have benefited the flagellates disproportionally in a way similar to the resource treatment.
It is not clear why the other groups did not change in response to the predators. Although we mimicked average natural densities of mosquitoes in bromeliads in the area (Srivastava, un-published data; [34,35]), our experimental densities were kept constant. Yet, mosquito densities vary greatly between leaf axils even within bromeliads (pers. obs.) due to oviposition events and to predation pressure from larvae of the damselflyMecistogaster modestaSelys [36,37]. Moreover, the microfauna communities themselves can consist of several more or less distinct trophic levels, potentially preventing the emergence of clear, unidirectional effects. A number of studies have furthermore shown rapid plastic changes (e.g., the formation of resting stages) or evolutionary adaptations of protozoan and algal prey species to the presence of predators, resulting in a dampening of top-down control [38,39]. For these reasons, we remain cautious in the interpretation of the weak predator effects on microfauna communities.
Deterministic processes: environmental conditions
Only canopy openness and temperature had effects on community structure, and those were entirely due to high-temperature or high-canopy openness outlier communities. In a par-allel observational study a number of habitat variables also influenced the structure of natural microfauna communities (canopy openness, height of the bromeliad above ground and for in-dividual functional groups also pH, temperature and the number of live leaves of the bromeli-ad), however, explained variance was relatively low (Kratina et al. unpublished data).
were less variable and had different mean values (higher pH and lower oxygen concentrations) than in natural leaf wells.
Stochastic process: dispersal limitation
While we detected a spatial signal in community composition, its inclusion in the models did not change the strong influence of the trophic treatment or the lack of dispersal effects. Fur-thermore, we did not find an influence of spatial arrangement on abundance and richness, and dispersal treatments had no effect on community structure. Instead, communities appeared to maintain their initial composition over the duration of the experiment, with most species being present at low abundance and extinctions being rare. We considered dispersal limitation a sto-chastic factor. However, had it affected only certain species, so operating in a deterministic fashion, we would similarly have seen changes in community composition following our dispersal manipulations.
Environmental differences between bromeliads in the field did not lead to strong species sorting in our experiment, although natural bromeliad communities differ from each other (Kratina et al. unpublished data). One interpretation of our results is that by homogenizing mi-crofauna communities we overcame any priority effects of dispersal limitation that underlay these natural community differences. Whereas dispersal limitation has been detected in pitcher plant microfauna [41], and low prey dispersal can increase regional diversity in pond zooplank-ton [42], dispersal manipulation does not always affect local diversity [42,43]. Our results agree with other studies of bromeliad microfauna finding no relationship between spatial distance among bromeliads and community composition [40]. This suggests that dispersal is generally not limiting at these spatial scales (*100 m) in bromeliad microfauna. However, since these
organisms are rarely specialized on bromeliads as a habitat, other water bodies as source habi-tats should be taken into account in future studies, even if they only exist temporarily (such as puddles or water-filled flowers, [44]). Protozoa and small metazoa may be dispersed by wind, water or by other organisms that act as biotic vectors [17,45]. Dispersal via these vectors likely leads to relatively similar dispersal rates across species in microfauna communities in bromeli-ads, i.e. neutral dispersal processes. However, microfauna propagule characteristics can play a role in determining dispersal rate and distance as well, especially over small distances [5,45– 47]. Unfortunately, our knowledge on dispersal processes in microorganisms in natural com-munities is still limited [48].
The relative importance of deterministic versus stochastic forces
Our study of species-rich natural communities strengthens the results from more controlled experimental mesocosms [15] by showing a stronger influence of stochasticity on species com-position under high resource input compared with control conditions. We established our ex-perimental communities with non-diluted water from natural bromeliads containing protists at high natural densities with populations likely being close to their carrying capacity. The ho-mogenization at the start of the experiment and the direct crossed dispersal treatment allowed us to exclude priority effects and dispersal limitation, leaving demographic stochasticity (i.e. stochastic mortality and reproduction) as the likely underlying mechanism producing dissimi-larity over time among communities with added resources.
communities [51]. However, in another study, the alpha and beta diversity of lake benthic in-vertebrate communities was reduced after nutrient enrichment [52]. One of the underlying mechanisms that have been proposed to drive changes in beta diversity along the productivity gradient is cyclic species turnover which is expected to be faster under increased productivity [53]. Unfortunately, the detection of turnover processes requires detailed long-term data sets that are rarely available.
In contrast to the increased stochasticity at the species level with higher resource availability, our study shows that at the functional-group level, shifts in composition towards communities dominated by flagellates and ciliates were strong and predictable. The general pattern emerging from this and other studies is that not only are stochastic and deterministic forces jointly struc-turing communities [6] but we are beginning to identify particular conditions and levels of or-ganization (i.e. species vs. functional groups) at which a given structuring force is relatively more important. At functionally defined higher-order levels that integrate over species (e.g., functional groups) community composition appears to be driven more strongly by determin-istic forces such as competition, and is therefore relatively predictable. Below these levels, com-munities are subject to stochastic assembly processes and their species composition is less predictable. Similar results were found for temperate grassland communities whose functional group composition converged predictably over the course of community assembly [54]. In grasslands, the composition of species traits has also been found to converge in a deterministic fashion while the identity of coexisting species was more strongly driven by priority effects [55,56]. These patterns might ultimately result from self-organized assembly processes [57]. Whereas trait-based analyses have proven useful in community assembly and ecosystem func-tion studies in other systems they have rarely been attempted with microfauna (but see [58,59,60]). These analyses could improve our understanding of the structure and dynamics of complex natural communities and remain a promising venue for future research.
Supporting Information
S1 Supporting Information. Supporting information including Supporting Statistical Methods, Fig. A, Fig. B, Table A and Table B.
(DOCX)
Acknowledgments
This article is dedicated to the memory of José Ángel Calvo Obando who supported our re-search on many occasions. We thank the Área de Conservación Guanacaste (ACG), Costa Rica for making this work possible and are grateful to R. Blanco, P. Rios, M. Rios, C. Moraga and J. Sihezar for logistic support in the field and to C. Young, N. Lidell, A. Au, P. Preston for help in the lab. The following people assisted with the identification of microfauna and are gratefully acknowledged: D. Acosta (Universidad de Puerto Rico, amoebae and ciliates), D. Lynn (ciliates, University of British Columbia), D. Tikhonenkov (flagellates, UBC), T. Heger (amoebae, UBC). Furthermore, we thank to T. Caruso (Queen University, Belfast) for comments on an earlier version of the manuscript.
Author Contributions
References
1. Silvertown J, Dodd ME, Gowing DJG, Mountford JO. Hydrologically defined niches reveal a basis for species richness in plant communities. Nature 1999; 400: 61–63.
2. Tilman D. Resource competition and community structure. Princeton: Princeton University Press; 1982.
3. Chesson P, Kuang JJ. The interaction between predation and competition. Nature 2008; 456: 235– 238. doi:10.1038/nature07248PMID:19005554
4. Hubbell SP. The Unified Neutral Theory of Biodiversity and Biogeography. Princeton: Princeton Uni-versity Press; 2001.
5. De Bie T, De Meester L, Brendonck L, Martens K, Goddeeris B, Ercken D, et al. Body size and dispersal mode as key traits determining metacommunity structure of aquatic organisms. Ecol Lett 2012; 15: 740–747. doi:10.1111/j.1461-0248.2012.01794.xPMID:22583795
6. Adler PB, Hille Ris Lambers J, Levine JM. A niche for neutrality. Ecol Lett 2007; 10: 95–104. PMID:
17257097
7. de Boer MK, Moor H, Matthiessen B, Hillebrand H, Eriksson BK. Dispersal restricts local biomass but promotes the recovery of metacommunities after temperature stress. Oikos 2014; 123: 762–768.
8. Cadotte MW. Dispersal and species diversity: A meta-analysis. Am Nat 2006; 167: 913–924. PMID:
16649154
9. Declerck SAJ, Winter C, Shurin JB, Suttle CA, Matthews B. Effects of patch connectivity and heteroge-neity on metacommunity structure of planktonic bacteria and viruses. Isme J 2013; 7: 533–542. doi:10.
1038/ismej.2012.138PMID:23178674
10. Simonis JL, Ellis JC. Bathing birds biasβ-diversity: Frequent dispersal by gulls homogenizes fauna in a rock-pool metacommunity. Ecology 2013; 95: 1545–1555.
11. Chase JM, Myers JA. Disentangling the importance of ecological niches from stochastic processes across scales. Philosophical Transactions of the Royal Society B: Biological Sciences 2011; 366: 2351–2363. doi:10.1098/rstb.2011.0063PMID:21768151
12. Chase JM. Drought mediates the importance of stochastic community assembly. Proc Natl Acad Sci U S A 2007; 104: 17430–17434. PMID:17942690
13. Chase JM, Biro EG, Ryberg WA, Smith KG. Predators temper the relative importance of stochastic pro-cesses in the assembly of prey metacommunities. Ecol Lett 2009; 12: 1210–1218. doi: 10.1111/j.1461-0248.2009.01362.xPMID:19723282
14. Chase JM. Community assembly: when should history matter? Oecologia 2003; 136: 489–498. PMID:
12836009
15. Chase JM. Stochastic Community Assembly Causes Higher Biodiversity in More Productive Environ-ments. Science 2010; 328: 1388–1391. doi:10.1126/science.1187820PMID:20508088
16. Benzing DH. Vascular Epiphytes. Cambridge: Cambridge University Press; 1990.
17. Maguire B. The passive dispersal of small aquatic organisms and their colonization of isolated bodies of water. Ecol Monogr 1963; 33: 161–185.
18. Srivastava DS, Bell T. Reducing horizontal and vertical diversity in a food web triggers extinctions and impacts functions. Ecol Lett 2009; 12: 1016–1028. doi:10.1111/j.1461-0248.2009.01357.xPMID:
19702635
19. Pinheiro JC, Bates DM, DebRoy S, Sarkar D, R Development Core Team. nlme: Linear and Nonlinear Mixed Effects Models. R package version 3.1–102; 2011.
20. R Development Core Team. R: A Language and Environment for Statistical Computing. 2.13.2 Vienna, Austria: Foundation for Statistical Computing; 2011.
21. Oksanen J, Blanchet FG, Kindt R, Legendre P, O'Hara B, Simpson GL, et al. vegan: Community Ecolo-gy Package. R package version 1.17–11; 2011.
22. Pinheiro JC, Bates DM. Mixed-Effects Models in S and S-PLUS. New York: Springer; 2000.
23. Anderson MJ, Crist TO, Chase JM, Vellend M, Inouye BD, Freestone AL, et al. Navigating the multiple meanings ofβdiversity: a roadmap for the practicing ecologist. Ecol Lett 2011; 14: 19–28. doi:10.
1111/j.1461-0248.2010.01552.xPMID:21070562
24. Legendre P, Gallagher ED. Ecologically meaningful transformations for ordination of species data. Oecologia 2001; 129: 271–280.
26. Kraft NJB, Comita LS, Chase JM, Sanders NJ, Swenson NG, Crist TO, et al. Disentangling the drivers ofβdiversity along latitudinal and elevational gradients. Science 2011; 333: 1755–1758. doi:10.1126/ science.1208584PMID:21940897
27. Dickson TL, Foster BL. Fertilization decreases plant biodiversity even when light is not limiting. Ecol Lett 2011; 14: 380–388. doi:10.1111/j.1461-0248.2011.01599.xPMID:21332902
28. Laybourn-Parry J. Protozoan Plankton Ecology. London: Chapman and Hall; 1992.
29. Walker ED, Kaufman MG, Merritt RW. An acute trophic cascade among microorganisms in the tree hole ecosystem following removal of omnivorous mosquito larvae. Community Ecol 2010; 11: 171– 178. PMID:25342946
30. Mata TM, Haddad NM, Holyoak M. How invader traits interact with resident communities and resource availability to determine invasion success. Oikos 2013; 122: 149–160.
31. Foissner W, Hawksworth DL. Protist Diversity and Geographical Distribution. Dordrecht: Springer; 2009.
32. Wallace JB, Merritt RW. Filter-Feeding Ecology of Aquatic Insects. Annu Rev Entomol 1980; 25: 103– 132.
33. Ngai JT, Srivastava DS. Predators accelerate nutrient cycling in a bromeliad ecosystem. Science 2006; 314: 963. PMID:17095695
34. Ngai JT, Kirby KR, Gilbert B, Starzomski BM, Pelletier AJD, Srivastava DS. The impact of land-use change on larval insect communities: Testing the role of habitat elements in conservation. Ecoscience 2008; 15: 160–168.
35. Gilbert B, Srivastava DS, Kirby KR. Niche partitioning at multiple scales facilitates coexistence among mosquito larvae. Oikos 2008; 117: 944–950.
36. Srivastava DS. Habitat structure, trophic structure and ecosystem function: interactive effects in a bro-meliad–insect community. Oecologia 2006; 149: 493–504. PMID:16896779
37. Starzomski BM, Suen D, Srivastava DS. Predation and facilitation determine chironomid emergence in a bromeliad-insect food web. Ecol Entomol 2010; 35: 53–60.
38. Yoshida T, Jones LE, Ellner SP, Fussmann GF, Hairston NG. Rapid evolution drives ecological dynam-ics in a predator-prey system. Nature 2003; 424: 303–306. PMID:12867979
39. terHorst CP, Miller TE, Levitan DR. Evolution of prey in ecological time reduces the effect size of preda-tors in experimental microcosms. Ecology 2010; 91: 629–636. PMID:20426322
40. Farjalla VF, Srivastava DS, Marino NAC, Azevedo FD, Dib V, Lopes PM, et al. Ecological determinism increases with organism size. Ecology 2012; 93: 1752–1759. PMID:22919920
41. Kneitel J, Miller T. Dispersal rates affect species composition in metacommunities ofSarracenia pur-pureainquilines. Am Nat 2003; 162: 165–171. PMID:12858261
42. Howeth JG, Leibold MA. Prey dispersal rate affects prey species composition and trait diversity in re-sponse to multiple predators in metacommunities. J Anim Ecol 2010; 79: 1000–1011. doi:10.1111/j.
1365-2656.2010.01715.xPMID:20584098
43. Hoyle M, Gilbert F. Species richness of moss landscapes unaffected by short-term fragmentation. Oikos 2004; 105: 359–367.
44. Naeem S. Patterns of the distribution and abundance of competing species when resources are hetero-geneous. Ecology 1990; 71: 1422–1429.
45. Vanschoenwinkel B, Gielen S, Vandewaerde H, Seaman M, Brendonck L. Relative importance of differ-ent dispersal vectors for small aquatic invertebrates in a rock pool metacommunity. Ecography 2008; 31: 567–577.
46. Altermatt F, Bieger A, Carrara F, Rinaldo A, Holyoak M. Effects of Connectivity and Recurrent Local Disturbances on Community Structure and Population Density in Experimental Metacommunities. Plos One 2011; 6: e19525. doi:10.1371/journal.pone.0019525PMID:21559336
47. Kneitel JM. Are Trade-Offs Among Species' Ecological Interactions Scale Dependent? A Test Using Pitcher-Plant Inquiline Species. Plos One 2012; 7: e41809. doi:10.1371/journal.pone.0041809PMID:
22844526
48. Weisse T. Distribution and diversity of aquatic protists: an evolutionary and ecological perspective. Bio-divers Conserv 2008; 17: 243–259.
49. Chalcraft DR, Cox SB, Clark C, Cleland EE, Suding KN, Weiher E, et al. Scale-dependent responses of plant biodiversity to nitrogen enrichment. Ecology 2008; 89: 2165–2171. PMID:18724726
51. Gardezi T, Gonzalez A. Scale dependence of species-energy relationships: Evidence from fishes in thousands of lakes. Am Nat 2008; 171: 800–815. doi:10.1086/587520PMID:18462129
52. Donohue I, Jackson AL, Pusch MT, Irvine K. Nutrient enrichment homogenizes lake benthic assem-blages at local and regional scales. Ecology 2009; 90: 3470–3477. PMID:20120814
53. Steiner CF, Leibold MA. Cyclic assembly trajectories and scale-dependent productivity-diversity rela-tionships. Ecology 2004; 85: 107–113.
54. Petermann JS, Fergus AJF, Roscher C, Turnbull LA, Weigelt A, Schmid B. Biology, chance or history? The predictable re-assembly of temperate grassland communities. Ecology 2010; 91: 408–421. PMID:
20392006
55. Fukami T, Bezemer TM, Mortimer SR, van der Putten WH. Species divergence and trait convergence in experimental plant community assembly. Ecol Lett 2005; 8: 1283–1290.
56. Helsen K, Hermy M, Honnay O. Trait but not species convergence during plant community assembly in restored semi-natural grasslands. Oikos 2012; 121: 2121–2130.
57. Scheffer M, van Nes EH. Self-organized similarity, the evolutionary emergence of groups of similar spe-cies. Proc Natl Acad Sci U S A 2006; 103: 6230–6235. PMID:16585519
58. terHorst CP. Experimental evolution of protozoan traits in response to interspecific competition. J Evol Biol 2010; 24: 36–46. doi:10.1111/j.1420-9101.2010.02140.xPMID:20964780
59. Violle C, Nemergut DR, Pu Z, Jiang L. Phylogenetic limiting similarity and competitive exclusion. Ecol Lett 2011; 14: 782–787. doi:10.1111/j.1461-0248.2011.01644.xPMID:21672121