SRef-ID: 1680-7359/adgeo/2006-6-173 European Geosciences Union
© 2006 Author(s). This work is licensed under a Creative Commons License.
Geosciences
How unusual was late 20th century El Ni ˜
no-Southern Oscillation
(ENSO)? Assessing evidence from tree-ring, coral, ice-core and
documentary palaeoarchives, A.D. 1525–2002
J. L. Gergis1and A. M. Fowler2
1School of Biological, Earth and Environmental Sci., Univ. of New South Wales, Kensington, NSW 2052, Sydney, Australia 2School of Geography and Environmental Science, University of Auckland, Private Bag 92019 Auckland, New Zealand Received: 12 May 2005 – Revised: 25 January 2006 – Accepted: 26 January 2006 – Published: 1 February 2006
Abstract. Multiple proxy records (tree-ring, coral, ice and documentary) were examined to isolate ENSO signals as-sociated with both phases of the phenomenon for the pe-riod A.D. 1525–2002. To avoid making large-scale infer-ences from single proxy analysis, regional signals were ag-gregated into a network of high-resolution records, reveal-ing large-scale trends in the frequency, magnitude and dura-tion of pre-instrumental ENSO using novel applicadura-tions of percentile analysis. Here we use the newly introduced cou-pled ocean-atmosphere ENSO index (CEI) as a baseline for the calibration of proxy records. The reconstruction revealed 83 extreme or very strong ENSO episodes since A.D. 1525, expanding considerably on existing ENSO event chronolo-gies. Significantly, excerpts of the most comprehensive list of La Ni˜na events complied to date are presented, indicat-ing peak activity durindicat-ing the 16th to mid 17th and 20th cen-turies. Although extreme events are seen throughout the 478-year reconstruction, 43% of the extreme ENSO events noted since A.D. 1525 occur during the 20th century, with an ob-vious bias towards enhanced El Ni˜no conditions in recent decades. Of the total number of extreme event years recon-structed, 30% of all reconstructed ENSO event years occur post-1940 alone suggesting that recent ENSO variability ap-pears anomalous in the context of the past five centuries.
1 Introduction
El Ni˜no-Southern Oscillation (ENSO) is associated with ex-treme weather events that influence climatic exex-tremes such as drought, flooding, bushfires and tropical cyclone activ-ity across vast areas of the Earth, often associated with large-scale socio-economic adversity. Despite impressive ad-vances in the reconstruction of mean hemispheric and global temperatures of the past five centuries, relatively little atten-Correspondence to:J. L. Gergis
(jgergis@gmail.com)
tion has been devoted to assessing the long-term context of apparently anomalous ENSO behaviour witnessed in recent decades (Stahle et al., 1998; Crowley, 2000; Folland et al., 2001; Mann, 2003; D’Arrigo et al., 2005).
It is widely understood that instrumental time series (<150
years) are not long enough to ascertain if decadal-scale vari-ability observed during the 20th century is atypical (Tren-berth and Hoar, 1997; Allan and D’Arrigo, 1999; Dunbar and Cole, 1999; Fedorov and Philander, 2000). Conse-quently, multi-century palaeoclimate reconstructions derived from long proxy records, such as seasonally-annually re-solved tree-ring, coral, ice or documentary records are sought to examine pre-instrumental patterns of ENSO variability (Jones and Mann, 2004).
Clarification of the definition of ENSO has long been recognised as an issue of practical relevance by CLIVAR (Climate Variability and Predictability), the largest initia-tive of the World Climate Research Programme (Trenberth, 1997). It is proposed here that an index of only component of ENSO is not ideal as it is only indicative of one physi-cal aspect of the phenomenon, and, as such, is likely to in-completely resolve the wider interactions experienced in the coupled ocean-atmospheric system.
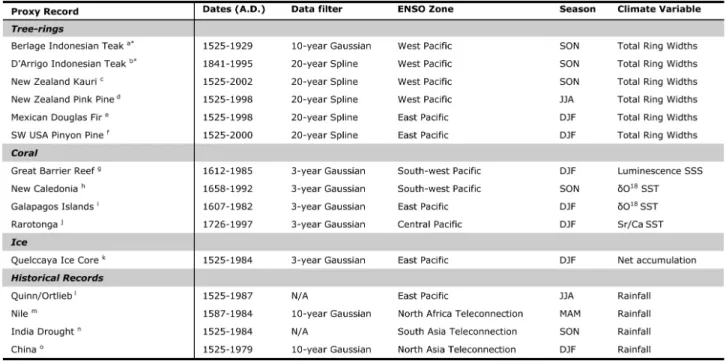
Table 1. Proxy data information of records used in this study. aBerlage (1931), Murphy and Whetton (1989), Whetton and Rutherfurd (1994), Whetton et al. (1996);bD’Arrigo et al. (1994), IGBP Pages/WDC-A for Paleoclimatology Contribution Series 1999-063;cFowler et al. (2000, 2004), Gergis et al. (2005b, 2005c); d Fenwick (2003); e Cleaveland et al. (2003), Stahle and Cleaveland (2002), IGBP Pages/WDC-A for Paleoclimatology Contribution Series 2002-004., Greybill (1994) IGBP Pages/WDC-A for Paleoclimatology Contribution Series 1994-003, Grissino-Mayer and Swetnam (1992) IGBP Pages/WDC-A for Paleoclimatology Contribution Series 1992-012, Dean (1993) IGBP Pages/WDC-A for Paleoclimatology Contribution Series 1993-021, Grow (2000) IGBP Pages/WDC-A for Paleoclimatology Contribution Series 2003-094;fStahle et al. (1998), IGBP Pages/WDC-A for Paleoclimatology Contribution Series 2002-004;gHendy et al. (1998), IGBP Pages/WDC-A for Paleoclimatology Contribution Series 2002-009;hQuinn et al. (1998), IGBP Pages/WDC-A for Paleoclimatology Contribution Series 1999-003; i Dunbar et al. (1994), IGBP Pages/WDC-A for Paleoclimatology Contribution Series 1994-013;jLinsley et al. (2000), IGBP Pages/WDC-A for Paleoclimatology Contribution Series 2000-065;kThompson et al. (1992) IGBP Pages/WDC-A for Paleoclimatology Contribution Series 1992-008;lQuinn and Neal (1992), Ortlieb (2000);mHassan (1981), Whetton and Rutherfurd (1994), Whetton et al. (1996);nWhetton and Rutherfurd (1994), Whetton et al. (1996);oWang and Zhao (1981), Whetton and Rutherfurd (1994), Whetton et al. (1996).
The CEI is of practical relevance to the ENSO commu-nity as it provides an amplitude preserving, composite in-dex for the calibration of proxy records to simultaneously reconstruct both components of the ENSO system (Gergis and Fowler, 2005a). By maintaining both atmospheric and oceanic components of ENSO represented in the calibration process, it has been possible to resolve seasonal and spatial (teleconnection) characteristics of both decoupled and cou-pled ENSO episodes using existing palaeoarchives (Gergis, 2006; Braganza et al., 20061; Gergis and Fowler, 20062).
This study reports the results derived from the integra-tion of various regional signals from a variety of ENSO af-fected locations, to providing insight into the wider, global signature of ENSO events. The primary intention of this paper is to provide a list of very strong to extreme ENSO 1Braganza, K., Gergis, J., Risbey, J., and Fowler, A.: El
Ni˜no-Southern Oscillation (ENSO) since A.D. 1525; evidence from tree-ring, coral and ice-core records, in preparation, 2006.
2Gergis, J. and Fowler, A.: A history of ENSO events since
A.D. 1525; implications for future climate change, in preparation, 2006.
events observed since A.D. 1525. To verify the occurrence of reconstructed existing ENSO event chronologies were consulted. Importantly, this paper introduces an excerpt of the most comprehensive listing of pre-instrumental La Ni˜na events compiled to date which incorporates data from east and western Pacific centres-of-action (Gergis, 2006; Gergis and Fowler, 20062).
2 Data and methodology
2.1 Proxy selection and calibration with instrumental ENSO
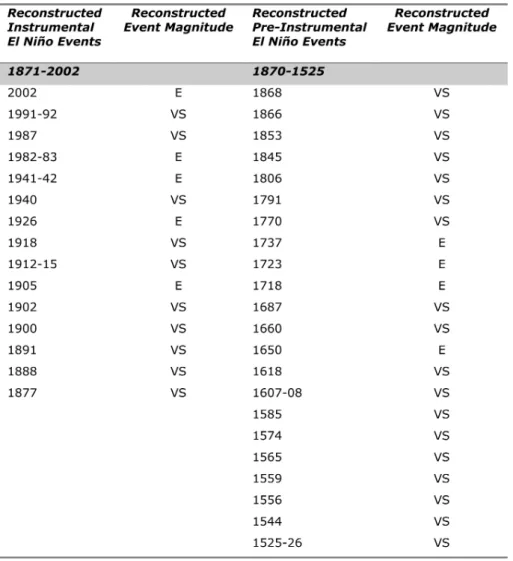
Table 2.Reconstructed El Ni˜no events since A.D. 1525. Percentile analysis was used to classify the magnitude of events into extreme (>90th
percentile) and very strong (70th–90th percentile). Excerpt taken from (Gergis, 2006; Gergis and Fowler, 20062).
study (Table 1) are largely based on published records from core ENSO and key teleconnection areas to ensure the use of high quality data (Allan et al., 1996). Attention was given to preserving geographical representation of signals from both eastern and western Pacific sites back to A.D. 1525. Note that in this paper, the season of proxy response listed in Ta-ble 1 relates to the strongest relationshipidentified with the CEI(Gergis and Fowler, 2005a) and does not assume any a priori seasonal response window based on previous analyses undertaken using other indices of ENSO.
Instead of calibrating proxies using commonly applied regression approaches, a percentile analysis was employed (Gergis, 2006; Gergis and Fowler, 20062). Since the tech-nique is based upon the hierarchical ranking of all anoma-lies, there is no truncation of statistical outliers or loss of variance in subsequent applications. This is of signifi-cance as previous reconstructions have been known to un-derestimate the amplitude of ENSO events (Folland et al., 2001). Consequently, the novel application of this technique to ENSO analysis may have considerable implications for
accurately deciphering the wealth of information contained within proxy archives (Gergis, 2006; Gergis and Fowler, 20062).
2.2 ENSO event magnitude
Following extensive verification related to signal replica-tion and comparison with existing chronologies of historical ENSO events (Gergis, 2006), a three (four) proxy threshold was used to define an El Ni˜no (La Ni˜na) event in a multi-ple proxy environment. To allow the skill of the proxy to be incorporated into the quantification of event magnitude, a quality adjusted magnitude (MQ) time series was devised (Gergis, 2006; Gergis and Fowler, 20062).
Essentially, to define the intensity and quality of recon-structed events, a percentile analysis was performed on the MQ time series to isolate (>90th percentile) very strong
(70th–90th percentile), strong (50th–70th), moderate (50th– 30th) and weak events (<30th) ENSO conditions. These
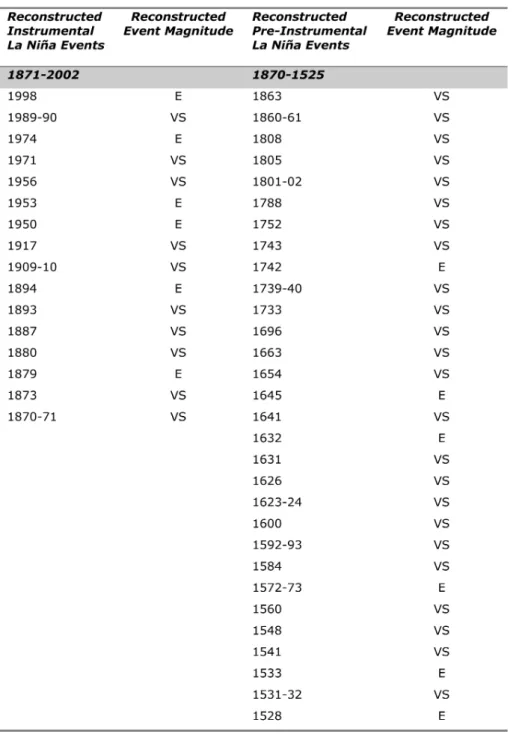
Table 3. Reconstructed La Ni˜na events since A.D. 1525. Percentile analysis was used to classify the magnitude of events into extreme (>90th percentile) and very strong (70th–90th percentile). Excerpt taken from (Gergis, 2006; Gergis and Fowler, 20062).
as to what has historically been considered strong-extreme events in the instrumental period (post-1870) using previ-ous research by Trenberth (1997) and the CEI (Gergis and Fowler, 2005a). These classes were then applied to the qual-ity adjusted magnitude time series back to A.D. 1525. Here, only extreme and very strong ENSO events are selected for presentation from the entire ENSO event chronology (Ger-gis, 2006; Gergis and Fowler, 20062).
2.3 Event verification
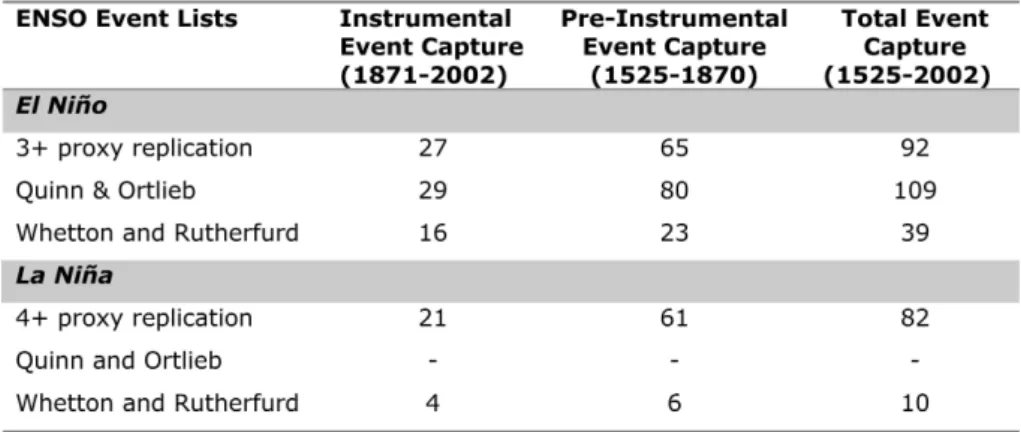
Table 4. Verification of reconstructed ENSO event frequency with existing long-term chronologies (Quinn and Neal, 1992; Whetton and Rutherfurd, 1994; Ortlieb, 2000). Here, El Ni˜no (La Ni˜na) event definition represents at least three (four) proxies replicating a single, regional ENSO signal. Note that total events for each sub-period includes all weak, moderate, strong, very strong and extreme magnitude events presented by Gergis (2006) and Gergis and Fowler (2006)2, rather than the limited very-strong to extreme events presented in Tables 2 and 3.
Rutherford (1994) were used. Only comparisons with the long-term ENSO chronologies are presented to avoid cover-ing material beyond the scope of this summary paper.
3 Results
From Table 2, a total of 37 very-strong to extreme El Ni˜no were reconstructed since A.D. 1525. Nine events were clas-sifies as extreme, including four well known events of the 20th century (2002, 1982–83, 1941–42, 1926, 1905). The 18th century contained a further three events (1737, 1723, 1718) while only one extreme El Ni˜no event of A.D. 1650 was recorded during the 16th and 17th centuries. The 20th century represents the peak of El Ni˜no activity, when twelve events were classed as either very strong or extreme (Ta-ble 2).
Table 3 presents the results for the La Ni˜na phase recon-struction. A total of 46 events were reconstructed, twelve of these classified as extreme. Four extreme La Ni˜na events (1998, 1974, 1953, 1950) were reconstructed during the 20th century. The pre-instrumental period indicates rela-tively more La Ni˜na activity with 6(24) extreme (very strong) events compared to 4(18) extreme (very strong) events from the El Ni˜no reconstruction. Considerable La Ni˜na activity is indicated during the 16th to mid 17th centuries when five extreme events are reconstructed. The obvious trend towards increased La Ni˜na activity over the 20th century is also evi-dent from Table 3.
Table 4 shows the event frequency characterisitcs of the two primary long-term ENSO event lists of “Quinn” (Quinn and Neal, 1992; Ortlieb, 2000) and Whetton and Rutherfurd (1994) and the multiproxy event lists presented here. There is a high degree of similarity between the Quinn and Ortlieb chronologies and the use of three proxies for El Ni˜no event definition. The additional 16 events not included in the mul-tiproxy event lists may indicate El Ni˜no conditions that may
have only been regional in nature. Events from the multi-proxy reconstructions have a longer duration than a num-ber of the events indicated in the Quinn records (not shown), which may reflect the impact of calibrating proxies using the CEI which allowed lead/lag signatures associated with de-coupled events to be resolved. Consequently, the results may be a sign of larger-scale patterns of ENSO events, rather than the response of one (East Pacific) teleconnection region.
Verification of La Ni˜na events was substantially more dif-ficult due to the lack of coverage in the Quinn records and a total of ten events noted by Whetton and Rutherfurd (1994). The year A.D. 1906 is the only La Ni˜na event not present in the four proxy La Ni˜na chronologies, however, the 1826 La Ni˜na noted by Whetton and Rutherfurd (1994) is only detectable using a three-proxy threshold (not shown). Since there were minor differences in the event capture character-istics of the three and four-proxy event lists, a four proxy threshold for La Ni˜na event definition was considered to be slightly more conservative.
4 Discussion
Verification revealed that a three (four) proxy minimum for El Ni˜no (La Ni˜na) event definition compared well with the two primary long-term ENSO event list of “Quinn” (Quinn and Neal, 1992; Ortlieb, 2000) and Whetton and Rutherfurd (1994). This study provides substantial replication and ex-tension of the events reported by previous research. In par-ticular, the results of Table 3 represent excerpts of the most comprehensive list of La Ni˜na events complied to date (Ger-gis, 2006; Gergis and Fowler, 20062).
fluctuated considerably through time, with peaks in the 16th to mid 17th and 20th centuries. The 20th century stands out as the peak period of El Ni˜no activity. In total, 43% of the extreme events noted since A.D. 1525 occur during the 20th century, with a bias towards enhanced El Ni˜no conditions (Table 2). Strikingly, the post-1940 period alone accounts for 30% of the total extreme ENSO event years reconstructed over the past five centuries.
5 Conclusions
This paper identified a total of 83 extreme and very strong ENSO events since A.D. 1525, many of which were verified using available long-term ENSO event chronologies. In total, 43% of the extreme events noted since A.D. 1525 occur dur-ing the 20th century, with an obvious bias towards enhanced El Ni˜no conditions. 30% of all extreme ENSO years occur post-1940 suggesting that recent ENSO variability may be anomalous in the context of the past five centuries.
An considerably expanded analysis of the nature, magni-tude and frequency of pre-observational ENSO events is cur-rently underway to further clarify changes in past ENSO be-haviour (Gergis, 2006; Braganza et al., 20061; Gergis and Fowler, 20062). Given the large-scale socio-economic im-pacts of ENSO events, future investigation into the possible impact an increasingly anthropogenically-warmed world will have on ENSO behaviour is vital.
Acknowledgements. J. L. Gergis thanks the European Geophysical
Union and the International Research Center on El Ni˜no (CIFFEN) for financial assistance to participate in the 1st International Alexander Von Humboldt Conference on the El Ni˜no phenomenon and its global impact. Many thanks to P. Whetton (CSIRO) and I. Rutherfurd (University of Melbourne) for Nile Flood Record, Berlage Teak Chronology, North China Rainfall data, E. Hendy (Lamont Doherty Earth Observatory) for Great Barrier Reef coral luminescence record, P. Fenwick (Lincoln University, New Zealand) for Pink Pine tree-ring data, B. Bauer and C. Woodhouse (World Data Center for Paleoclimatology/National Climatic Data Center Paleoclimatology Branch) for data acquisition and assistance. J. L. Gergis was supported at UNSW by an Australian Postgraduate Award.
Edited by: P. Fabian and J. L. Santos
Reviewed by: L. Ortlieb and another anonymous referee
References
Allan, R. and D’Arrigo, R.: “Persistent” ENSO sequences: how unusual was the 1990–1995 El Ni˜no?, The Holocene, 9(1), 101– 118, 1999.
Allan, R., Lindsay, J., and Parker, D.: El Ni˜no Southern Oscillation and climate variability, Melbourne, Australia, CSIRO, 1996. Allan, R., Reason, C., Lindesay, J., and Ansell, T.: Protracted
ENSO episodes and their impacts in the Indian Ocean region, Deep Sea Res. II, 50(12–13), 2331–2347, 2003.
Berlage, H.: On the relationship between thickness of tree rings of Djati and rainfall on Java, Tectona, 24, 939–953, 1931.
Cleaveland, M., Stahle, D., Therrell, M., Villanueva-Diaz, J., and Burns, B.: Tree-ring Reconstructed Winter Precipitation and Tropical Teleconnections in Durango, Mexico, Climatic Change, 59, 369–388, 2003.
Crowley, T.: Causes of Climate Change over the Past 1,000 years, Science, 289, 270-277, 2000.
D’ Arrigo, R., Cook, E., Wilson, R., Allan, R., and Mann, M.: On the variability of ENSO over the past six centuries, Geophys. Res. Lett., 32(L03711), 1–4, 2005.
D’ Arrigo, R., Jacoby, G., and Krusic, P.: Progress in Den-droclimatic Studies in Indonesia, Terrestrial, Atmospheric and Oceanographic Sciences, 5, 349–363, 1994.
Dunbar, R. and Cole, J.: Annual Records of Tropical Systems (ARTS); Recommendations for Research, Geneva, Switzerland, IGBP Science Series, 1999.
Fedorov, A. and Philander, G.: Is El Ni˜no changing?, Science, 288, 1997–2002, 2000.
Fenwick, P.: Reconstruction of past climates using pink pine (Halo-carpus biformus) tree-ring chronologies, Christchurch, New Zealand, Soil Plant and Ecological Sciences, Linclon University, 2003.
Folland, C., Karl, T., Christy, J., Clarke, R., Gruza, G., Jouzel, J., Mann, M., Oerlemans, J., Salinger, M., and Wang, S.: Observed Climate Variability and Change, in: Climate Change 2001: The Scientific Basis, Contribution of Working Group 1 to the Third Assessment Report of the Intergovernmental Panel on Climate Change, edited by: Houghton, J., Ding, Y., Griggset, D., et al., United Kingdom and New York, Cambridge University Press, 2001.
Fowler, A., Boswijk, G., and Ogden, J.: Tree-ring studies on Agathis australis (Kauri): a synthesis of development work on Late Holocene chronologies, Tree Ring Research, 60(1), 15–29, 2004.
Fowler, A., Palmer, J., Salinger, J., and Ogden, J.: Dendroclimatic interpretation of tree-rings in Agathis australis (Kauri) 2; Evi-dence of a significant relationship with ENSO, Journal of Royal Society of New Zealand, 30(3), 277–292 2000.
Gergis, J.: Reconstructing El Ni˜no-Southern Oscillation; evi-dence from tree-ring, coral, ice and documentary palaeoarchives, A.D. 1525–2002. PhD Thesis, School of Biological, Earth and Environmental Sciences, Sydney, University of New South Wales, 2006.
Gergis, J. and Fowler, A.: Classification of synchronous oceanic and atmospheric El Ni˜no-Southern Oscillation (ENSO) events for palaeoclimate reconstruction, Int. J. Climatol., 25, 1541– 1565, 2005a.
Gergis, J., Boswijk, G., and Fowler, A.: An update of modern Northland Kauri (Agathis australis) tree-ring chronologies 1: Puketi State Forest, New Zealand tree-ring Site Report No. 19, School of Geography and Environmental Science Working Pa-per 29, University of Auckland, New Zealand, 2005b.
Gergis, J., Boswijk, G., and Fowler, A.: An update of modern Northland Kauri (Agathis australis) tree-ring chronologies 2: Trounson Kauri Park, New Zealand tree-ring Site Report No. 20, School of Geography and Environmental Science Working Paper 30, University of Auckland, New Zealand, 2005c.
Hassan, F.: Historical Nile Floods and Their Implications for Cli-matic Change, Science, 212, 1142–1145, 1981.
Kiladis, G. and Diaz, H.: Global climatic anomalies associated with extremes in the Southern Oscillation, J. Climate, 2, 1069–1090, 1989.
Mann, M.: On Past Temperatures and Anomalous Late-20th Cen-tury Warmth, Eos, 84(27), 1–3, 2003.
Mullan, A.: On the linearity and stability of Southern Oscillation-climate relationships for New Zealand, Int. J. Climatol., 15, 1365–1386, 1995.
Murphy, J. and Whetton, P.: A re-analysis of a tree-ring chronol-ogy from Java, Proceedings of the Koninklijke Nederlandse Akademie van Wetenschappen (Dendrochronology), Proceed-ings B, 92(3), 241–257, 1989.
Ortlieb, L.: The documentary historical record of El Ni˜no events in Peru: An update of the Quinn record (sixteenth through nine-teenth centuries), in: El Ni˜no and the Southern Oscillation: Vari-ability, Global and Regional Impacts, edited by: Diaz, H. and Markgraf, V., Cambridge, Cambridge University Press, 207–295, 2000.
Quinn, W. and Neal, V.: The historical record of El Ni˜no events, in: Climate Since A.D. 1500, edited by: Bradley, R. and Jones, P., London, Routledge, 623–648, 1992.
Rasmusson, E. and Carpenter, T.: The relationship between eastern equatorial Pacific sea surface temperatures and rainfall over India and Sri Lanka, Mon. Wea. Rev., 111, 517–528, 1983.
Stahle, D., D’Arrigo, R., Krusic, P., Cleaveland, M., Cook, E., Al-lan, R., Cole, J., Dunbar, R., Therrell, M., Gay, D., Moore, M., Stokes, M., Burns, B., Villanueva-Diaz, J., and Thompson, L.: Experimental dendroclimatic reconstruction of the Southern Os-cillation, Bull. Amer. Meteor. Soc., 79(10), 2137-2152. Trenberth, K.: The Definition of El Ni˜no, Bull. Amer. Meteor. Soc.,
78(12), 2771–2777, 1997.
Trenberth, K. and Hoar, T.: El Ni˜no and climate change, Geophys. Res. Lett., 24(23), 3057–3060 1997.
Wang, S. and Zhao, Z.: Droughts and floods in China, 1470–1979, in: Climate and History, edited by: Wigley, T., Ingrasham, M., and Farmer, G., Cambridge University Press, 171–288, 1981. Whetton, P., Allan, R., and Rutherfurd, I.: Historical ENSO
tele-connections in the Eastern Hemisphere: comparisons with latest El Ni˜no series of Quinn, Clim. Change, 32, 103–109, 1996. Whetton, P. and Rutherfurd, I.: Historical ENSO teleconnections in