OSD
10, 951–984, 2013The change in ENSO characteristics
V. N. Stepanov
Title Page
Abstract Introduction
Conclusions References
Tables Figures
◭ ◮
◭ ◮
Back Close
Full Screen / Esc
Printer-friendly Version Interactive Discussion
Discussion
P
a
per
|
D
iscussion
P
a
per
|
Discussion
P
a
per
|
Discuss
ion
P
a
per
|
Ocean Sci. Discuss., 10, 951–984, 2013 www.ocean-sci-discuss.net/10/951/2013/ doi:10.5194/osd-10-951-2013
© Author(s) 2013. CC Attribution 3.0 License.
Geoscientiic Geoscientiic
Geoscientiic Geoscientiic
Open Access
Ocean Science
Discussions
This discussion paper is/has been under review for the journal Ocean Science (OS). Please refer to the corresponding final paper in OS if available.
One plausible reason for the change in
ENSO characteristics in the 2000s
V. N. Stepanov
Dept. of Meteorology, University of Reading, Reading, UK
Received: 25 April 2013 – Accepted: 29 May 2013 – Published: 1 July 2013 Correspondence to: V. N. Stepanov ([email protected])
OSD
10, 951–984, 2013The change in ENSO characteristics
V. N. Stepanov
Title Page
Abstract Introduction
Conclusions References
Tables Figures
◭ ◮
◭ ◮
Back Close
Full Screen / Esc
Printer-friendly Version Interactive Discussion
Discussion
P
a
per
|
D
iscussion
P
a
per
|
Discussion
P
a
per
|
Discuss
ion
P
a
per
Abstract
It is well known that El Niño Southern Oscillation (ENSO) causes floods, droughts and the collapse of fisheries, therefore forecasting of ENSO is an important task in climate researches. Variations in the equatorial warm water volume of the tropical Pacific and wind variability in the western equatorial Pacific has been considered to be a good 5
ENSO predictor. However, in the 2000s, the interrelationship between these two char-acteristics and ENSO onsets became weak. This article attempts to find some plausible explanation for this.
The results presented here demonstrate a possible link between the variability of atmospheric conditions over the Southern Ocean and their impact on the ocean circu-10
lation leading to the amplifying/triggering of ENSO events. It is shown that the variabil-ity of the atmospheric conditions upstream of Drake Passage can strongly influence ENSO events. The interrelationship between ENSO and variability in the equatorial warm water volume of the equatorial Pacific, together with wind variability in the west-ern equatorial Pacific has recently weakened. It can be explained by the fact that the 15
process occurred in the Southern Ocean recently became a major contributor amplify-ing ENSO events (in comparison with the processes of interaction between the atmo-sphere and the ocean in the tropics of the Pacific). Likely it is due to a warmer ocean state observed from the end of the 1990s that led to smaller atmospheric variability in the tropics and insignificant their changes in the Southern Ocean.
20
1 Introduction
Forecasting of ENSO events is an important task in climate research because ENSO events have a global influence weather systems: both in the tropical Pacific (where the ENSO events occur) and at moderate/high latitudes (e.g., Lau et al., 2005; Nicholls et al., 2005; Mokhov and Smirnov, 2006; Müller and Roecker, 2006, demonstrated the 25
OSD
10, 951–984, 2013The change in ENSO characteristics
V. N. Stepanov
Title Page
Abstract Introduction
Conclusions References
Tables Figures
◭ ◮
◭ ◮
Back Close
Full Screen / Esc
Printer-friendly Version Interactive Discussion
Discussion
P
a
per
|
D
iscussion
P
a
per
|
Discussion
P
a
per
|
Discuss
ion
P
a
per
|
Alvarez-Garcia et al. (2006) identified three classes of ENSO events on the basis of numerical modelling. The first two classes are characterized by well-known mecha-nisms: the first class is described by a model of a delayed oscillator, when a negative feedback is formed between the propagation of equatorial waves and tropical sea sur-face temperature (SST) anomalies (see, for example, Suarez and Schopf, 1988); the 5
second class is described by the model of a recharge/discharge oscillator, in which variability of tropical wind stress leads to variation of thermocline inclination due to fast wave processes (see, for example, Jin, 1997). The third class of ENSO events found by Alvarez-Garcia et al. (2006) is characterized by the relatively fast development of these events (less than nine months after the appearance of wind anomalies in the western 10
part of the Equatorial Pacific). This class confirms the conclusion described by Kessler (2002) that ENSO events are perturbations relative to a stable climatic state, and an external pulse, i.e. not part of the dynamic ENSO cycle, is required to trigger the ENSO event. Stepanov (2009a,b) considered the possibility that the variability of meridional fluxes in the Pacific sector of the Southern Ocean (caused by the atmospheric variabil-15
ity over the Antarctic Circumpolar Current (ACC) and effects of the bottom topography and coastline shape) can be such a pulse (in addition to the variability of western winds in the tropics).
In accordance with the recharge/discharge paradigm for ENSO McPhaden, (2003, 2006), found some ENSO precursors in observation data: it was shown that variation 20
in the equatorial warm water volume of the tropical Pacific and wind variability in the western equatorial Pacific precedes ENSO by two to three seasons and can be a useful ENSO predictor. A similar approach was proposed by Clarke and Van Gorder, (2003) who used zonal wind stress over the Indo-Pacific tropics.
However Horii et al. (2012) have shown that the robust predictability of 25
OSD
10, 951–984, 2013The change in ENSO characteristics
V. N. Stepanov
Title Page
Abstract Introduction
Conclusions References
Tables Figures
◭ ◮
◭ ◮
Back Close
Full Screen / Esc
Printer-friendly Version Interactive Discussion
Discussion
P
a
per
|
D
iscussion
P
a
per
|
Discussion
P
a
per
|
Discuss
ion
P
a
per
(La Niña) ENSO events by two to three seasons. While in the 2000s, the interrela-tionship between these predictors and following ENSO became weak, especially for the ENSO events after 2005. According to Horii et al. (2012) these changes may be caused by frequent occurrences of the “warm-pool El Niño”, which is characterized by SST anomalies centered in the central equatorial Pacific (Larkin and Harrison, 2005; 5
Ashok et al., 2007; Kao and Yu, 2009; Kug et al., 2009; and Lee and McPhaden, 2010), compared with that during 1980–2000. Under these conditions, the tropical tempera-ture anomalies are weak and the discharge phase of the recharge/discharge oscillator is not significant. Therefore the frequent occurrence of the warm-pool El Niño in the 2000s cannot provide discharged conditions that prevent the development of signifi-10
cant cold ENSO events.
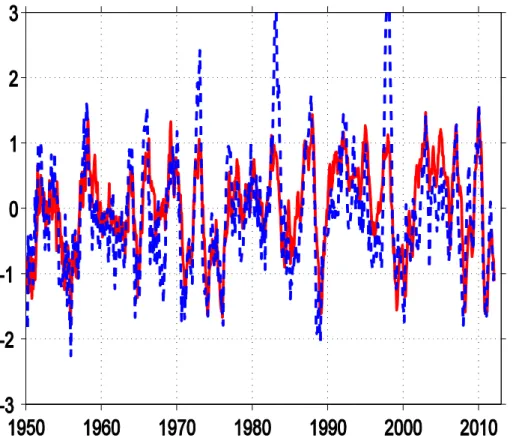
No reasons have been mentioned by Horii et al. (2012) to explain why the conven-tional ENSO events have been recently displaced by the “warm-pool El Niño”. Figure 1 shows the time series of the NINO3 (SST averaged in area of 5◦N–5◦S; 150–90◦W, dashed blue line) and NINO4 (SST averaged in area of 5◦N–5◦S; 160◦E–150◦W, red 15
line) indexes (www.cpc.ncep.noaa.gov/data/indices) as a measure of the departure from normal sea surface temperature in the east and central Pacific Ocean respec-tively. One can see that both indexes are varied in phase, but the amplitudes of the variability are different: the amplitude of NINO3 index can be up to 2 times larger (be-fore 2000) than NINO4. It is reasonable to think that NINO4 describes a primary source 20
of some factor forcing the onset of ENSO events, while NINO3 is a combination effect of the primary source and changes due to the beginning of ENSO onset in the cen-tral Pacific, i.e. the subsequent interaction between the atmosphere and ocean in the tropics ( a cross-correlation analysis presented by Ashok et al. (2007) confirms that the variability of NINO4 index leads NINO3). It is likely that the subsequent changes in the 25
OSD
10, 951–984, 2013The change in ENSO characteristics
V. N. Stepanov
Title Page
Abstract Introduction
Conclusions References
Tables Figures
◭ ◮
◭ ◮
Back Close
Full Screen / Esc
Printer-friendly Version Interactive Discussion
Discussion
P
a
per
|
D
iscussion
P
a
per
|
Discussion
P
a
per
|
Discuss
ion
P
a
per
|
other forcings also can influence the ENSO onsets (e.g., see Kessler, 2002; Stepanov, 2009a,b).
Many publications provide evidence that the interactions between high latitudes and the tropics can impact the ENSO variability (e.g., Pierce et al., 2000; Vimont et al., 2003; Dong et al., 2006; Chang et al., 2007; Alexander et al., 2008; Wang et al., 2012; 5
Terray, 2011). For example, Wang et al. (2012) have shown that the winter SST anoma-lies in the western North Pacific influence the development of wind anomaanoma-lies over the equatorial western Pacific triggering oceanic Kelvin waves, which propagate eastward and initiate the developments of ENSO. However, not only teleconnections between different regions of the Pacific can impact the ENSO. Dong et al. (2006) demonstrated 10
from global coupled ocean atmosphere modelling that some teleconnection exists be-tween the Atlantic and ENSO: the warm phase of the Atlantic Multidecadal Oscillation leads to a weaker phase of the El Niño development. These authors supposed that this occurs due to the fast processes in the atmosphere, which transfer the influence of the Atlantic to the tropics of the Pacific Ocean through an “atmospheric bridge.” Numerical 15
models and observations in the Southern Ocean demonstrate a statistically significant correlation between the processes near the Antarctic continent and in the tropical re-gions both with positive and negative lags of approximately a few months long. The analysis of the data of observations by Simmonds and Jacka (1995), Yuan and Martin-son (2000), Kwok and Comiso (2002) demonstrate that the location of the Antarctic sea 20
ice spreading boundary is strongly correlated with the ENSO events on time scales of a few months: a correlation is observed between the ENSO events and the location of the boundary of the Antarctic sea ice spreading when the ENSO event either leads or lags with respect to the variability of the sea ice. Yuan and Martinson (2000) explained the latter correlation by the existence of some atmospheric teleconnection between 25
OSD
10, 951–984, 2013The change in ENSO characteristics
V. N. Stepanov
Title Page
Abstract Introduction
Conclusions References
Tables Figures
◭ ◮
◭ ◮
Back Close
Full Screen / Esc
Printer-friendly Version Interactive Discussion
Discussion
P
a
per
|
D
iscussion
P
a
per
|
Discussion
P
a
per
|
Discuss
ion
P
a
per
the transfer process of seasonal signals from high latitudes to the tropics can be even more important than was considered earlier. The results presented in this article lead to the conclusion that the wind processes over the ACC, and particularly the atmospheric conditions upstream of Drake Passage, can strongly influence the ENSO events.
As was noted by Stepanov (2009a,b), the above mentioned correlations can be 5
explained by the fact that ENSO events could be considered as a consequence of changes in the global meridional atmospheric circulation rather than a local phe-nomenon. The link between the tropics and high latitudes can exist due to interactions between the tropics and the mid-latitudes, which influence the high latitudes and vice versa. For example, warming (cooling) of the upper ocean layer in the tropics (which 10
can be related, for example, to the seasonal cycle, or consequence of the frequent oc-currence of the weak pool El Niño) leads to an increase (decrease) in the warm-ing of the troposphere in a region where atmospheric mass upwells (the Pacific Ocean is the largest ocean and therefore has the largest contribution to these changes). This means that warmer (colder) upgoing air from the tropical zone is transported by the 15
Hadley circulation cell to the subtropics, which slows down (accelerates) the air motion in the downwelling branch of the Hadley cell and then leads to weakening (intensifi-cation) of the wind in the mid-latitudes, which then lead to similar changes in the high latitudes. Therefore many teleconnections between ENSO and weather at distant re-gions from the tropical Pacific have been found.
20
Figure 2a shows 1989–2008 correlations of zonally averaged monthly sea level pres-sure (SLP) with SOI-index taken with negative sign (SOI index describes fluctuations in the difference of the surface air pressure anomalies between Tahiti (17◦52′S) and Darwin (12◦25′S), which was taken from http://www.cpc.ncep.noaa.gov/data/indices, and that is considered as a good predictor for ENSO events). We clearly see season-25
OSD
10, 951–984, 2013The change in ENSO characteristics
V. N. Stepanov
Title Page
Abstract Introduction
Conclusions References
Tables Figures
◭ ◮
◭ ◮
Back Close
Full Screen / Esc
Printer-friendly Version Interactive Discussion
Discussion
P
a
per
|
D
iscussion
P
a
per
|
Discussion
P
a
per
|
Discuss
ion
P
a
per
|
results in to the next SLP change in the tropics in the zonal direction (Fig. 2a). After removing the seasonal cycle and low-pass filtering with periods longer than 18 months, the correlation between SOI-index and zonally averaged sea level pressure difference between 17◦ and 12◦S (Fig. 2d) is about−0.6. Thus, it is likely that the development of ENSO events is due to the global meridional atmospheric circulation change that 5
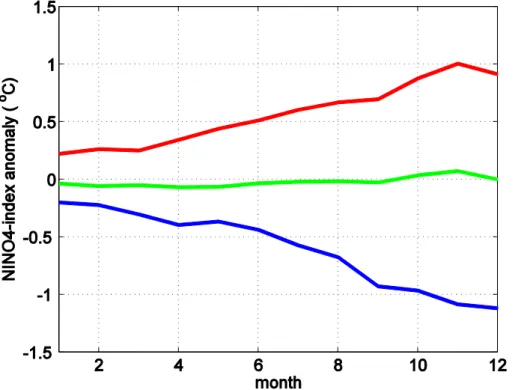
can affect high latitudes too: the stronger these changes, the stronger the effect that can be seen both in the low and high latitudes. Figure 3 shows the seasonal cycle of monthly anomalies of NINO4 for warm (red), cold (blue) and neutral (green) ENSO events. The warm and cold ENSO events were defined as when the mean anomaly of NINO4 during September–December exceeded 0.5◦C in magnitude, with the remain-10
ing years considered as neutral ENSO. One can clearly see that the maximum phase of the development of the warm/cold ENSO events is observed in November–December. The peak-to-peak amplitude of the seasonal cycle of neutral ENSO events is negligi-ble. It is well known that ENSO onset, i.e. time when the initiation of ENSO begins, is observed around April to June in many cases (e.g. Larkin and Harrison, 2002). This 15
paper analyzes what factors can impact the development of the maximum phase of ENSO in the end of the year.
Section 2 briefly introduces the results of Stepanov (2009a,b) demonstrating the impact of processes in the Southern Ocean on the amplifying mechanism of ENSO events due to variations in the wind forcing over the ACC, together with the effects of the 20
topography and coastline. Section 3 describes the typical changes in the atmospheric conditions over the Southern Ocean a few months before the maximum phase of the development of ENSO and how these changes can be interrelated with ENSO events. Also the results of an empirical orthogonal function (EOF) analysis are presented to identify modes of variability relevant to the hypothesis that processes occurring in the 25
OSD
10, 951–984, 2013The change in ENSO characteristics
V. N. Stepanov
Title Page
Abstract Introduction
Conclusions References
Tables Figures
◭ ◮
◭ ◮
Back Close
Full Screen / Esc
Printer-friendly Version Interactive Discussion
Discussion
P
a
per
|
D
iscussion
P
a
per
|
Discussion
P
a
per
|
Discuss
ion
P
a
per
2 The transport processes in the Southern Ocean and its relation to ENSO
Numerical experiments presented by Stepanov (2009a,b) have demonstrated that the variability of wind forcing over the ACC, together with the effect of bottom topogra-phy, lead to the appearance of anomalies in pressure and density in the Southern Ocean. The appearance of these anomalies is caused by the short time scale variabil-5
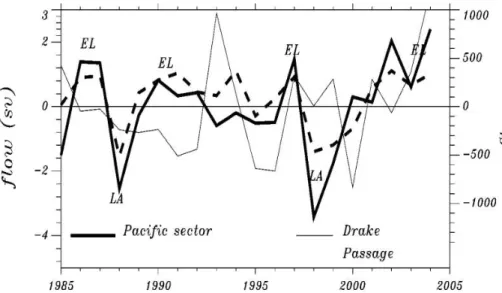
ity of the meridional mass fluxes in the Pacific sector of the Southern Ocean north of 47◦S, of which the average value from July to September is estimated to be greater than 2000 Gt (gigatons, 1 Gt=109t). This variability of the oceanic mass in the Pacific Ocean is negatively correlated with the wind forcing over the ACC, significant at the 99 % level. As a measure of wind strength the SAM index (Southern Hemisphere An-10
nular Mode) has been used. This is determined as the normalized difference between the zonal-mean SLP between 40◦S and 70◦S (obtained from the National Oceanic and Atmospheric Administration). Figure 4 presents curves that describe the transport vari-ation through Drake Passage in Sv (1 Sv=106m3s−1) and the variability of the oceanic
mass,M(t)|φ=40S, in the Pacific Ocean (M(t)|φ=40S ∼ t R
0
QP(t)dt) averaged from July to 15
September, which is caused by fluctuations of the meridional mass flux QP across 40◦S calculated from the 20 yr model data by Stepanov (2009a). The meridional mass fluxes have been obtained from a 1-degree barotropic ocean model by Stepanov and Hughes (2004) that was forced with 6 h wind and atmospheric pressure forcings. High correlation (with coefficient of∼ 0.8) is observed between the minima and maxima of 20
the variability ofM(t)|φ=40S in the Pacific sector and, correspondingly, the cold (La) and warm (El) ENSO events.
In papers by Ivchenko et al. (2004, 2006) it has been shown that salinity anomalies appearing near Antarctica can propagate to lower latitudes as fast barotropic Rossby waves almost without changes in their amplitude. Such waves propagate from Drake 25
OSD
10, 951–984, 2013The change in ENSO characteristics
V. N. Stepanov
Title Page
Abstract Introduction
Conclusions References
Tables Figures
◭ ◮
◭ ◮
Back Close
Full Screen / Esc
Printer-friendly Version Interactive Discussion
Discussion
P
a
per
|
D
iscussion
P
a
per
|
Discussion
P
a
per
|
Discuss
ion
P
a
per
|
obtained for simplified model topography, they have been confirmed by model results when models with real topography have been used (e.g., see Richardson et al., 2005 and Blaker et al., 2006). Hence, if the variability of the meridional fluxes of the water masses in the Pacific sector of the Southern Ocean can cause short-period density anomalies near the regions where the strong variability of these fluxes is observed, 5
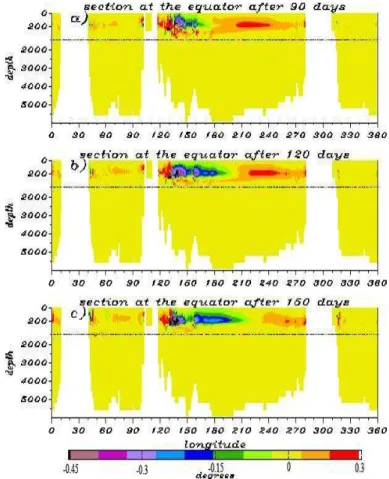
then by means of the wave mechanism described by Ivchenko et al. (2004, 2006), these anomalies can be transported to the low latitudes of the Pacific Ocean. Here they interact with the stratification and can cause variations in the inclination of the thermocline in the tropical Pacific, which, in turn, can facilitate more intense develop-ment of ENSO effects (Stepanov, 2009a,b). The results presented in Fig. 5 confirm 10
this conclusion. Figure 5 shows the model temperature difference over a section along the equator for three time perods between perturbed and control calculations obtained by Stepanov (2009a) using 3-dimensional ocean circulation model by Ibraev (1993) having approximately 1-degree horizontal resolution and 19 depth levels (see details in Stepanov, 2009a). In the experiment with a perturbation in the Pacific sector of the 15
Southern Ocean in the latitudinal zone between 47◦ and 37◦S, a uniform by depth (i.e., barotropic) and latitude perturbation of the meridional velocity was specified for 90 days. It was obtained from the results of barotropic modelling by averaging the mean model barotropic meridional velocity over the latitude in the zone between 47◦ and 37◦S and over the time from July to September of 1987, 1997, and 2002 (i.e., the 20
periods preceding to maximum phase of the development of the warm ENSO events). The perturbation corresponded to the total equatorward meridional flux, but it was cor-rected in such a way that the total section flow would be zero. In a few days, owing to the processes described by Ivchenko et al. (2004, 2006), positive and negative dipole-shaped temperature anomalies appeared in the western part of the equatorial Pacific 25
OSD
10, 951–984, 2013The change in ENSO characteristics
V. N. Stepanov
Title Page
Abstract Introduction
Conclusions References
Tables Figures
◭ ◮
◭ ◮
Back Close
Full Screen / Esc
Printer-friendly Version Interactive Discussion
Discussion
P
a
per
|
D
iscussion
P
a
per
|
Discussion
P
a
per
|
Discuss
ion
P
a
per
wave propagation agrees with the results of observations (see, for example, Delcroix et al., 1991). This process leads to the elevation of the thermocline in the western part of the equatorial Pacific (from 130◦to 195◦E) and a depression in the eastern Pa-cific (Fig. 5). In the eastern (western) equatorial PaPa-cific at depths of about 200 m, the temperature anomalies reach approximately 0.3◦C (−0.5◦C).
5
Since the temperature and salinity fields at the ocean surface in these numerical experiments were fixed, the development of surface and subsurface anomalies was limited. The change of sign of the perturbation in the experiment (with a perturbed field of the meridional velocity) leads to an opposite response of the equatorial Pacific: a warming in the western part and a cooling in the eastern part of the ocean; i.e., the 10
thermocline descends in the western part of the equatorial Pacific and ascends in its eastern part.
The above mentioned variability of the meridional mass fluxes in the Pacific sector of the Southern Ocean, as it has been studied by Stepanov and Hughes (2006), is due to mass exchange occurring between the Southern Ocean, Atlantic, and Pacific regions 15
at periods of 30–100 days. Such mass exchange is accompanied by global adjustment processes in the ocean, which are approximately one month long. The main mass ex-change occurs between the Southern and Pacific oceans, which is determined by the balance of wind stress by form stress (a pressure difference across topographic obsta-cles) in Drake Passage. According to Stepanov and Hughes (2006), three main regions 20
exist in the Southern Ocean (regions near Drake Passage, the Kerguelen Plateau, and the Pacific Antarctic Rise) that are responsible for approximately 65 % of total form stress on the ACC. Drake Passage is the most significant topographic feature among the three regions mentioned above, accounting for about 30 % of the total form stress. The eastward directed wind stress leads to a decrease in the bottom pressure near 25
OSD
10, 951–984, 2013The change in ENSO characteristics
V. N. Stepanov
Title Page
Abstract Introduction
Conclusions References
Tables Figures
◭ ◮
◭ ◮
Back Close
Full Screen / Esc
Printer-friendly Version Interactive Discussion
Discussion
P
a
per
|
D
iscussion
P
a
per
|
Discussion
P
a
per
|
Discuss
ion
P
a
per
|
fluxes near bottom ridges that was demonstrated by Stepanov (2009a,b) can impact the development of ENSO effects.
Thus, the change of atmospheric conditions over the ACC, and particularly over the region upstream of Drake Passage, can substantially influence the bottom pressure on the western side of Drake Passage and the balance between wind stress and form 5
stress in Drake Passage, which can impact the variability of the meridional mass fluxes in the Pacific sector of the Southern Ocean. The model effect of this variability on ENSO has just been described. The next section describes plausible reasons for the establishment of the atmospheric conditions over the ACC, which are favourable to amplify ENSO events from the Southern Ocean. Since, as it was shown by Stepanov 10
(2009a,b), there is a time lag of 4–6 months between the variation ofM(t)|φ=40S in the winter–spring season of the Southern Hemisphere and the maximum phase of ENSO development (which is determined by the time needed to transport the density anoma-lies appearing in the Southern Ocean to low latitudes by means of a wave mechanism described by Ivchenko et al., 2004, 2006), we have to pay attention to the atmospheric 15
variability that occurred about 4 months before the maximum phase of ENSO develop-ment.
3 Is the Southern Ocean a main trigger for the development of the maximum phase of ENSO during warm periods?
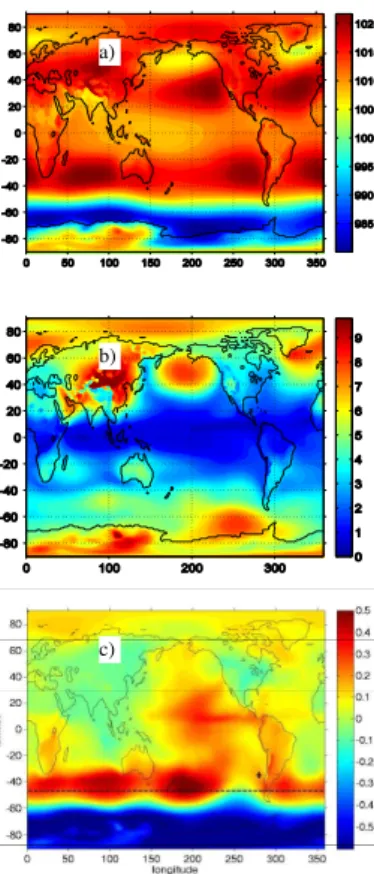
Figure 6a and b shows 1989–2011 mean SLP and its standard deviation. One can 20
see that the field of SLP pressure has almost zonal structure over the ACC, while upstream of Drake Passage there is a high variability of SLP. It means that sometimes in this region instead of a usual low atmospheric pressure, an anticyclonic/cyclonic atmospheric circulation pattern can occur.
From correlation between the monthly average SAM index and SLP (Fig. 6c) one 25
OSD
10, 951–984, 2013The change in ENSO characteristics
V. N. Stepanov
Title Page
Abstract Introduction
Conclusions References
Tables Figures
◭ ◮
◭ ◮
Back Close
Full Screen / Esc
Printer-friendly Version Interactive Discussion
Discussion
P
a
per
|
D
iscussion
P
a
per
|
Discussion
P
a
per
|
Discuss
ion
P
a
per
versa. As we saw before the region upstream of Drake Passage is important from the point of view of a balance between the wind stress and form stress in Drake Passage that impacts the variability of the meridional mass fluxes in the Pacific sector of the Southern Ocean. Therefore it is clear that a high atmospheric pressure settled over the upstream of Drake Passage region can “lock” Drake Passage resulting in equator-5
ward meridional flux anomaly in the Pacific sector of the Southern Ocean that, as was shown by Stepanov (2009a,b), leads to conditions favourable to trigger warm ENSO. While a low pressure developed over this region “accelerates” the wind over the ACC leading to poleward meridional flux anomaly in the Pacific sector of the Southern Ocean resulting in the development of cold ENSO (Stepanov, 2009a,b).
10
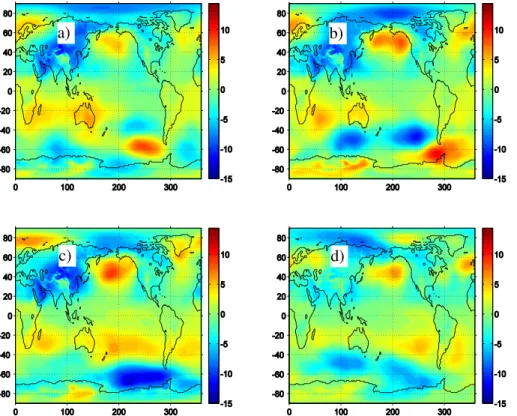
The results presented in Fig. 7 confirm the above conclusion. This figure shows July– September (Fig. 7a–c) and August–October (Fig. 7d) mean ERAInterim SLP anomalies (from the 1989–2011 mean) that are typical before the maximum phase of the devel-opment of warm (Fig. 7a, b) and cold (Fig. 7c, d) ENSO events. Before warm ENSO reaches its maximum phase of development, over the region upstream/near of Drake 15
Passage high atmospheric pressure is settled (Fig. 7a, b), while low SLP over this re-gion is observed during the months preceding the maximum phase of the development of a cold ENSO (Fig. 7c, d). The lag between the changes of atmospheric conditions over the ACC (4–6 months) is in accordance with previous finding by Stepanov (2009a), e.g., the cold ENSO of 2007 has reached its maximum phase of the development about 20
1–2 months later than ones in 1997, 1998 and 2002 (Fig. 7a–c), therefore the negative SLP anomalies in the Southern Ocean near Antarctica have also been observed later (Fig. 7d). Similar distribution of SLP anomalies has also been observed 3–5 months before the development of maximal phase of the ENSO in 1992, 1994, 1995, 2000, 2006 and 2010.
25
OSD
10, 951–984, 2013The change in ENSO characteristics
V. N. Stepanov
Title Page
Abstract Introduction
Conclusions References
Tables Figures
◭ ◮
◭ ◮
Back Close
Full Screen / Esc
Printer-friendly Version Interactive Discussion
Discussion
P
a
per
|
D
iscussion
P
a
per
|
Discussion
P
a
per
|
Discuss
ion
P
a
per
|
atmospheric conditions over the region upstream of Drake Passage can be crucial for whole ACC dynamics, we can choose some other index.
The results of numerical modelling presented by Stepanov (2009a) have shown that in the Southern Ocean, in the latitude zone of 47◦–48◦S, there is a zone of divergence (convergence) of the meridional mass fluxes. The direction of the water mass motion 5
cyclically changes with a period determined by the external forcing: for the case of weak (strong) wind, water masses move to the equator (to the pole), to the north of these zones, while, south of these zones, they move to the pole (equator). This latitude zone of 47◦–48◦S is the boundary between the regions, in which atmospheric cyclones south of 48◦S and anticyclones north of 47◦S propagate in the eastern direction over 10
the ACC, generating fluctuations in the fields of the atmospheric pressure and wind velocity. Near the western coast of South America at 30◦S there is a region of high atmospheric pressure (Fig. 6a) and an analysis of ERAInterim SLP shows that some-times the area of high pressure crosses the latitude circle of 47◦S between 260◦–290◦E and penetrates to the south, in the region upstream of Drake Passage. Therefore the 15
averaged sea level pressure anomaly along 280◦E between 35◦S (the point marked by black cross on Fig. 6c) and 45◦S, ∆p, can be a good indicator for predicting such changes in atmospheric pressure field.
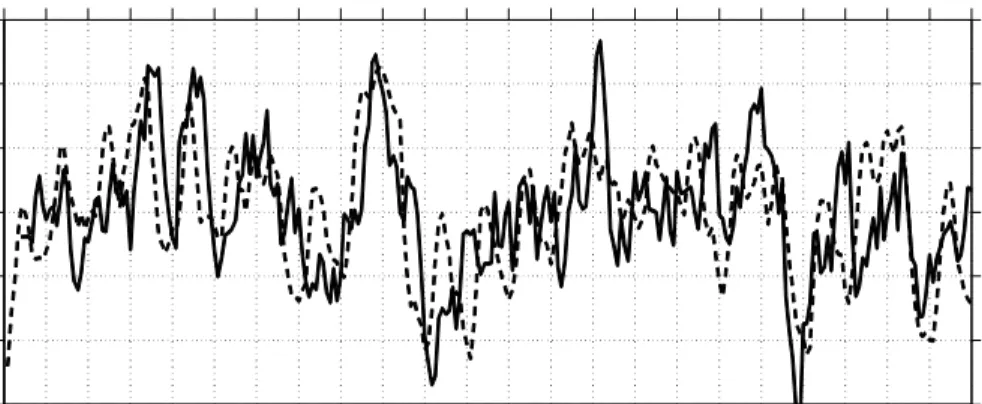
Figure 8 shows normalized on their standard deviations anomalies monthly time se-ries of NINO3.4 index (black dashed) and∆p(solid line, after applying 5 month running 20
average procedure). The black solid line is after subtraction of the seasonal cycle and is shifted 4 months forward. One can see that there is correspondence between peaks and troughs of NINO-index with ones of∆pcurve that have been observed 3–5 months before the maximum phase of the development of ENSO. The effect of atmospheric stochastic forcing, which always exists in the processes of the interaction between the 25
OSD
10, 951–984, 2013The change in ENSO characteristics
V. N. Stepanov
Title Page
Abstract Introduction
Conclusions References
Tables Figures
◭ ◮
◭ ◮
Back Close
Full Screen / Esc
Printer-friendly Version Interactive Discussion
Discussion
P
a
per
|
D
iscussion
P
a
per
|
Discussion
P
a
per
|
Discuss
ion
P
a
per
months), however the contribution of the 1989–1999 period to this correlation is slightly bigger: for 1989–1999 period the correlation between the above mentioned time series is about 0.65, while for 2000–2011 or 2000–2008 periods this correlation is lower∼ 0.5 (all the correlations presented by the paper are statistically significant with a probability of 95 %, which was determined through the effective number of degrees of freedom 5
following Bretherton et al., 1999).
Similar correlation analysis with NINO3.4 and 5-month running average SOI index shows similar features: the negative correlation coefficient between these time series with lag of 4 months (SOI index leads the NINO3.4) is decreased from 0.5 (for 1989– 1999 period) to 0.3 (for 2000–2011 period, note that for 2000–2008 period the cor-10
relation is lower:−0.2) yielding the value of the correlation coefficient of about −0.4 for whole 1989–2011 period. It is worth noting that SOI and NINO3.4 indexes vary in phase rather than SOI index leading the NINO3.4: the maximal correlation between SOI and NINO3.4 indexes is obtained for zero lag: it is equaled to about−0.7 and−0.6 for 1989–1999 and 2000–2011 periods respectively, while the correlation coefficients 15
between these time series when either SOI leads or lags NINO are less (∼ −0.4). Sim-ilar dependences are obtained for the values of correlation coefficients between SOI and NINO4 time series, but they are not so dramatically expressed.
Thus, higher correlation between NINO3.4 index and ∆p (∼ 0.5) and lowest ones between SOI and NINO indexes after 2000 (∼ 0.3) indicates that the recent variability 20
over the Southern Ocean contributed more to the processes of ENSO development than prior to the 2000s. Figure 9 shows 1989–1999 (a) and 2000–2008 (b) standard deviations of SLP from 10◦N to the Antarctic continent. One can see that atmospheric dynamics near Antarctica has not been substantially changed: only over the upstream of Drake Passage region a high variability of the SLP became more localized near 25
OSD
10, 951–984, 2013The change in ENSO characteristics
V. N. Stepanov
Title Page
Abstract Introduction
Conclusions References
Tables Figures
◭ ◮
◭ ◮
Back Close
Full Screen / Esc
Printer-friendly Version Interactive Discussion
Discussion
P
a
per
|
D
iscussion
P
a
per
|
Discussion
P
a
per
|
Discuss
ion
P
a
per
|
strong ENSO (described by NINO3 index, see Fig. 1). Results presented on Fig. 9c, d confirm this conclusion: before 2000 the variability of the SLP over the tropical Pacific was higher than after: in the 2000s the atmospheric pressure patterns show weaker variability (∼ 70 % from 1989–2011 mean variability), while during the 1989–1999 pe-riod the area of higher atmospheric pressure variability (> 100 % of 1989–2011 mean 5
one) occupied almost the whole tropical Pacific. However, the atmospheric variability in moderate and high latitudes of the Southern Hemisphere did not change noticeably (Fig. 9a, b), which suggests that the effect of processes near Antarctica still impact the tropical region of the Pacific Ocean with the same efficacy. Lower correlation between NINO and SOI index in comparison with the value of the correlation between NINO 10
index and∆p time series after 2000 can be explained by the fact that the contribution of the interaction of atmosphere with the ocean in the tropical Pacific decreased during that period while the processes occurring in the Southern Ocean continue to influence the tropics.
The interaction between the atmosphere and the ocean due to the existence of 15
stochastic forcings (e.g., see Flügel et al., 2004; Eisenman et al., 2005) limits the pre-dictability of ENSO (especially “warm-pool El Niño”, e.g. see Horii et al., 2012). The stochastic variability can lead to some interannual changes in the tropics when weak tropical temperature anomalies can be superimposed leading to substantial changes in the atmospheric meridional circulation. An example is 2006 when a long warm period 20
in the central tropics (during more than half of a year) provided discharged conditions of the recharge/discharge ENSO oscillator at the beginning of 2007 (Horii et al., 2012). This cooling in the tropics led to the intensification of the meridional atmospheric cir-culation cell and stronger wind over the ACC (the value of SAM index exceeded its standard deviation) when negative SLP anomaly developed over the Southern Ocean 25
OSD
10, 951–984, 2013The change in ENSO characteristics
V. N. Stepanov
Title Page
Abstract Introduction
Conclusions References
Tables Figures
◭ ◮
◭ ◮
Back Close
Full Screen / Esc
Printer-friendly Version Interactive Discussion
Discussion
P
a
per
|
D
iscussion
P
a
per
|
Discussion
P
a
per
|
Discuss
ion
P
a
per
but 2008–2011 SLP variability in the western tropical Pacific (Fig. 9f) is comparable with one before 2000 (Fig. 9c). It is likely that during warm periods this variability will be decreased again after onsets of series of the “warm-pool El Niño” events.
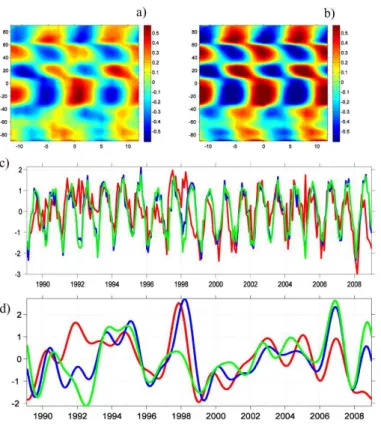
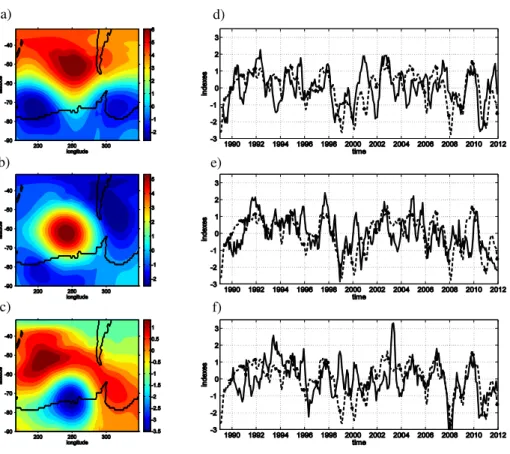
The first, second and fifth leading EOF modes of monthly SLP anomalies over the region of the Southern Ocean in the area south of 31◦S; 150◦–310◦E are presented in 5
Fig. 10a–c. The EOF1 pattern shown in Fig. 10a captures the almost zonal structure of the SLP over the ACC. This mode explains about of 44 % of the total variability over the region for the period between 1989 and 2011. The EOF2 (Fig. 10b) that explains about 14 % of the SLP variability captures a zonal dipole pattern near Drake Passage that is in accordance with Fig. 7. Finally, the EOF5 mode (Fig. 10c) explaining 5 % of 10
the SLP variability captures a meridional dipole pattern to the west of Drake Passage, which characterizes the variability of the strength of meridional shear of zonal wind.
The time series of the normalized principal components (PCs) of EOF1, EOF2 and EOF5 together with normalized NINO4 index are presented in Fig. 10d–f. A cross-correlation analysis between these PCs and NINO4 index at different leads and lags 15
for 1989–2011 period gives a maximum correlations of 0.42, 0.48 and 0.38 with PCs leading NINO4 at 1, 4 and 8 months respectively for PC1, PC2 and PC5. However, we should note that correlations between PC1, PC2 and NINO4 for whole 1989–2011 pe-riod and for 2 subpepe-riods (1989–2002 and 2002–2011 pepe-riods) are comparable (about 0.4 for PC1 and 0.5 for PC2), but the correlation between PC5 and NINO4 are different 20
for these different periods. The 2002–2011 period is a major contributor to the value of correlation coefficient between PC5 and NINO4 for 1989–2011 period: 2002–2011 correlation is about 0.8, while for 1989–2002 PC5 and NINO4 are not correlated at all. As was mentioned earlier, the EOF5 characterizes the strength of meridional shear of zonal wind over the region under consideration, which defines the growth rate of the 25
OSD
10, 951–984, 2013The change in ENSO characteristics
V. N. Stepanov
Title Page
Abstract Introduction
Conclusions References
Tables Figures
◭ ◮
◭ ◮
Back Close
Full Screen / Esc
Printer-friendly Version Interactive Discussion
Discussion
P
a
per
|
D
iscussion
P
a
per
|
Discussion
P
a
per
|
Discuss
ion
P
a
per
|
of about 8 months, i.e., this event is coincident with the time of ENSO onset, Larkin and Harrison (2002).
The EOF analysis agrees with the previous cross-correlation analysis. So, PC1 is highly correlated with SAM index (with coefficient about −0.9) since EOF1 and SAM index describe the weakness and strength of wind over the ACC. The EOF2 is in a good 5
agreement with SLP anomaly pattern near Drake Passage presented in Fig. 7. Both
∆pand PC2 are significantly correlated with NINO4 (with the coefficient of∼ 0.6 and 0.5 respectively) with lead time of about 4 months.
4 Discussion and conclusions
It is a generally accepted opinion that ENSO events are caused by the interaction pro-10
cesses between the ocean and atmosphere in the tropics (excluding the recent paper by Terray (2011) who pointed out the linkage between mid-latitude Southern Hemi-sphere climate and ENSO). It is well known that the onset of ENSO events depends on the type of wind anomalies that are established in the western equatorial part of the Pacific Ocean in the previous spring and summer. However, it was shown by Lengaigne 15
et al. (2004), these wind anomalies can trigger ENSO only under particular favorable oceanic conditions. It was demonstrated by Eisenman and Tziperman (2005) that the wind anomalies considered in the tropics are a combination of joint effects of stochas-tic atmospheric forcing and large-scale dynamics depending on the ENSO processes rather than being completely external to the development of the ENSO events. Re-20
cently, Horii et al. (2012) have demonstrated that because of some decadal changes in the variability of warm water volume of the equatorial Pacific and wind variability in the western equatorial Pacific the robust predictability of these two predictors for ENSO has changed in the 2000s: the lead time of two to three seasons observed before 2000 has almost vanished and in the 2000s the variability of the warm water volume of the 25
OSD
10, 951–984, 2013The change in ENSO characteristics
V. N. Stepanov
Title Page
Abstract Introduction
Conclusions References
Tables Figures
◭ ◮
◭ ◮
Back Close
Full Screen / Esc
Printer-friendly Version Interactive Discussion
Discussion
P
a
per
|
D
iscussion
P
a
per
|
Discussion
P
a
per
|
Discuss
ion
P
a
per
phase with ENSO development. This suggests that other factors can impact the ENSO onsets.
This paper has considered a hypothesis based on the numerical results by Stepanov (2009a,b) that the atmospheric variability over the ACC can strongly influence ampli-fying ENSO events. This hypothesis allows us to explain the breakdown in the 2000s 5
of ENSO predictors proposed by McPhaden (2003) through analysis of SLP fields. It was shown that the maximum phase of the development of most ENSO events was associated with a change of the atmospheric conditions upstream of Drake Passage in July–October when the variability of the atmosphere over the Southern Ocean was es-pecially strong. This variability, together with the effect of the bottom topography, leads 10
to the changes of the balance between the wind stress and form stress in Drake Pas-sage, resulting in the appearance of anomalies in the fields of the pressure and density in the Southern Ocean. By means of the wave mechanism described by Ivchenko et al. (2004, 2006), these anomalies can be transported to the low latitudes of the Pacific ocean, where they interact with the stratification via Kelvin wave propagation 15
and can cause variations in the inclination of the thermocline in the tropical Pacific (Fig. 5), which, in turn, can amplify ENSO event (Stepanov, 2009a,b). In the 2000s, due to warmer SST, more homogeneous dynamical conditions in the tropics developed (Fig. 9d), hence the subsequent interaction between the atmosphere and ocean in the tropics after the beginning of ENSO in the central equatorial Pacific is suppressed and 20
a strong ENSO cannot be developed in the eastern side of the tropical Pacific. As a re-sult, frequent occurrences of the “warm-pool El Niño”, which is characterized by SST anomalies centered in the central equatorial Pacific, are observed (Horii et al., 2012). The high correlation between PC5 and NINO4 after 2002, EOF5 of which characterizes the strength of the meridional shear of zonal wind over the region under consideration, 25
OSD
10, 951–984, 2013The change in ENSO characteristics
V. N. Stepanov
Title Page
Abstract Introduction
Conclusions References
Tables Figures
◭ ◮
◭ ◮
Back Close
Full Screen / Esc
Printer-friendly Version Interactive Discussion
Discussion
P
a
per
|
D
iscussion
P
a
per
|
Discussion
P
a
per
|
Discuss
ion
P
a
per
|
the area with high atmospheric pressure can be developed over the region upstream of Drake Passage more frequently, therefore generally more warm ENSO events than cold ones are observed. For example, the Oceanic Niño Index from http://www.cpc.ncep. noaa.gov/products/analysis_monitoring/ensostuff/ensoyears.shtml. This shows that for 1950–2002 period 15 warm and 11 cold ENSO events have been observed respec-5
tively, while after 2002 the numbers of warm and cold ENSO were the same. It is in agreement with the analysis of PC2 and PC5 timeseries. Both timeseries are not sym-metric with respect to the zero value. The skewness coefficients for the unsmoothed PC2 and PC5 timeseries for the period of 1989–2011 are about 0.2, and about 2 times greater for the period before 1997. The positive value of the skewness indicates that 10
more often SLP anomalies, having constituents similar to EOF2 and EOF5 patterns presented in Fig. 10b, c, can be developed in the region under consideration.
The EOF analysis has revealed the best possible ENSO predictor for warm periods: it is PC5 that is highly correlated with NINO4 (∼ 0.8) with lead time of 8 months. It means that processes in the Southern Ocean due to air jet instability over the ACC during 15
warm periods significantly contribute to development of maximal phase of ENSO. One might argue that the conclusion stands on the principle component PC5 which has only 5 % of total variance, and even if the PC5 correlates well with ENSO with a 8-month lead, we cannot suggest that the SLP anomalies over the Southern Ocean could have very significant effect on ENSO. However, it is well known that extreme events 20
are described by “probability distribution tail” that describes even less than 5 % of all possible outcomes (and ENSO can be considered such an event, since no regularity for ENSO events is observed because, as was demonstrated by Eisenman and Tziperman (2005), the wind anomalies considered in the tropics are a combination of joint effects of stochastic atmospheric forcing and large-scale dynamics). Thus PC5 describing 5 % 25
OSD
10, 951–984, 2013The change in ENSO characteristics
V. N. Stepanov
Title Page
Abstract Introduction
Conclusions References
Tables Figures
◭ ◮
◭ ◮
Back Close
Full Screen / Esc
Printer-friendly Version Interactive Discussion
Discussion
P
a
per
|
D
iscussion
P
a
per
|
Discussion
P
a
per
|
Discuss
ion
P
a
per
As was noted in the Introduction ENSO events could be considered as a conse-quence of changes in the global meridional atmospheric circulation when the tropics and high latitudes interact with each other rather than a local phenomenon. Since the interaction between the tropics and high latitudes depends on the stochastic processes, which always occur during the interaction between the atmosphere and the ocean, time 5
lag between atmospheric changes in the Southern Ocean and the onsets of ENSO is in a wide range of 3–5 months. Note here that the primary component of stochastic forcing can be tropical intraseasonal variation, such as the Madden–Julian Oscillation (MJO), Madden and Julian (1972), since MJO can impact the development ENSO from the surface; it is likely that local atmospheric forcing is important to this type of ENSO, 10
such as those associated with the MJO. However, it is worth noting that Stepanov and Hughes (2006) have shown that large-scale mass exchange exists not only between the Southern Ocean and Pacific. There are also the Atlantic-Pacific and slightly weaker Indian-Pacific exchanges at shorter timescales (periods from few days to 3 months). Therefore it is likely that this exchange can lead to the appearance of some signals in 15
the tropics and mid-latitudes of the Indian and Atlantic oceans too. Hints of this can be seen in Fig. 5 for the Indian Ocean, though in this experiment the velocity disturbance was defined only for the meridional component of the velocity. It is likely that MJO and, e.g. subtropical dipole variability in both the Southern Indian and Atlantic Oceans triggered by Southern Hemisphere mid-latitude variability influencing ENSO found by 20
Terray (2011), are the results of such global inter-basin mass exchange. Further stud-ies are needed to explore this hypothesis.
During warmer periods, meridional gradients of the atmospheric dynamic character-istics that decrease inter-latitudinal exchange are weaker, therefore the SLP variability in the tropics becomes weaker leading to the development of frequent but weak (with 25
OSD
10, 951–984, 2013The change in ENSO characteristics
V. N. Stepanov
Title Page
Abstract Introduction
Conclusions References
Tables Figures
◭ ◮
◭ ◮
Back Close
Full Screen / Esc
Printer-friendly Version Interactive Discussion
Discussion
P
a
per
|
D
iscussion
P
a
per
|
Discussion
P
a
per
|
Discuss
ion
P
a
per
|
Acknowledgements. The author would like to thank Keith Haines for his support in doing the work. Thanks to N. Howe who carefully read the draft of the paper and provided helpful com-ments. This work was supported by the NCEO and the RAPID -Watch Valor projects.
References
Alexander, M. A., Matrosova, L., Penland, C., Scott, J. D., and Chang, P.: Forecasting
5
Pacific SSTs: linear inverse model predictions of the PDO, J. Climate, 21, 385–402, doi:10.1175/2007JCLI1849.1, 2008.
Alvarez-Garcia, F., Narvaez, W. C., and Ortiz Bevia, M. J.: An assessment of differences in ENSO mechanisms in a coupled GCM simulation, J. Climate, 19, 69–87, 2006.
Ashok, K., Behera, S. K., Rao, S. A., Weng, H., and Yamagata, T.: El Niño Modoki and its
10
possible teleconnection, J. Geophys. Res., 112, C11007, doi:10.1029/2006JC003798, 2007. Blaker, A. T., Sinha, B., Ivchenko, V. O., Wells, N. C., and Zalesny, V. B.: Identifying the roles
of the ocean and atmosphere in creating a rapid equatorial response to a Southern Ocean anomaly, Geophys. Res. Lett., 33, L06720, doi:10.1029/2005GL025474, 2006.
Bretherton, C. S., Widmann, M., Dymnikov, V. P., Wallace, J. M., and Bladé, I.: The effective
15
number of spatial degrees of freedom of a time-varying field, J. Climate, 12, 1990–2009, 1999.
Chang, P., Zhang, L., Saravanan, R., Vimont, D. J., Chiang, J. C. H., Ji, L., Seidel, H., and Tippett, M. K.: Pacific meridional mode and El Niño–Southern Oscillation, Geophys. Res. Lett., 34, L16608, doi:10.1029/2007GL030302, 2007.
20
Clarke, A. J. and Van Gorder, S.: Improving El Niño prediction using a space-time integration of Indo-Pacific winds and equatorial Pacific upper ocean heat content, Geophys. Res. Lett., 30, 1399, doi:10.1029/2002GL016673, 2003.
Delcroix, T., Picaut, J., and Eldin, G.: Equatorial Kelvin and Rossby waves evidenced in the Pacific Ocean through geosat sea level and surface current anomalies, J. Geophys. Res.,
25
96, 3249–3262, doi:10.1029/90JC01758, 1991.
OSD
10, 951–984, 2013The change in ENSO characteristics
V. N. Stepanov
Title Page
Abstract Introduction
Conclusions References
Tables Figures
◭ ◮
◭ ◮
Back Close
Full Screen / Esc
Printer-friendly Version Interactive Discussion
Discussion
P
a
per
|
D
iscussion
P
a
per
|
Discussion
P
a
per
|
Discuss
ion
P
a
per
Eisenman, I., Yu, L., and Tziperman, E.: Westerly wind bursts: ENSO’s tail rather than the dog?, J. Climate, 18, 5224–5238, 2005.
Flügel, M., Chang, P., and Penland, C.: The role of stochastic forcing in modulating ENSO predictability, J. Climate, 17, 3125–3140, 2004.
Gill, A. E.: Atmosphere–Ocean Dynamics, Academic Press, London, 662 pp., 1982.
5
Horii, T., Ueki, I., and Hanawa, K.: Breakdown of ENSO predictors in the 2000s: decadal changes of recharge/discharge-SST phase relation and atmospheric intraseasonal forcing, Geophys. Res. Lett., 39, L10707, doi:10.1029/2012GL051740, 2012.
Ibraev, R. A.: Reconstruction of climatic characteristics of the Gulf stream current, Izv. AN Fiz. Atmos. Ok., 29, 803–814, 1993.
10
Ivchenko, V. O., Zalesny, V. B., and Drinkwater, M. R.: Can the equatorial ocean quickly respond to Antarctica sea ice/salinity anomalies?, Geophys. Res. Lett., 31, L15310, doi:10.1029/2004GL020472, 2004.
Ivchenko, V. O., Zalesny, V. B., Drinkwater, M. R., and Schröter, J.: A quick response of the equatorial ocean to Antarctic sea ice/salinity anomalies, J. Geophys. Res., 111, C10018,
15
doi:10.1029/2005JC003061, 2006.
Jin, F.-F.: An equatorial recharge paradigm for ENS O. Part I: Conceptual model, J. Atmos. Sci., 54, 811–829, 1997.
Kao, H.-Y. and Yu, J.-Y.: Contrasting eastern-Pacific and central-Pacific types of ENSO, J. Cli-mate, 22, 615–632, 2009.
20
Kessler, W. S.: Is ENSO a Cycle or Series of Events?, Geophys. Res. Lett., 29, 2135, doi:10.1029/2002GL015924, 2002.
Kug, J.-S., Jin, F.-F., and An, S.-I.: Two types of El Niño events: Cold Tongue El Niño and Warm Pool El Niño, J. Climate, 22, 1499–1515, doi:10.1175/2008JCLI2624.1, 2009.
Kwok, R. and Comiso, J. C. : Southern Ocean climate and sea ice anomalies associated with
25
the Southern Oscillation, J. Climate, 15, 487–501, 2002.
Larkin, N. K. and Harrison, D. E.: Global seasonal temperature and precipitation anomalies during El Niño autumn and winter, Geophys. Res. Lett., 32, L16705, doi:10.1029/2005GL022860, 2005.
Lau, N.-C., Leetmaa, A., Nath, M. J., and Wang, H.-L.: Influence of ENSO-induced
Indo-30
OSD
10, 951–984, 2013The change in ENSO characteristics
V. N. Stepanov
Title Page
Abstract Introduction
Conclusions References
Tables Figures
◭ ◮
◭ ◮
Back Close
Full Screen / Esc
Printer-friendly Version Interactive Discussion
Discussion
P
a
per
|
D
iscussion
P
a
per
|
Discussion
P
a
per
|
Discuss
ion
P
a
per
|
Lee, T. and McPhaden, M. J.: Increasing intensity of El Niño in the central-equatorial Pacific, Geophys. Res. Lett., 37, L14603, doi:10.1029/2010GL044007, 2010.
Lengaigne, M., Guilyardi, E., Boulanger, J.-P., Menkes, C., Delecluse, P., Inness, P., Cole, J., and Slingo, J.: Triggering of El Niño by westerly wind events in a coupled general circulation model, Clim. Dynam., 23, 601–620, doi:10.1007/s00382-004-0457-2, 2004.
5
Madden, R. A. and Julian, P. R.: Description of global scale circulation cells in the tropics with a 40–50-day period, J. Atmos. Sci., 29, 1109–1123, doi:10.1175/1520-0469(1972)029<1109:DOGSCC>2.0.CO;2, 1972.
McPhaden, M. J.: Tropical Pacific Ocean heat content variations and ENSO persistence barri-ers, Geophys. Res. Lett., 30, 1480, doi:10.1029/2003GL016872, 2003.
10
McPhaden, M. J., Zhang, X., Hendon, H. H., and Wheeler, M. C.: Large-scale dy-namics and MJO forcing of ENSO variability, Geophys. Res. Lett., 33, L16702, doi:10.1029/2006GL026786, 2006.
Mokhov, I. I. and Smirnov, D. A.: El Niño-Southern Oscillation drives North Atlantic Oscillation as revealed with nonlinear techniques from climatic indices, Geophys. Res. Lett., 33, L03708,
15
doi:10.1029/2005GL024557, 2006.
Müller W. A. and Roecker, E.: ENSO impact on midlatitude circulation patterns in future climate change projections, Geophys. Res. Lett., 33, L05711, doi:10.1029/2005GL025032, 2006. Nicholls, N., Baek, H.-J., Gosai, A., Chambers, L. E., Choi, Y., Collins, D., Della-Marta, P. M.,
Griffiths, G. M., Haylock, M. R., Iga, N., Lata, R., Maitrepierre, L., Manton, M. J.,
20
Nakamigawa, H., Ouprasitwong, N., Solofa, D., Tahani, L., Thuy, D. T., Tibig, L., Trewin, B., Vediapan, K., and Zhai, P.: The El Niño-Southern Oscillation and daily tem-perature extremes in east Asia and the west Pacific, Geophys. Res. Lett., 32, L16714, doi:10.1029/2005GL022621, 2005.
Paldor, N. and Dvorkin, Y.: Barotropic instability of a zonal jet: from nondivergent perturbations
25
on theβ-plane to divergent perturbations on a sphere, J. Phys. Oceanogr., 36, 2271–2282, 2006.
Pierce, D. W., Barnett, T. P., and Latif, M.: Connections between the Pacific Ocean trop-ics and midlatitudes on decadal timescales, J. Climate, 13, 1173–1194, doi:10.1175/1520-0442(2000)013<1173:CBTPOT>2.0.CO;2, 2000.
30
OSD
10, 951–984, 2013The change in ENSO characteristics
V. N. Stepanov
Title Page
Abstract Introduction
Conclusions References
Tables Figures
◭ ◮
◭ ◮
Back Close
Full Screen / Esc
Printer-friendly Version Interactive Discussion
Discussion
P
a
per
|
D
iscussion
P
a
per
|
Discussion
P
a
per
|
Discuss
ion
P
a
per
Simmonds, I. and Jacka, T. H.: Relationship between the interannual variability of Antarctic sea ice and the Southern Oscillation, J. Climate, 8, 637–647, 1995.
Stepanov, V. N.: The meridional transport fluctuations in the Southern Ocean and its link with the ENSO events, Oceanology, 49, 5–19, 2009a.
Stepanov, V. N.: The modelling of the ENSO events using a simple model, Oceanology, 49,
5
310–319, 2009b.
Stepanov, V. N. and Hughes, C. W.: The parameterization of ocean self-attraction and loading in numerical models of the ocean circulation, J. Geophys. Res. 109, C0037, doi:10.1029/2003JC002034, 2004.
Stepanov, V. N. and Hughes, C. W.: Propagation of signals in basin-scale bottom pressure from
10
a barotropic model, J. Geophys. Res., 111, C12002, doi:10.1029/2005JC003450, 2006. Suarez, M. and Schopf, P. S.: A Delayed Action Oscillator for ENSO, J. Atmos. Sci., 45, 3283–
3287, 1988.
Terray, P.: Southern Hemisphere extra-tropical forcing: a new paradigm for El Niño–Southern Oscillation, Clim. Dynam., 36, 2171–2199, doi:10.1007/s00382-010-0825-z, 2011.
15
Vimont, D. J., Wallace, J. M., and Battisti, D. S.: The seasonal footprinting mechanism in the Pacific: implications for ENSO, J. Climate, 16, 2668–2675, doi:10.1175/1520-0442(2003)016<2668:TSFMIT>2.0.CO;2, 2003a.
Vimont, D. J., Battisti, D. S., and Hirst, A. C.: The seasonal footprinting mechanism in the CSIRO general circulation models, J. Climate, 16, 2653–2667,
doi:10.1175/1520-20
0442(2003)016<2653:TSFMIT>2.0.CO;2, 2003b.
Wang, S.-Yu, L’Heureux, M., and Chia, H.-H.: ENSO prediction one year in advance us-ing western North Pacific sea surface temperatures, Geophys. Res. Lett., 39, L05702, doi:10.1029/2012GL050909, 2012.
Yeh, S.-W., Kug, J.-S., Dewitte, B., Kwon, M.-H., Kirtman, B., and Jin, F.-F.: El Niño in a changing
25
climate, Nature, 461, 511–514, doi:10.1038/nature08316, 2009.
OSD
10, 951–984, 2013The change in ENSO characteristics
V. N. Stepanov
Title Page
Abstract Introduction
Conclusions References
Tables Figures
◭ ◮
◭ ◮
Back Close
Full Screen / Esc
Printer-friendly Version Interactive Discussion
Discussion
P
a
per
|
D
iscussion
P
a
per
|
Discussion
P
a
per
|
Discuss
ion
P
a
per
|
OSD
10, 951–984, 2013The change in ENSO characteristics
V. N. Stepanov
Title Page
Abstract Introduction
Conclusions References
Tables Figures
◭ ◮
◭ ◮
Back Close
Full Screen / Esc
Printer-friendly Version Interactive Discussion
Discussion
P
a
per
|
D
iscussion
P
a
per
|
Discussion
P
a
per
|
Discuss
ion
P
a
per
|
anom
Fig. 3. The seasonal cycle of monthly anomalies of NINO4 for warm (red), cold (blue) and neutral (green) ENSO events.OSD
10, 951–984, 2013The change in ENSO characteristics
V. N. Stepanov
Title Page
Abstract Introduction
Conclusions References
Tables Figures
◭ ◮
◭ ◮
Back Close
Full Screen / Esc
Printer-friendly Version Interactive Discussion
Discussion
P
a
per
|
D
iscussion
P
a
per
|
Discussion
P
a
per
|
Discuss
ion
P
a
per
|
ge
ENSO events, respectively. Dashed line corresponds to scaled winter’s
Fig. 4.The values of transport through Drake Passage in Sv (thin solid line) and variability of
M(t)|φ=40S due to meridional transport fluctuations through the latitude of 40◦S in the Pacific
Ocean in Gt (thick solid line) averaged for July–September. Symbols EL and LA denote warm and cold ENSO events, respectively. Dashed line corresponds to scaled winter’s NINO4-index.
OSD
10, 951–984, 2013The change in ENSO characteristics
V. N. Stepanov
Title Page
Abstract Introduction
Conclusions References
Tables Figures
◭ ◮
◭ ◮
Back Close
Full Screen / Esc
Printer-friendly Version Interactive Discussion
Discussion
P
a
per
|
D
iscussion
P
a
per
|
Discussion
P
a
per
|
Discuss
ion
P
a
per
|
tion
Fig. 5.The temperature anomaly on the zonal section along the equator at three consecutive times (t=90, 120 and 150 days). The units are in◦C. The horizontal dashed line shows the depth of 300 m.
OSD
10, 951–984, 2013The change in ENSO characteristics
V. N. Stepanov
Title Page
Abstract Introduction
Conclusions References
Tables Figures
◭ ◮
◭ ◮
Back Close
Full Screen / Esc
Printer-friendly Version Interactive Discussion
Discussion
P
a
per
|
D
iscussion
P
a
per
|
Discussion
P
a
per
|
Discuss
ion
P
a
per
standard a)
b)
c)
Fig. 6. 1989–2011 mean(a)and standard deviation(b)of sea level pressure, and correlations
OSD
10, 951–984, 2013The change in ENSO characteristics
V. N. Stepanov
Title Page
Abstract Introduction
Conclusions References
Tables Figures
◭ ◮
◭ ◮
Back Close
Full Screen / Esc
Printer-friendly Version Interactive Discussion
Discussion
P
a
per
|
D
iscussion
P
a
per
|
Discussion
P
a
per
|
Discuss
ion
P
a
per
|
of 199
a) b)
c) d)
Fig. 7.Sea level pressure anomaly (in HPa) for July–September mean of 1997 (a), 2002(b), 1998(c)and for August–October mean of 2007(d)before the maximum phase of the develop-ment of warm(a, b)and cold(c, d)ENSO.
OSD
10, 951–984, 2013The change in ENSO characteristics
V. N. Stepanov
Title Page
Abstract Introduction
Conclusions References
Tables Figures
◭ ◮
◭ ◮
Back Close
Full Screen / Esc
Printer-friendly Version Interactive Discussion
Discussion
P
a
per
|
D
iscussion
P
a
per
|
Discussion
P
a
per
|
Discuss
ion
P
a
per
|
ies
Fig. 8. Normalized on their standard deviations anomalies monthly time series of NINO3.4 index (black dashed) and the averaged sea level pressure along 280◦E between 35◦S (the point marked by black cross on Fig. 4c) and 45◦S, ∆p, (solid). The black solid line is after applying 5 month running average procedure and it is shifted 4 months forward; the seasonal cycle was subtracted.
OSD
10, 951–984, 2013The change in ENSO characteristics
V. N. Stepanov
Title Page
Abstract Introduction
Conclusions References
Tables Figures
◭ ◮
◭ ◮
Back Close
Full Screen / Esc
Printer-friendly Version Interactive Discussion
Discussion
P
a
per
|
D
iscussion
P
a
per
|
Discussion
P
a
per
|
Discuss
ion
P
a
per
|
a) b)
c) d)
leve
–
1989-1999 2000-2008
e) f)
2000-2007 2008-2011
Fig. 9. 1989–1999(a)and 2000–2008(b)standard deviations of sea level pressure (in Hpa);
(c–d)– the same as(a–b), but normalized on 1989–2011 mean standard deviations, and shown in enlarged scale for the tropics;(e–f)the same as (c–d)but for 2000–2007 and 2008–2011 periods, respectively.
OSD
10, 951–984, 2013The change in ENSO characteristics
V. N. Stepanov
Title Page
Abstract Introduction
Conclusions References
Tables Figures
◭ ◮
◭ ◮
Back Close
Full Screen / Esc
Printer-friendly Version Interactive Discussion
Discussion
P
a
per
|
D
iscussion
P
a
per
|
Discussion
P
a
per
|
Discuss
ion
P
a
per
|
a) d)
b) e)
c) f)
Fig. 10.EOF1(a), EOF2(b)and EOF5(c)modes of the Southern ocean region SLP (1989– 2011) multiplied by respective standard deviations of the principal components (units in Hpa). Normalized time series (solid line) of PC1(d), PC2(e) and PC5(f). Also shown is the time series of the NINO4 index (dashed line). PC1, PC2 and PC5 are after applying 5 month running average procedure and they are shifted forwards by 1, 4 and 8 months respectively.