Plasticity on Alternative Host Plants for the Cereal Aphid
Sitobion avenae
Xinjia Dai1,2,3, Suxia Gao1,2,3, Deguang Liu1,2,3*
1State Key Laboratory of Crop Stress Biology for Arid Areas (Northwest A&F University), Yangling, Shaanxi Province, China,2Key Laboratory of Integrated Pest Management on Crops in Northwestern Loess Plateau, Ministry of Agriculture, Yangling, Shaanxi Province, China,3College of Plant Protection, Northwest A&F University, Yangling, Shaanxi Province, China
Abstract
Sitobion avenae (F.) can survive on various plants in the Poaceae, which may select for highly plastic genotypes. But phenotypic plasticity was often thought to be non-genetic, and of little evolutionary significance historically, and many problems related to adaptive plasticity, its genetic basis and natural selection for plasticity have not been well documented. To address these questions, clones ofS. avenaewere collected from three plants, and their phenotypic plasticity under alternative environments was evaluated. Our results demonstrated that nearly all tested life-history traits showed significant plastic changes for certainS. avenaeclones with the total developmental time of nymphs and fecundity tending to have relatively higher plasticity for most clones. Overall, the level of plasticity for S. avenae clones’ life-history traits was unexpectedly low. The factor ‘clone’ alone explained 27.7–62.3% of the total variance for trait plasticities. The heritability of plasticity was shown to be significant in nearly all the cases. Many significant genetic correlations were found between trait plasticities with a majority of them being positive. Therefore, it is evident that life-history trait plasticity involved was genetically based. There was a high degree of variation in selection coefficients for life-history trait plasticity of differentS. avenaeclones. Phenotypic plasticity for barley clones, but not for oat or wheat clones, was frequently found to be under significant selection. The directional selection of alternative environments appeared to act to decrease the plasticity ofS. avenaeclones in most cases. G-matrix comparisons showed significant differences betweenS. avenaeclones, as well as quite a few negative covariances (i.e., trade-offs) between trait plasticities. Genetic basis and evolutionary significance of life-history trait plasticity were discussed.
Citation:Dai X, Gao S, Liu D (2014) Genetic Basis and Selection for Life-History Trait Plasticity on Alternative Host Plants for the Cereal AphidSitobion avenae. PLoS ONE 9(9): e106179. doi:10.1371/journal.pone.0106179
Editor:Ulrich Melcher, Oklahoma State, United States of America
ReceivedJune 3, 2014;AcceptedAugust 2, 2014;PublishedSeptember 2, 2014
Copyright:ß2014 Dai et al. This is an open-access article distributed under the terms of the Creative Commons Attribution License, which permits unrestricted use, distribution, and reproduction in any medium, provided the original author and source are credited.
Data Availability:The authors confirm that all data underlying the findings are fully available without restriction. All relevant data are within the paper. Funding:This research was supported by the Specialized Research Fund for the Doctoral Program of Higher Education from Ministry of Education of China (No. 20110204120001) (http://www.moe.edu.cn/), and a grant from Northwest A&F University (No. QN2011059) (http://www.nwsuaf.edu.cn). DL received the funding. The funders had no role in study design, data collection and analysis, decision to publish, or preparation of the manuscript.
Competing Interests:The authors have declared that no competing interests exist. * Email: [email protected]
Introduction
All organisms live in spatially and temporally variable and sometimes predictable environments. Organisms may cope with the highly variable environments by adaptation through genetic modifications under natural selection [1]. Phenotypic plasticity may also facilitate successful use of changing environments by an organism, and thus is considered to be another mechanism for adaptation [2]. However, the optimal strategy of organisms is assumed to be non-plastic and maximal in fitness traits for all environments, so one would rarely expect traits tightly linked to fitness to be plastic [3]. In addition, phenotypic plasticity was often considered to buffer the impact of natural selection, and thus act to slow evolutionary changes [4]. Therefore, phenotypic plasticity of an organism in response to variable environments had long been considered to be non-genetic and of little evolutionary importance until late 1980s [5]. Bradshaw coined the term ‘phenotypic plasticity’ to describe environmentally contingent morphological expression when developmental variability was considered to be
There exist fundamental differences in biological features among various organisms (e.g., plants and animals), which can have important implications for the evolution of phenotypic plasticity. For example, plants (sessile organisms) usually have greater plasticity than animals (mobile organisms) in morpholog-ical and developmental responses to changes in their biotic and abiotic environments, probably because animals can often move away from unfavorable environments [5,18]. As a large and abundant group of organisms, http://en.wikipedia.org/wiki/ Phenotypic_plasticity - cite_note-3#cite_note-3insect herbivores (many of them are highly mobile) have their own biological properties, and can often utilize a variety of host plant species. Significant variation in morphology, physiology and chemistry can occur among these plants [19]. Different host plants of insects often exist in temporally and spatially discrete patches that act as differential selective environments. Therefore, insect herbivores were also shown to be plastic in morphology, physiology, behavior or life-history in response to different host plants [4,15,20–21]. Surprisingly, studies on phenotypic plasticity of insects’ life-history traits on different host plants have been rare.
Aphids’ success in a wide diversity of ecosystems is partially attributed to their broad phenotypic plasticity in color, wing production and reproduction, although many of them are specialized on particular host plants [22–23]. The cotton aphid (Aphis gossypii Glover) or black bean aphid (Aphis fabae) was shown to be plastic in morphology [20], insecticide susceptibility [24], host choice behavior [21] or life-history traits (e.g., developmental times) [4]. Host plants (i.e., different environments) were found to be an important factor in inducing aphids’ plastic changes in phenotypes [4,20–21]. Host plants also showed conditioning effects on the tested aphids, which is another piece of evidence for plasticity that happens without substantial modifications on the insect genome [21,25–26]. Plasticity resulting from different host plants can play significant roles influencing the evolutionary trajectory of aphids. Surprisingly, studies on pheno-typic plasticity of aphids’ life-history traits have been rare.
The cereal aphid,Sitobion avenae(Fabricius), can survive on numerous species in the Poaceae [27], and provides a good model to study life-history trait plasticity for insects that can disperse long distances. Several studies characterized key life-history traits (e.g., developmental times and fecundity) ofS. avenaeclones on wheat, barley and oat [25,28–31]. In our previous study, we compared barley clones to oat clones from Shaanxi province, and found that barley and oat clones differentiated significantly in life-history traits, heritabilities of those traits, and the extent of specialization on a particular host plant; however, divergent selection on both host plants did not result in the formation of highly specialized clones or host races [23]. Therefore, differential adaptation ofS. avenaeclones to barley or oat in our previous study might result from their phenotypic plasticity. Since spatial heterogeneity and dispersal of organisms can have significant consequences for the evolution of plasticity [32], the study mentioned above had limitations in the number of host plants tested (i.e., two) and the source of tested S. avenae clones (from a single location) for analyzing the effects of plasticity. So, we collectedS. avenaeclones on three cereal crops from two provinces of China, and tested them in the laboratory. We hypothesize that key life-history traits of S. avenaewas highly plastic in alternative environments, and the trait plasticity involved is genetically based and evolutionarily important. The aims of this study were to: 1) characterize phenotypic plasticity of key life-history traits forS. avenaeclones in alternative environments (i.e., on alternative host plants); 2) assess the underlying genetic basis and natural selection for
life-history trait plasticity ofS. avenaeclones; and 3) evaluate whether the observed plastic responses ofS. avenaeare adaptive.
Materials and Methods Aphids and Plants
In order to increase genetic variability, S. avenae clonal genotypes were sampled from three host species and distinct locations from two provinces of China. Individual clones of S. avenaewere collected in May of 2013 in Shaanxi Province, and in August of 2013 in Qinghai province. These clones came from barley, oat and wheat fields in the Shaanxi area (collected at three sites: 34u17921.640N, 108u4910.090E; 34u1896.350N, 108u 5920.540E; 34u18935.730N, 107u57942.200E) and Qinghai area (collected at three sites: 36u48982.330N, 101u59989.940E; 37u04987.060N, 101u90900.310E; 37u13904.890N, 101u28978.210E) (no specific permissions were required for the sample collecting activities at all the abovementioned sites, and no endangered or protected species were involved in the collecting activities). In order to limit the chance of re-sampling individuals from the same parthenogenetic mother, an individual wingless adult aphid was collected from a plant separated by at least 10 m from other samples [25]. At least 20 different clones were collected for each plant species in each area, and they were used to start separate colonies in the laboratory. Aphid clones were cultured on the species of plants from which they were originally collected (i.e., barley, oat or wheat). Wheat (Triticum aestivumL. cv. Aikang 58), oat (Avena sativaL. cv. Sandle) and barley (Hordeum vulgareL. cv. Xian 91–2) seeds were planted in plastic pots (6 cm in diameter) containing turfy soil, vermiculite and perlite (4:3:1, v/v/v). Plants with collected clones were enclosed with a transparent cylinder (5.5 cm in diameter, 15 cm in height) which had a Terylene mesh top for ventilation, and maintained in rearing rooms (at 2062uC and a photoperiod of 16: 8 (L: D)). Plants were watered or replenished as needed. Prior to the bioassays, aphid clones were reared for two generations under common conditions in the lab to minimize the effects of confounding factors (e.g., weather conditions) according to Pitchers et al. [33]. After that, aphid clones were randomly selected from the colony for use in the following tests.
Life History Data Collection
Statistical Analysis
Developmental times of first to fourth nymphal instars (hereafter referred to as DT1 to DT4), the total developmental time of nymphs (from birth to adult emergence) (hereafter referred to as DT5), and 7-d fecundity (nymphs born in the first 7 d after the initiation of reproduction) were calculated. The abovementioned fitness traits were analyzed with three way nested analysis of variance (ANOVA), which was conducted with clones nested in plant origin (i.e., barley, oat and wheat) in SAS [34]. The main effects of location, plant origin and test plant were analyzed, and the interaction between the latter two was also considered. When the overall variation in ANOVA was significant, post-hoc comparisons among means were carried out by using Tukey tests ata= 0.05.
The amount of plasticity was evaluated by calculating the coefficient of variation (CV~SD=x|100;SD, standard deviation
of treatments;x, mean of treatments) for each trait in different environments (i.e., on different hosts). Another nested ANOVA with abovementioned factors was performed to analyze the phenotypic plasticity of life-history traits and genetic variation underlying phenotypic plasticity. Data were log-transformed if needed to meet the assumptions of normality and homoscedastic-ity required for these analyses.
Our experimental design with clonal genotypes allows us to estimate the total variance of a particular trait (VP), which includes among-clone genetic components VG, the (broad sense) genetic variance, and within-clone components VE (i.e., environmental variance or residual variance). Broad-sense heritabilities were calculated as the proportion of the total variance accounted for by the among-clone variance component (H2
~VG=VP). The
statis-tical significance of heritabilities was assessed by using likelihood-ratio tests (LRTs) following Carter et al. [35].
Genetic variance and covariance estimates for life-history trait plasticities were obtained with the restricted maximum likelihood (REML) method implemented in the software VCE 6.0.2 [36]. The genetic correlation between traitsxandywas calculated from the genetic covariance estimate (cov[x, y]) and their additive variances asr~cov(x,y)(vx)|(vy)
0:5
. The resulting G matri-ces were compared using the Flury hierarchical method, using the software CPCrand [37]. Based on maximum likelihood, this method can analyze structural differences among G matrices by comparing their eigenvectors and eigenvalues. Specifically, the method can test the following models in order: (1) unrelated structure (meaning that matrices do not share any eigenvector), (2) partial common principal component (matrices sharing some eigenvectors), (3) common principal components (matrices sharing all eigenvectors but not eigenvalues), (4) proportionality (matrices with same eigenvectors and proportional eigenvalues), and (5) equality (matrices with same eigenvectors and eigenvalues) (see also in [35]). The significance of genetic covariances and correlations between trait plasticities were evaluated using LRTs following Carter et al. [35].
In this study, we used 7 d fecundity as the fitness estimate [23,31]. Relative fitness of an aphid clone was calculated by dividing the clone’s 7 d fecundity by the mean of all clones in each treatment. All traits were standardized to mean zero and unit variance. We then calculated univariate standardized selection differentials using parametric regression analysis following Lande and Arnold [38] to quantify the strength of selection forS. avenae
on the three cereals. Selection differentials can estimate the total strength of selection on a trait, and thus include both direct selection and indirect selection arising through covariances with other traits [39]. To separate the effects of direct selection on focal
traits from the effects of indirect selection on other traits, standard linear selection gradients were estimated by performing multiple regressions following Lande and Arnold [38]. Regression analyses were performed using the PROC REG procedure in SAS [34].
Principal component analysis (PCA) (Proc PRINCOMP) was performed with plasticities of all life-history traits measured above [34]. The factor weightings for each replicate in the PCA mentioned above were calculated and the resulting values were used as a composite plasticity factor in subsequent regression analyses. The PROC REG procedure in SAS [34] was used to identify the relationships between the relative fitness ofS. avenae
clones on test plants and the level of life-history plasticity (i.e., the composite plasticity factor calculated as the first component extracted from PCA).
Results
Life-history trait plasticity
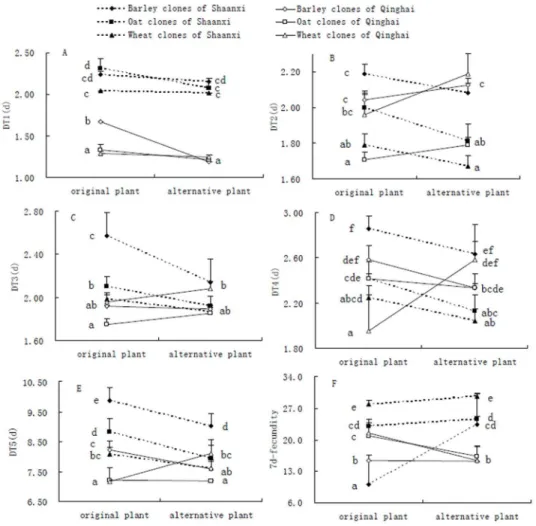
After transfer to alternative environments (i.e., alternative host plants), all tested clones from both areas showed non-significant changes in DT1 except the barley clones from the Qinghai area (Fig. 1A). DT1 of barley clones from Qinghai was significantly reduced in alternative environments, showing higher mean plasticity of these clones in comparison to other clones (Fig. 1A). DT2 presented non-significant changes for all clones (i.e., barley, oat and wheat) from both areas, indicating similar levels of mean plasticity for them (Fig. 1B). Barley clones from the Shaanxi area showed significantly lower DT3 in alternative environments (meaning relatively higher mean plasticity), but all other clones presented relatively lower mean plasticity in DT3, indicated by non-significant changes in DT3 in different environments (Fig. 1C). After they were transferred from plants of origin to alternative ones, significant changes in DT4 were found for oat clones from Shaanxi and wheat clones from Qinghai; non-significant changes were found for all other clones tested (Fig. 1D). After switching environments, all clones presented significant changes in DT5 but oat clones from Qinghai, indicating that DT5’s mean plasticity was relatively higher forS. avenaeclones in comparison to other trait plasticities (Fig. 1E). Significant changes in 7-d fecundity were identified for all clones of both areas but wheat clones of Shaanxi and barley clones from Qinghai, showing relatively higher mean plasticity of 7-d fecundity for the majority ofS. avenaeclones (Fig. 1F).
Genetic variation of trait plasticity
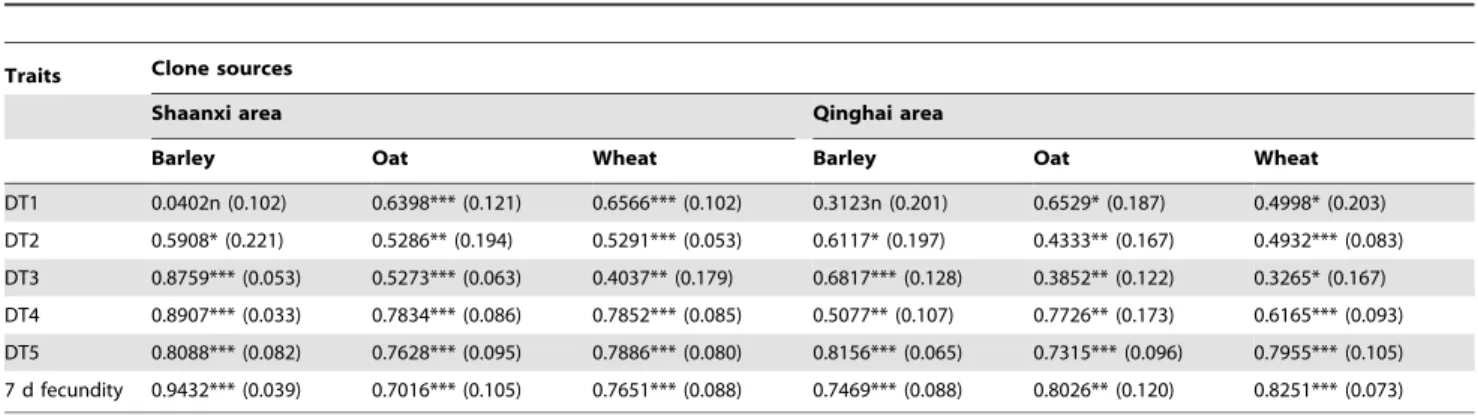
Sitobion avenaeclones from barley, oat and wheat presented little differentiation in broad-sense heritability of life-history trait plastcities (Table 2). The broad-sense heritabilities for all trait plasticities of all clones were high and significant except for DT1 of barley clones from both areas. Heritabilities were particularly high for the plasticities of DT3, DT4, DT5 and 7-d fecundity for barley clones from Shaanxi, and for those of DT5 for barley clones from Qinghai and 7-d fecundity for oat or wheat clones from Qinghai. Significant genetic correlations were found between plasticities of life-history traits for all clones from both areas (Table 3). All trait-plasticity pairs for barley clones from the Qinghai area presented significant genetic correlations but DT1-DT3, DT2-DT3, DT2-DT5, and DT2-7d fecundity, and all significant correlations for these clones were positive except the pair of DT1-DT2. For barley clones from Shaanxi, Plasticity of DT1was correlated with none of all other trait plasticities, which were significantly correlated with one another; the only significantly negative correlation (i.e., trade-off) for these clones was found between plasticities of DT2 and 7-d fecundity. Similar patterns were found for oat and wheat clones from both Qinghai and Shaanxi, where the majority of trait-plasticity pairs showed significant correlations, and all significant correlations were positive with few exceptions. The only negative correlations of
oat clones were found for the pairs of DT2-DT4 and DT2-DT5 of clones from Qinghai, and for DT1-DT3 and DT1-7 d fecundity from Shaanxi. The only significantly negative correlation of wheat clones was between plasticities of DT3 and 7 d fecundity for clones from Qinghai.
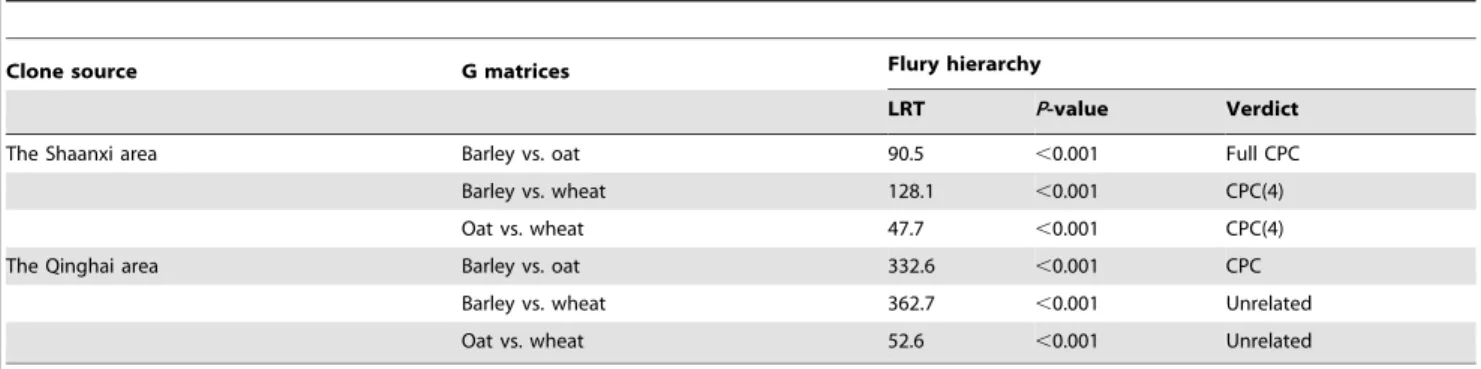
G-matrix comparisons by Flury’s method and jump-up approach (that is, at each step in the hierarchy, the hypothesis is tested against the hypothesis of unrelated structure) showed significant differences between paired matrices of life-history trait plasticities (Table 4). The difference between G matrices for barley and oat clones from both areas was best explained by the full CPC model (i.e., all principal components shared in common), but the matrices were not equal (for Shaanxi: LRT = 90.5,P,0.001; for Qinghai: LRT = 332.6, P,0.001). The CPC(4) model best explained the differences between matrices for barley and wheat clones (LRT = 128.1, P,0.001), and between those for oat and wheat clones (LRT = 47.7,P,0.001) from the Shaanxi area, in other words, matrices shared four of the six possible principal components. However, unrelated structures were found between matrices for barley and wheat clones (LRT = 362.7,P,0.001), and between those for oat and wheat clones (LRT = 52.6, P, 0.001) from the Qinghai area.
Figure 1. Comparisons of life-history traits for barley, oat and wheat clones ofSitobion avenaefrom two areas on original and alternative host plants, showing mean plasticity of tested clones (A-D for DT1-DT4, the developmental time of 1stto 4thinstar nymphs; E for DT5, the total developmental time of nymphs; F for 7-d fecundity; data for a particular trait with different letters were significantly different at theP,0.05 level, ANOVA followed by Tukey tests).
Selection of alternative environments on trait plasticity Directional selection differentials and gradients were estimated for barley, oat and wheat clones from both areas (Table 5). Barley clones from the Qinghai area presented significantly negative differentials for the plasticity of all life-history traits tested but DT2 and DT3. For barley clones from Qinghai, the directional selection gradients of plasticity for DT1 and DT4 were signifi-cantly negative, those for DT2 and DT3 signifisignifi-cantly positive, and those for DT5 and 7-d fecundity non-significant. All selection coefficients for barley clones from the Shaanxi area were significant except the selection gradient of plasticity for DT2 and
selection differentials of plasticity for DT1 and DT2, and all the significant selection coefficients were negative except the selection gradient of plasticity for DT5. Oat clones from Qinghai showed significantly negative selection coefficients (i.e., differential and gradient) for plasticity of DT4 and 7-d fecundity, the selection differential of DT5 plasticity was also significantly negative, and all other selection coefficients for these clones were non-significant. The only significant coefficient for oat clones from Shaanxi was the selection gradient of DT2 plasticity. Wheat clones from Qinghai had a significantly negative differential and gradient for DT5 plasticity, and they also had a significantly negative selection
Table 1.Estimates of variance components for trait plasticities ofSitobion avenaeclones showing main effects of collecting locations (location), plant origin (origin), test plant (test), clone nested in origin and interactions (significant effects highlighted in boldface).
Trait Variance source df F P % total
Developmental time of 1stinstar nymphs Location 1 10.74
0.001 1.3
Origin 2 24.20 ,0.001 6.0
Test 2 2.79 0.063 0.7
Origin6test 1 27.98 ,0.001 3.5
Clone(origin) 38 10.98 ,0.001 52.1
Error 291 2 2 36.3
Developmental time of 2ndinstar nymphs Location 1 92.47
,0.001 10.6
Origin 2 3.52 0.03 0.8
Test 2 3.76 0.02 0.9
Origin6test 1 56.59 ,0.001 6.5
Clone(origin) 38 10.97 ,0.001 47.8
Error 291 2 2 33.4
Developmental time of 3rdinstar nymphs Location 1 68.40 ,0.001 6.2
Origin 2 20.91 ,0.001 3.8
Test 2 17.30 ,0.001 3.1
Origin6test 1 16.33 ,0.001 1.5
Clone(origin) 38 17.10 ,0.001 59.0
Error 291 2 2 26.4
Developmental time of 4thinstar nymphs Location 1 72.26 ,0.001 5.8
Origin 2 39.82 ,0.001 6.3
Test 2 8.24 ,0.001 1.3
Origin6test 1 14.36 ,0.001 1.1
Clone(origin) 38 20.56 ,0.001 62.3
Error 291 2 2 23.2
Total Developmental time of nymphs Location 1 99.72 ,0.001 10.3
Origin 2 42.58 ,0.001 8.8
Test 2 17.64 ,0.001 3.7
Origin6test 1 62.29 ,0.001 6.5
Clone(origin) 38 10.31 ,0.001 40.6
Error 291 2 2 30.1
7-d fecundity Location 1 472.05 ,0.001 19.3
Origin 2 442.41 ,0.001 36.2
Test 2 43.62 ,0.001 3.6
Origin6test 1 30.64 ,0.001 1.3
Clone(origin) 38 17.81 ,0.001 27.7
Error 291 2 2 11.9
differential for DT2 plasticity. Alternative host plants also showed little selection for life-history trait plasticity of wheat clones from Shaanxi, and the only significant selection coefficients were the selection differential of plasticity for DT4, and the selection differential and gradient of plasticity for 7-d fecundity.
Relationship between plasticity and fitness
The relative fitness ofS. avenaeclones was regressed against the first factor (PC1) extracted from PCA of all life-history trait plasticities. The results of PCA for all clones showed the first three components explaining 83.2% (45.9% for PC1) of the total data variability. Barley clones with higher plasticity tended to have
lower fitness, whereas the fitness of wheat clones tended to rise with increasing plasticity (Fig. 2). The linear relationship between relative fitness and plasticity was found to be significant for barley clones (Fig. 2A, R2= 0.25, P,0.001) or wheat clones (Fig. 2C, R2= 0.06, P,0.01). But the linear relationship between fitness and plasticity was not significant for oat clones (Fig. 2B).
Discussion
Genetic basis of phenotypic plasticity
Phenotypic plasticity is considered a universal quality of life, but it’s often neglected and thought to be non-genetic historically (until
Table 2.Broad-sense heritabilities (SE) of life history trait plasticities for differentSitobion avenaeclones from barley, oat and wheat on alternative host plants.
Traits Clone sources
Shaanxi area Qinghai area
Barley Oat Wheat Barley Oat Wheat
DT1 0.0402n (0.102) 0.6398*** (0.121) 0.6566*** (0.102) 0.3123n (0.201) 0.6529* (0.187) 0.4998* (0.203) DT2 0.5908* (0.221) 0.5286** (0.194) 0.5291*** (0.053) 0.6117* (0.197) 0.4333** (0.167) 0.4932*** (0.083) DT3 0.8759*** (0.053) 0.5273*** (0.063) 0.4037** (0.179) 0.6817*** (0.128) 0.3852** (0.122) 0.3265* (0.167) DT4 0.8907*** (0.033) 0.7834*** (0.086) 0.7852*** (0.085) 0.5077** (0.107) 0.7726** (0.173) 0.6165*** (0.093) DT5 0.8088*** (0.082) 0.7628*** (0.095) 0.7886*** (0.080) 0.8156*** (0.065) 0.7315*** (0.096) 0.7955*** (0.105) 7 d fecundity 0.9432*** (0.039) 0.7016*** (0.105) 0.7651*** (0.088) 0.7469*** (0.088) 0.8026** (0.120) 0.8251*** (0.073)
Note: DT1-DT4, the developmental time of 1stto 4thinstar nymphs; DT5, the total developmental time of nymphs; statistical significance of heritability for a trait within
clones (i.e. barley, oat, wheat) evaluated using likelihood-ratio tests; *,P,0.05; **,P,0.01; ***,P,0.001.
doi:10.1371/journal.pone.0106179.t002
Table 3.Genetic correlations among life history trait plasticities for differentSitobion avenaeclones from barley, oat and wheat in two areas.
Trait-plasticity pairs Clone sources
The Qinghai area The Shaanxi area
Barley Oat Wheat Barley Oat Wheat
DT1-DT2 20.9079** 0.0492 0.3974* 20.0298 0.2332* 0.3634*
DT1-DT3 0.0480 0.5457** 20.0545 0.0658 20.2651* 0.1720*
DT1-DT4 0.5144** 0.0407 0.2627* 0.0308 0.0602 0.2832*
DT1-DT5 0.3264* 0.3767* 0.1778* 0.0958 0.3304* 0.1812*
DT1-7 d fecundity 0.3816* 0.3511* 0.0926 20.0489 20.2455* 20.0846
DT2-DT3 0.1221 20.1156 20.1479 0.1964* 20.0943 0.0999
DT2-DT4 0.3761* 20.1558* 0.3252* 0.1614* 20.0985 0.3825**
DT2-DT5 20.1324 20.1924* 0.2670* 0.2843* 0.3874** 20.0046
DT2-7 d fecundity 20.1279 0.0425 0.1822* 20.3327* 20.0464 0.1560*
DT3-DT4 0.2112* 0.1041 0.1560 0.8745*** 0.2259* 0.3118*
DT3-DT5 0.6200** 0.2999* 0.0703 0.8429*** 0.1953* 0.3133*
DT3- 7 d fecundity 0.2548* 0.2546* 20.3055* 0.2577* 0.3048* 0.0046
DT4-DT5 0.3724** 0.4431** 0.4312** 0.8271*** 0.5573** 0.5580**
DT4-7 d fecundity 0.4789** 0.4762** 0.1668* 0.4057** 0.2568* 0.5298**
DT5-7 d fecundity 0.4740** 0.4965** 0.5531** 0.4536** 0.2848* 0.1787*
Note: DT1-DT4, the developmental time of 1stto 4thinstar nymphs; DT5, the total developmental time of nymphs; statistical significance of genetic correlations
late 1980s) [4–7,40]. Therefore, studies on the genetic basis of phenotypic plasticity in insects have been rare, especially for their key life-history traits. Our tests ofS. avenaeclones on barley, oat and wheat showed that the factor ‘clone’ accounted for a significant proportion (i.e., 27.7–62.3%) of the total variance for the life-history trait plasticities, indicating that the divergence of plasticity among S. avenaeclones had a genetic basis. Another piece of evidence for the genetic basis of plasticity is that nearly all plasticities of life-history traits for all tested clones showed significant heritability with very few exceptions. Significant genetic correlations were also found between plasticities of life-history traits for all testedS. avenaeclones, which provided an additional piece of information regarding the genetic basis of phenotypic plasticity. Three genetic models have been proposed to explain phenotypic plasticity, and they are overdominance, pleiotropy, and epistasis [3]. The overdominance model states that plasticity decreases with increasing heterozygosity (i.e., the more
heterozy-gous a clone, the less plastic it will be), and this model can be important for explaining plasticity in aphids that frequently show high heterozygote excess due to parthenogenesis [41–42]. The genetic mechanisms that underlie plastic response are still poorly understood [43]. Further studies with tested clones using microsatellites can clarify the relationship between heterozygosity and plasticity in aphids, and improve our understanding of genetic basis for plasticity in aphids.
Selection on life-history trait plasticity
Alternative environments can impose natural selection not only on life-history traits, but on their plasticity. Questions related to how (and how frequently) natural selection acts on plasticity are conceptually crucial for our understanding not only of genotype-by-environment interactions, but also of phenotypic evolution in general [16]. In our study, there was substantial selection directly on the plasticity of developmental times for barley clones, which
Table 4.Comparisons of G-matrices for life-history trait plasticities of barley, oat and wheat clones ofSitobion avenaein two areas.
Clone source G matrices Flury hierarchy
LRT P-value Verdict
The Shaanxi area Barley vs. oat 90.5 ,0.001 Full CPC
Barley vs. wheat 128.1 ,0.001 CPC(4)
Oat vs. wheat 47.7 ,0.001 CPC(4)
The Qinghai area Barley vs. oat 332.6 ,0.001 CPC
Barley vs. wheat 362.7 ,0.001 Unrelated
Oat vs. wheat 52.6 ,0.001 Unrelated
Note: The verdict of the Flury hierarchy is the model shown to be the best in explaining the difference between paired matrices; theP-values are for the test of equality of two matrices; full CPC, all principal components shared in common; CPC(4), four of the six possible components shared in common; unrelated, no relations between the matrices.
doi:10.1371/journal.pone.0106179.t004
Table 5.Selection differentials and gradients for life-history trait plasticities ofSitobion avenaeclones collected from barley, oat and wheat in two areas.
Traits Barley clones Oat clones Wheat clones
Differential Gradient Differential Gradient Differential Gradient
For clones from the Qinghai area
DT1 20.1425*** 20.0659* 20.0655 20.0090 0.0048 0.0631
DT2 0.0495 0.0763* 20.0288 20.0286 20.0860* 20.0775
DT3 0.0091 0.0815* 20.0328 0.0294 0.0024 0.0350
DT4 20.1368*** 20.1045** 20.1991*** 20.1161*** 20.0568 0.0366 DT5 20.1104** 20.0743 20.1259** 0.0212 20.1584*** 20.1999***
7-d fecundity 20.1341*** 20.0333 20.2480*** 20.2057*** 20.0916* 0.0487
For clones from the Shaanxi area
DT1 20.0342 20.0384** 20.0201 20.0215 20.0264 20.0257
DT2 0.0262 20.0042 0.0158 0.0290* 20.0260 20.0026
DT3 20.0881*** 20.0895** 0.0174 0.0208 0.0075 0.0220 DT4 20.0986*** 20.0597* 20.0030 0.0094 20.0499*** 20.0245 DT5 20.0784*** 0.0959** 20.0063 20.0149 20.0219 20.0027
7-d fecundity 20.0927*** 20.0919*** 20.0090 20.0176 20.0531*** 20.0413*
Note: DT1-DT4, the developmental time of 1stto 4thinstar nymphs; DT5, the total developmental time of nymphs; *,P
was indicated by their significant selection gradients. However, there was little such selection for oat or wheat clones. Substantial direct selection on the plasticity of fecundity was also found for certain clones of barley, oat and wheat. The direct selection of alternative environments acted to decrease the plasticity of S. avenae’s life-history traits in most cases except that it increased the plasticity of developmental times of certain nymphal instars for barley clones. Alternative environments produced positive direct selection on the plasticity of total developmental time of nymphs for barley clones from Shaanxi area, but this was masked in the selection differential by indirect selection through some correlated characters. However, differing signs on the coefficients for the directional selection gradient of the developmental times for barley clones were found, so selection could act separately on the trait
plasticities involved. Therefore, our study revealed significant directional selections on the developmental times and fecundity of
S. avenae, but the identified directional selection acted to decrease the plasticity in most cases. The results appeared to be in agreement with the findings that some S. avenae clones were specialized to a certain extent on different hosts [23,25,44], since highly plastic genotypes may lower their plasticity to become relatively specialized to certain environment. Other relatively generalized clones may be sufficiently plastic to survive well on the three cereals (i.e., barley, oat and wheat), so that natural selection will not occur to produce specialized ecotypes. Although phenotypic plasticity is a common phenomenon in aphids, it appears that highly plastic clones ofS. avenaehave been removed from the population by natural selection. It is assumed that traits that are tightly linked to fitness should be more strongly canalized as a result of past stabilizing selection [3,45]. Our finding is consistent with the abovementioned assumption, since develop-mental times and fecundity of an organism are both key fitness components.
Evolutionary significance of plasticity
After cereal crops are harvested in the summer, some individuals of S. avenae may disperse a short distance to find wild grass hosts, others may have to move long distance northward to find other cereal crop fields. So, a S. avenae clone may experience several host plant species in a single year. This pattern might lead to the maintenance of moderate phenotypic plasticity in response to changes in host plant species. It makes sense to assume that a clone with higher plasticity can become established more easily in alternative environments than that with low plasticity. Adaptive phenotypic plasticity can evolve in natural populations, which is suggested by the frequent observation of genetic variation for plasticity, but direct experimental evidence is rare due to logistical reasons [16]. In our study, some wheat clones ofS. avenaewith higher level of life-history trait plasticity tended to have higher fitness, indicating that phenotypic plasticity can be adaptive for these clones. Positively affected clones may reinforce the relationship between plasticity and fitness during feeding on alternative host plants. Significant heritability and genetic corre-lations forS. avenae’s life-history trait plasticities identified in our study also indicated the evolutionary potential of adaptive plasticity. However, evidence for adaptive plasticity was not found for oat or barley clones. Cost of plasticity was an important factor influencing evolution of adaptive plasticity for insect populations experiencing heterogeneous environments [46]. So, the cost of being plastic could be high for barley or oat clones. Another mutually non-exclusive explanation is that a population that inhabits heterogeneous environments may be selected to evolve a genetic constitution that allows different levels of phenotypic plasticity to adjust to different environments so as to increase its overall fitness [47].
The evolution of adaptive plasticity can also be influenced by the structure of G-matrix for S. avenae’s life-history trait plasticities. Interestingly, quite a few negative covariances (i.e., trade-offs) were found between trait plasticities. These trade-offs (also shown by negative genetic correlations) may also playing a role in slowing the evolution of highly plastic S. avenae clones. Significant differences between matrices for barley, oat and wheat clones were found, which have important implications for the overall direction of plasticity evolution inS. avenae. The G-matrix structure of different traits for aphid clones have complex relationships with factors like clone specialization, trade-offs, and genotype-by-environment interactions [48]. It may be interesting to determine the stability of the G-matrix for life-history trait
Figure 2. Relationship between total life-history trait plasticity and relative fitness of Sitobion avenae clones collected from barley (A), oat (B) and wheat (C) (the amount of plasticity evaluated by calculating the coefficient of variation for each trait in different environments; total life-history trait plasticity calculated from the first factor extracted from the principal component analysis of all life-history trait plasticities).
plasticity of S. avenae over time and further explore its evolutionary implications in future studies.
The selection of clones with relatively low life-history trait plasticity was found for barley clones in our study. This may facilitate the process whereS. avenaeclones become specialized to a certain host plant. Recently, plasticity has been widely recognized as a significant mode of phenotypic diversity and hence as an important aspect of how organisms evolve in different environments [43]. It has been pointed out that speciation in herbivore species can start with phenotypic plasticity, not necessarily with reproductive isolation, therefore, the presence of sufficient variation in phenotypic plasticity of aphids may facilitate host race formation and sympatric speciation [4]. A recent study showed that five uniqueS. avenaebiotypes might have developed on commonly planted wheat varieties in China [49]. It appears that perfect plasticity is hard to evolve forS. avenae, but plasticity may be important for the evolution of specialized genotypes. This
leads to the challenging question of whether phenotypic plasticity is the raw material for speciation and biodiversity [45]. Further studies with costs of life-history trait plasticity may provide insights into its evolution, as well as its significance in host race formation and sympatric speciation forS. avenae.
Acknowledgments
We appreciate the laboratory and field assistance of X.-L. Huang, P. Dai, and D. Wang (Northwest A&F University, China). We want to thank Y.-G. Hu and X.-S. Hu (Northwest A&F University, China) for providing plant seeds used in this study.
Author Contributions
Conceived and designed the experiments: SG DL. Performed the experiments: SG XD. Analyzed the data: DL XD. Contributed to the writing of the manuscript: DL XD.
References
1. Orr HA (2005) The genetic theory of adaptation: a brief history. Nature Reviews Genetics, 6: 119–127.
2. Sultan SE (1995) Phenotypic plasticity and plant adaptation. Acta Botanica Neerlandica, 44: 363–383.
3. Scheiner SM (1993) Genetics and evolution of phenotypic plasticity. Annual Review of Ecology and Systematics 24: 35–68.
4. Gorur G, Lomonaco C, Mackenzie A (2005) Phenotypic plasticity in host-plant specialization inAphis fabae. Ecological Entomology 30: 657–664.
5. Schlichting CD (1986) The evolution of phenotypic plasticity in plants. Annual Review of Ecology and Systematics 17: 667–693.
6. Bradshaw AD (1965) Evolutionary significance of phenotypic plasticity in plants. Advances in Genetics 13: 115–155.
7. Sultan SE (2007) Development in context: the timely emergence of eco-devo. Trends in Ecology and Evolution 22: 575–582.
8. Kelly SA, Panhuis TM, Stoehr AM (2012). Phenotypic Plasticity: Molecular Mechanisms and Adaptive Significance. Comprehensive Physiology 2: 1417– 1439.
9. Sultan SE (1987) Evolutionary Implications of Phenotypic Plasticity in Plants. In: Hecht M, Wallace B, Prance G, editors. Evolutionary Biology. New York, NY: Springer US. 127–178 p.
10. Price TD, Qvarnstrom A, Irwin DE (2003) The role of phenotypic plasticity in driving genetic evolution. Proceedings of the Royal Society of London Series B 270: 1433–1440.
11. Ghalambor CK, McKay JK, Carroll SP, Reznick DN (2007) Adaptive versus non-adaptive phenotypic plasticity and the potential for contemporary adaptation in new environments. Functional Ecology 21: 394–407.
12. Lande R (2009) Adaptation to an extraordinary environment by evolution of phenotypic plasticity and genetic assimilation. Journal of Evolutionary Biology 22: 1435–1446.
13. Chevin L-M, Lande R, Mace GM (2010) Adaptation, plasticity, and extinction in a changing environment: towards a predictive theory. PLoS Biology 8: e1000357.
14. DeWitt TJ, Scheiner SM (2004) Phenotypic variation from single genotypes: a primer. In: DeWitt TJ, Scheiner SM, editors. Phenotypic plasticity: Functional and Conceptual Approaches. New York, NY: Oxford University Press, Inc. 1– 9 p.
15. Whitman DW, Agrawal A (2009) What is phenotypic plasticity and why is it important? In: Whitman DW, Ananthakrishnan TN, editors. Phenotypic plasticity of insects: mechanisms and consequences. Enfield, NH: Science Publishers Inc. 1–63 p.
16. Pigliucci M (2005) Evolution of phenotypic plasticity: where are we going now? Trends in Ecology & Evolution 20: 481–486.
17. Bradshaw AD (2006) Unraveling phenotypic plasticity - why should we bother? New Phytologist 170: 644–648.
18. Borges RM (2008) Plasticity comparisons between plants and animals. Plant Signaling and Behavior 3: 367–375.
19. Fordyce JA (2005) Clutch size plasticity in the Lepidoptera. In: Ananthakrishnan TN, Whitman DW, editors. Insects and Phenotypic Plasticity. Enfield, NH: Science Publishers Inc. 125–144 p.
20. Wool D, Hales DF (1997) Phenotypic plasticity in Australian cotton aphid (Homoptera: Aphididae): host plant effects on morphological variation. Annals of the Entomological Society of America 90: 316–328.
21. Gorur G, Lomonaco C, Mackenzie A (2007) Phenotypic plasticity in host choice behavior in black bean aphid,Aphis fabae(Homoptera: Aphididae). Arthropod-Plant Interactions 1: 187–194.
22. Agarwala BK (2007) Phenotypic plasticity in aphids (Homoptera: Insecta): components of variation and causative factors. Current Science 93: 308–313.
23. Gao S-X, Liu D-G, Chen H, Meng X-X (2014) Fitness traits and underlying genetic variation related to host plant specialization in the aphidSitobion avenae. Insect Science 21: 352–362.
24. Godfrey LD, Fuson FJ (2001) Environmental and host plant effects on insecticide susceptibility of the cotton aphid (Homoptera: Aphididae). Journal of Cotton Science 5: 22–29.
25. Gao S-X, Liu D-G (2013) Differential performance ofSitobion avenaeclones from wheat and barley with implications for its management through alternative cultural practices. Journal of Economic Entomology 106: 1294–1301. 26. Via S (1991) Specialized host plant performance of pea aphid clones is not
altered by experience. Ecology 72: 1420–1427.
27. Blackman R, Eastop VF (2006)Aphids on the world’s herbaceous plants and
shrubs. Available: http://www.aphidsonworldsplants.info/index.htm. 28. Adams JB, Drew ME (1964) Grain aphids in New Brunswick II. Comparative
development in the greenhouse of three aphid species on four kinds of grasses. Canadian Journal of Zoology 42: 741–744.
29. Dean GJW (1973) Bionomics of aphids reared on cereals and some Gramineae. Annals of Applied Biology, 73: 127–135.
30. Watson SJ, Dixon AFG (1984) Ear structure and the resistance of cereals to aphids. Crop Protection 3: 67–76.
31. Huang X-L, Liu D-G, Gao S-X, Chen H (2013) Differential performance of
Sitobion avenaepopulations from both sides of the Qinling Mountains under common garden conditions. Environmental Entomology, 42: 1174–1183. 32. Via S, Lande R (1985) Genotype-environment interaction and the evolution of
phenotypic plasticity. Evolution 39: 505–522.
33. Pitchers WR, Brooks R, Jennions MD, Tregenza T, Dworkin I, et al. (2013) Limited plasticity in the phenotypic variance-covariance matrix for male advertisement calls in the black field cricket,Teleogryllus commodus. Journal of Evolutionary Biology 26: 1060–1078.
34. SAS (1998) SAS System, version 6.12, SAS Institute Inc., Cary, NC, USA. 35. Carter MJ, Simon J-C, Nespolo RF (2012) The effects of reproductive
specialization on energy costs and fitness genetic variances in cyclical and obligate parthenogenetic aphids. Ecology and Evolution 2: 1414–1425. 36. Neumaier A, Groeneveld E (1998) Restriced maximum likelihood estimation of
covariances in sparse linear models. Genetics Selection Evolution 30: 3–26. 37. Phillips PC, Arnold DE (1999) Hierarchical comparison of genetic
variance-covariance matrices. I. Using the Flury hierarchy. Evolution 53: 1506–1515. 38. Lande R, Arnold SJ (1983) The measurement of selection on correlated
characters. Evolution 37: 1210–1226.
39. Svensson EI, Kristoffersen L, Oskarsson K, Bensch S (2004). Molecular population divergence and sexual selection on morphology in the banded demoiselle (Calopteryx splendens). Heredity 93: 423–433.
40. West-Eberhard MJ (1989) Phenotypic plasticity and the origins of diversity. Annual Review of Ecology and Systematics 20: 249–278.
41. Papura D, Simon JC, Halkett F, Delmotte F, Le Gallic JF, et al. (2003) Predominance of sexual reproduction in Romanian populations of the aphid Sitobion avenae inferred from phenotypic and genetic structure. Heredity 90: 397–404.
42. Simon J-C, Baumann S, Sunnucks P, Hebert PDN, Pierre J-S, et al. (1999) Reproductive mode and population genetic structure of the cereal aphidSitobion avenaestudied using phenotypic and microsatellite markers. Molecular Ecology 8: 531–545.
43. Sultan SE (2000) Phenotypic plasticity for plant development, function and life history. Trends in Plant Science 5: 537–542.
45. Nylin S, Gotthard K (1998) Plasticity in life-history traits. Annual Review of Entomology 43: 63–83.
46. Relyea RA (2002) Costs of phenotypic plasticity. The American Naturalist 159: 272–282.
47. West-Eberhard MJ (2003) Developmental plasticity and evolution. New York: Oxford University Press. 794 p.
48. Nespolo RF, Halkett F, Figueroa CC, Plantegenest M, Simon J-C (2009) Evolution of Trade-Offs between Sexual and Asexual Phases and the Role of Reproductive Plasticity in the Genetic Architecture of Aphid Life Histories. Evolution 63: 2402–2412.