AG490 and PF431396 Sensitive Tyrosine
Kinase Control the Population Heterogeneity
of Basal STAT1 Activity in
Ube1l
Deficient
Cells
Hesung Now, Joo-Yeon Yoo*
Department of Life Sciences, Pohang University of Science and Technology (POSTECH), Pohang, 37673, Republic of Korea
Abstract
A population often contains distinct sub-populations, thereby increasing the complexity of the overall heterogeneity. However, the cellular origin and biological relevance of sub-popu-lations in cell population have not been clearly identified. Here we demonstrated the novel roles of ISGylation, which is an IFN-induced post-translational modification, controlling het-erogeneity at the population level in cultured adherent cells. Without UBE1L, an E1 enzyme of ISGylation, mouse embryonic fibroblasts (MEF) exhibited low viral resistance despite high STAT1 and ISG expression compared with the wild-type MEF. We observe that
Ube1l−/−MEF populations consist of two behaviorally distinguishable sub-populations with distinct basal STAT1 activity, while wild-type MEF populations are unimodal. This popula-tion heterogeneity inUbe1lknock-out cells was perturbed by tyrosine kinase inhibitors, AG490 and PF431396. In contrast, the neutralization of type I IFN did not affect population heterogeneity. Based on these results, we concluded that UBE1L functions to adjust basal immunological states with the regulation of population heterogeneity.
Introduction
In biological systems, most populations consist of heterogeneous sub-populations with differ-ent characteristics but not iddiffer-entical individuals. Classically, the heterogeneities at the genetic level such as nucleotide polymorphism, genome mutation, and chromosome instability are considered as sources of various biological phenomena, including evolution, speciation, pheno-typic divergence and disease development [1–3]. At the non-genetic level, the heterogeneity in epigenetic regulations of the genome such as DNA methylation, histone modification, and chromatin structures have been also suggested as sources of various biological processes [3,4]. In addition, intrinsic stochastic behavior of macromolecules previously considered as noise has been recently considered as a non-genetic source of heterogeneity within populations, which contributes to the diversity of cellular responses to changing environmental conditions [5,6].
a11111
OPEN ACCESS
Citation:Now H, Yoo J-Y (2016) AG490 and PF431396 Sensitive Tyrosine Kinase Control the Population Heterogeneity of Basal STAT1 Activity in Ube1lDeficient Cells. PLoS ONE 11(7): e0159453.
doi:10.1371/journal.pone.0159453
Editor:Arun Rishi, Wayne State University, UNITED STATES
Received:April 23, 2016
Accepted:July 1, 2016
Published:July 18, 2016
Copyright:© 2016 Now, Yoo. This is an open access article distributed under the terms of the Creative Commons Attribution License, which permits unrestricted use, distribution, and reproduction in any medium, provided the original author and source are credited.
Data Availability Statement:All relevant data are within the paper and its Supporting Information files.
Funding:This work was supported by a National Research Foundation of Korea (NRF) grant funded by the Korea government (MSIP) (no. 2012R1A4A1028200 and no. NRF-2015R1A2A1A10054957).
The co-existence of multiple states, independent to genetic heterogeneity, has been reported in various biological systems [7–9]. The resistant sub-populations confer survival against antibi-otics or chemotherapy in bacteria or cancer cells [10,11] and latency in human immunodefi-ciency virus integration [12]. During viral infection, multiple host factors, including the history of infection, cellular state of development, stages of cell cycle progression, and even the cellular morphology, are known to affect the cellular heterogeneity of host response against the virus [13]. Type I Interferon(IFN), which is the most potent anti-viral agent produced by the host, functions to disable the infected host cells, to induce the cell-intrinsic anti-viral state, and to activate the host immunity against infection [14]. The anti-viral effect of type I IFN is primarily mediated by IFN-stimulated genes (ISG), which are induced by the Janus kinase (JAK)-signal transducer and activator of transcription (STAT) pathway [15]. During anti-viral responses, the production of type I IFN is highly stochastic, since only a small fraction of virus-infected cells produce IFNs, while the infected neighboring cells go through the bystander effect [16,
17]. Different levels of signaling factors and receptors in the basal state prior to viral infection and the IFNβ-mediated feedback loop have been proposed as the source of the cellular hetero-geneity that results in the stochastic IFN production, conferring viral clearance with the host survival [17,18]. Although the consequences of cellular heterogeneity during viral infection are relatively well known, the control of population heterogeneity and the regulation of anti-viral responses are not understood.
ISGylation is a post-translational modification process that requires a cascade of enzymatic activities to conjugate IFN-stimulated gene 15 (ISG15) to target proteins [19]. The expression of ISG15, the enzymes responsible for its conjugation, and cellular target proteins such as DDX58, IRF3, PKR, and STAT1 are strongly induced by treatment of type I IFNs or viral infec-tion [19]. These results indicate that ISGylation plays critical roles in the regulation of anti-viral immunity. However, ISGylation-deficient mice exhibit complicated phenotypes against virus infection: their susceptibility to infection by vesicular stomatitis virus and lymphocytic choriomeningitis virus is unchanged [20], while their susceptibility to infection by influenza B virus infection is increased [21,22], compared with wild-type mice. Furthermore, the cellular targets of ISGylation are not exclusive to proteins in anti-viral responses, but include constitu-tive proteins with known cellular functions in cytoskeletal organization, stress responses, tran-scription, and even translation [23,24]. These characteristics suggest that the function of ISGylation is neither restricted to the regulation of a single target protein nor explained by the regulation of immune signaling strength.
In this study, we demonstrated the potential role of ISGylation in the blockage of population heterogeneity to enhance anti-viral immunity. We found that two separable sub-populations with distinct basal productions of type I IFN and ISGs appear in basalUbe1ldeficient cells. With these results, the regulation of population heterogeneity and the potential roles of ISGyla-tion on anti-viral responses were discussed.
Materials and Methods
Cell, virus and reagent
followed by further incubation with DMEM (10% FBS) until indicated time (including initial incubation time). Recombinant mouse IFNβwas purchased from PBL (Piscataway, NJ). Puri-fied anti-mouse Interferon alpha/beta receptor 1 (IFNAR-1) (#127301) and mouse IgG1,κas isotype control (#400101) used for neutralization was purchased from Biolegend (San Diego, CA). The cytokine and antibody are treated to the cells with desired concentration in DMEM (10% FBS) for indicated times. AG490 was purchase from Invivogen (San Diego, CA). SB20219, SP600125, U0126 and PD98059 were purchased from Sigma (St. Louis, MO). Jak inhibitor 1 was purchased from Merck (Kenilworth, NJ). Chemical drugs were dissolved to Dimethyl sulfoxide (DMSO) (Sigma, St. Louis, MO). DMSO was used for the control. Puromy-cin used for the mammalian cell selection was purchased from A.G Scientific. Inc (San Diego, CA).
Lentiviral transduction
pMSCV-puro-HA-UBE1L was generated for lentiviral transduction of humanUBE1L. The humanUBE1Ltagged with HA in amino-terminus from pCAGGs-HA-UBE1L[25] was poly-merase chain reaction (PCR) amplified with a pair of oligonucleotides (5-gcgaattcgccaccatg-tacccatacgac-3, 5-gcgaattctcacagctcatagtgcagag-3), followed by digestion withEcoRI. The PCR products were ligated into pMSCV-puro digested withEcoRI. pLL3.7-shIfnar1 was purchased (Bioneer, Korea) for lentiviral transduction of short-hairpin RNA targeting mouse specific
Ifnar1(gcgtctacattatagatgac aa). Lentiviruses were generated and prepared as previously described [26]. Purified lentiviruses were used to treatUbe1l+/+andUbe1l-/-MEFs in serum-free DMEM for 12 h. After washing with phosphate buffered saline, the cells were cultured in DMEM (10% FBS, 1% penicillin/streptomycin) for 48 h. The selection process using puromy-cin (10μg/ml) was performed in humanUBE1L-transduced MEFs, followed by single colony
selection and amplification. To measure the knockdown effect ofIfnar1, GFP-positive cells were selectively analyzed among the shIfnar1-transduced MEFs.
FACS analysis
To measure the surface expression of H-2Kb, cells were washed with fluorescence associated cell sorter (FACS) buffer (1% FBS in phosphate buffered saline), followed by staining with anti-H-2Kb conjugated with FITC or PE (#553569 or #553570, BD Pharmingen, San Diego, CA). To measure the total internal expression of H-2Kb, cells were fixed with 4% paraformaldehyde and permeabilized with 0.1% saponin (Sigma) in FACS buffer. Fixed and permeabilized cells were stained with anti-H-2Kb conjugated with FITC or PE. Stained cells were washed with FACS buffer and analyzed with a flow cytometer (FACSCalibur™, BD Biosciences, San Jose, CA). To sort cells according to H-2Kb expression levels, a flow cytometer associated with a cell sorting system (FACSAria™, BD Bioscience; Moflo™XDP, Beckman Coulter, Brea, CA) was used.
Total RNA preparation, real time quantitative and semi-quantitative PCR
Immunoblot analysis
Cells were lysed with lysis buffer (150 mM NaCl, 25 mM Tris–HCl, pH 7.4, 1% Triton X-100, 0.5% Deoxycholic acid, 0.1% SDS) supplemented with protease inhibitors and phosphatase inhibitors. Total lysates (10-30ug) were separated on SDS-PAGE and transferred to nitrocellu-lose membranes. The expressions of interested proteins were analyzed using specific antibodies according to manufacturer’s protocol. Antibodies used for immunoblot analysis were listed in
S2 Table.
Results
Ube1l
−/−MEFs basally express high levels of anti-viral genes but exhibit
low viral resistance
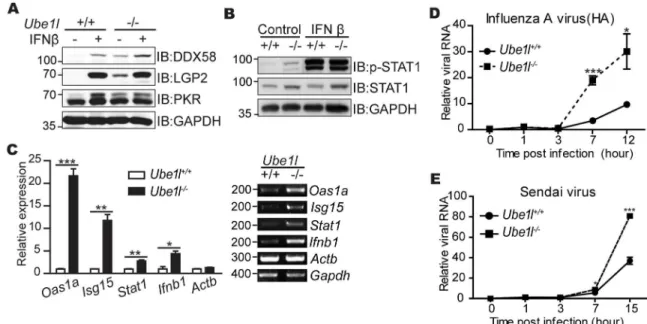
UBE1L is an E1 enzyme that is required for the conjugation of ISG15 to target proteins [20]. To understand the effects of ISGylation in the anti-viral response, we first measured the expres-sion of various genes required for anti-viral responses inUbe1l−/−mouse embryonic fibroblasts (MEFs). As previously reported [20],Ube1l−/−MEF did not show any significant defect in anti-viral protein expressions such as DDX58, LGP2, and PKR upon IFNβtreatment (Fig 1A). Con-sistent with that, IFNβ-mediated activation of STAT1 (phosphorylation at Tyr 701 residue) which is required for ISG expressions was also not significantly altered inUbe1l−/−MEFs (Fig
1B). These results indicate that UBE1L does not play any significant regulatory roles in type I IFN signaling pathways. However, the effects of ISGylation deficiency were mainly exerted in
Fig 1. TheUbe1l-deficient MEFs are more susceptible to viruses with higher STAT1 activity.(A) Immunoblot assay for measuring expression of indicated genes inUbe1l+/+andUbe1l-/-MEF with or without IFNβ(100 U/ml, 16 hour). (B)
Immunoblot assay for measuring STAT1 activity (phosphorylation of Tyr701 on STAT1) in inUbe1l+/+andUbe1l-/-MEFs with
or without IFNβ(100 U/ml, 30 min). (C) Relative mRNA expression of the indicated genes in basalUbe1l+/+andUbe1l -/-MEFs.Left–Using real-time quantitative PCR, normalizing withGapdh.Right–Representative agarose gel image using
conventional reverse-transcription PCR. Numbers beside image indicate the size of PCR product (base pairs). (D) Intracellular viral RNA normalizing withGapdhinUbe1l+/+andUbe1l-/-MEFs infected with influenza A virus (10 TCID50) for
the indicated time. (E) Relative amounts of intracellular viral RNA normalizing withGapdhinUbe1l+/+andUbe1l-/-MEFs infected with Sendai virus (10 TCID50) for indicated time. (A-B) Numbers beside blot images indicate the molecular weight (kDa). (C-E) Mean and standard error obtained from three independent experiments, unpaired t test,*p<0.05,**p<0.01, ***p<0.001.
the basal state. ISG expression and the STAT1 phosphorylation of the basalUbe1l−/−MEF were significantly higher than that of the wild-type cells. In the basal condition, mRNA expres-sion of various ISGs, includingOas1a,Isg15, andStat1, was significantly increased in ISGyla-tion-deficientUbe1l−/−MEFs (Fig 1C); the same was observed forIfnb1. Despite higher levels of basal STAT1 activity and anti-viral ISG expression,Ube1l−/−cells were more susceptible to viral infection (Fig 1D and 1E). These results suggest that the functions of UBE1L protein cannot simply explained by the overall expression levels of anti-viral genes in the cellular population.
Ube1l
deficient cells generate two sub-populations of distinct STAT1
activity
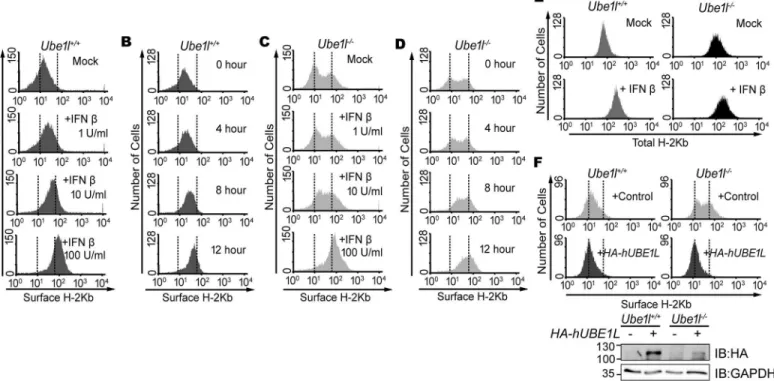
Because the total STAT1 activity was not correlated with the cellular responses against viral infection, we examined the heterogeneity of basal STAT1 activity within the whole population. Therefore, we monitored the cell-cell variations of STAT1 activity by measuring the surface presentation of class I MHC (H-2Kb). Its surface presentation is known to be induced by acti-vated STAT1 [27]. In the population ofUbe1l+/+cells, the surface H-2Kb expression was homogeneous, with unimodal distributions (Fig 2A and 2B). Upon stimulation with IFNβ, the whole population of theUbe1l+/+MEFs shifted to the right, indicating that surface H-2Kb expression was uniformly enhanced in this cell type. While the surface H-2Kb expression observed inUbe1l+/+cells was unimodal, inUbe1l−/−cells, it was bimodal and heterogeneous
Fig 2.Ube1l-deficient population harbors sub-populations with distinct surface H-2Kb expression.(A) FACS analysis of surface H-2Kb expression onUbe1l+/+MEFs with indicated amount of IFNβfor 16hour. (B) FACS analysis of surface H-2Kb expression onUbe1l+/+and MEFs, with
100U/ml of IFNβfor indicated time. (C) FACS analysis of surface H-2Kb expression onUbe1l-/-MEFs with indicated amount of IFNβfor 16hour. (D) FACS
analysis of surface H-2Kb expression onUbe1l-/-and MEFs, with 100U/ml of IFNβfor indicated time. (E) With or without the treatment of IFNβ(100U/ml, 16 h),Ube1l+/+andUbe1l-/-MEFs were harvested and permeabilized followed by FACS analysis for the whole cell H-2Kb expression. (F)Top—FACS
analysis of surface H-2Kb expression onUbe1l+/+andUbe1l-/-MEFs transduced with the control orHA-hUBE1L-lentivirus.Bottom
—Immunoblot for
confirming HA-UBE1L expression. Numbers beside blot images indicate the molecular weight (kDa).
with one sub-population showing low surface H-2Kb and another showing high H-2Kb expres-sion (Fig 2C and 2D). Upon stimulation with IFNβ, the H-2Kblowsub-population shifted to the right and merged to the H-2Kbhighsub-population. Meanwhile, the total intracellular H-2Kb protein levels were unimodal in bothUbe1l+/+andUbe1l−/−cells (Fig 2E), indicating that the bimodal surface presentation of H-2Kb does not happen due to changes in the steps of H-2Kb production. To examine whether the segregation of sub-population observed in theUbe1l−/− cells was caused by the lack of UBE1L, a lentiviral vector containingHA-hUBE1Lwas trans-duced into theUbe1l-/-cells (Fig 2F). This reconstitution abrogated the bimodality ofUbe1l−/− cells, resulting in homogeneous surface H-2Kb expression, confirming that UBE1L is responsi-ble for population segregation.
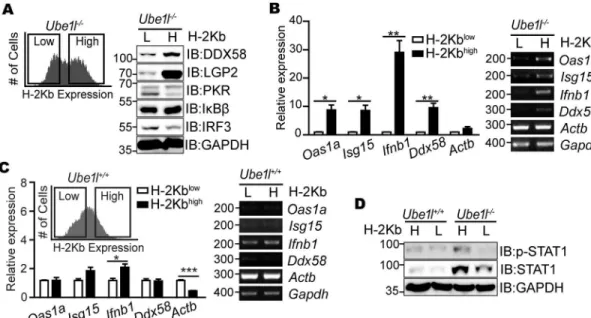
To determine whether theUbe1l−/−sub-populations with distinct surface H-2Kb expression exhibit distinct STAT1 activity, each sub-population was separately sorted according to H-2Kb expression (H-2Kbhighand H-2Kblow) with FACS, and expression of various ISGs was mea-sured (Fig 3A and 3B). Consistent with the results for surface H-2Kb, the H-2Kbhighcells expressed higher levels of ISGs compared to the H-2Kblowcells. Using the mean intensity value to separate the sub-populations ofUbe1l−/−cells, we also artificially sortedUbe1l+/+cells and measured ISGs (Fig 3C). UnlikeUbe1l−/−cells, significant differences in ISG expression were not observed in wild-type cells. Consistent with ISG andIfnb1expression, STAT1 phosphory-lation levels in the sortedUbe1l−/−MEF were revealed to be different with higher STAT1 phos-phorylation on H-2Kbhighthan on H-2Kblow, while no significant difference was observed in sortedUbe1l+/+MEF (Fig 3D). Based on these findings, we conclude that the UBE1L functions
Fig 3. Two sub-populations ofUbe1l
-/-MEFs possesses distinct basal STAT1 activity.(A) TheUbe1l-/-
sub-populations with high and low H-2Kb expression (H and L, respectively) were sorted using FACS and subjected to immunoblot assays with indicated antibodies. (B) Relative mRNA expression of the indicated genes in theUbe1l
-/-sorted according to H-2Kb expression. (C)Ube1l+/+MEF were sorted using the intensity value that separates H-2Kbhighand H-2KblowUbe1l-/-, and relative mRNA expression of the indicated genes were measured. (D) Immunoblot
assay for measuring basal STAT1 activity ofUbe1l+/+andUbe1l-/-MEFs sorted separately according to surface
H-2Kb expression. (A, D) Numbers beside blot images indicate the molecular weight (kDa). (B, C)Left–Using real-time
quantitative PCR, normalizing withGapdh. Mean and standard error obtained from three independent experiments, unpaired t test,*p<0.05,**p<0.01,***p<0.001.Right–Representative agarose gel image using conventional
reverse-transcription PCR. Numbers beside image indicate the size of PCR product (base pairs).
to control population segregation based on its differential basal STAT1 activity and ISG expressions.
Bimodal STAT1 activity is not mediated by basal type I IFN signaling
In search for signals that regulate basal STAT1 activityin Ube1l−/−cells, we first examined the effect of basal Type I IFN. Type I IFN is a major agonist for STAT1 activation and ISG expres-sion during the viral infection [14,15]. Furthermore, significantly different amounts of basal
Ifnb1mRNA expressions were detected between two sub-population ofUbe1l−/−MEF (Fig
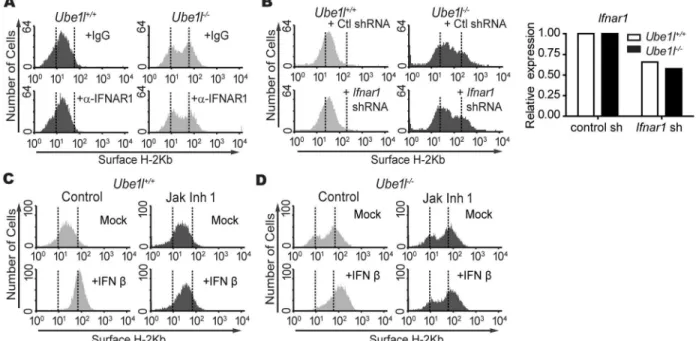
3C). To test this possibility, the neutralizing antibody of type I IFN receptor (IFNAR1) was treated to block the basal type I IFN signaling activity and the population heterogeneity was measured (Fig 4A). Despite the neutralization, two sub-populations were still present in
Ube1l−/−MEFs. The inhibition of type I IFN signaling activities with the lentiviral transduction of shRNA specific for mouseIfnar1also did not alter the bimodality ofUbe1l−/−MEFs (Fig
4B). Consistent with these results, the inhibition of JAK activities with the chemical inhibitor (Jak Inhibitor I) did not alter the bimodality inUbe1l−/−MEFs, although with complete inhibi-tion of type I IFN signaling (Fig 4C and 4D). These results imply that the bimodality of basal STAT1 activity inUbe1l−/−MEFs are not mediated by type I IFN or type I IFN-mediated sig-naling pathways.
Kinase inhibitors, AG490 and PF431396, abrogate bimodality of basal
STAT1 in
Ube1l
−/−MEFs
To elucidate the intracellular signaling responsible for the maintenance of bimodality of
Ube1l−/−MEF, we examined other kinases that are known to affect STAT1 activity. Therefore,
Fig 4. Bimodality inUbe1ldeficient MEF populations are not mediated by basal type I IFN signaling.(A) FACS analysis of surface H-2Kb expression on MEFs treated with a neutralizing antibody for IFNAR1 (5μg/ml) or the isotype control. (B)Left—FACS analysis of surface H-2Kb expression in MEFs transduced with the control or mouseIfnar1shRNA lentivirus.Right–Relative expression ofIfnar1mRNA normalizing withGapdhin control orIfnar1shRNA lentivirus treated MEF. (C-D)Ube1l+/+(C) andUbe1l -/-(D) were treated with 10uM of Jak Inhibitor 1 (Jak Inh 1) for 4 hours followed by additional 12 hours of IFNβ(100U/ml) treatment. Samples were harvested and measure the H-2Kb expression with FACS.
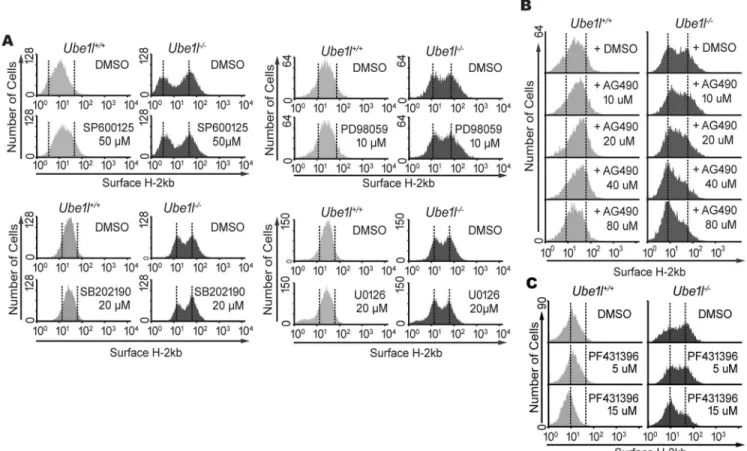
we first tested the effect of mitogen-activated protein kinases, using SP600125 (inhibitor of JNK), SP202190 (inhibitor of p38), PD98059 (inhibitor of MEK1/2), or U0126 (inhibitor of MEK1/2). However, none of these chemical inhibitors exhibited a significant change in the bimodality of basal surface H-2Kb expression inUbe1l−/−MEF (Fig 5A). In contrast, AG490, tyrosine kinase inhibitor known to inhibit epidermal growth factor receptor (EGFR), in addi-tion to JAK2, abrogated the bimodality of basal H-2Kb expression (Fig 5B). While theUbe1l+/+
cells were not significantly affected, AG490 treatment led the H-2Kbhighgroup to merge with the H-2Kblowgroup inUbe1l−/−cells. Similarly, PF431396, a kinase inhibitor known to inhibit FAK1 and PYK2, affected the population heterogeneity (Fig 5C). Upon PF431396 treatment, the H-2Kbhighsub-population shifted to the H-2Kblowgroup inUbe1l−/−MEFs.
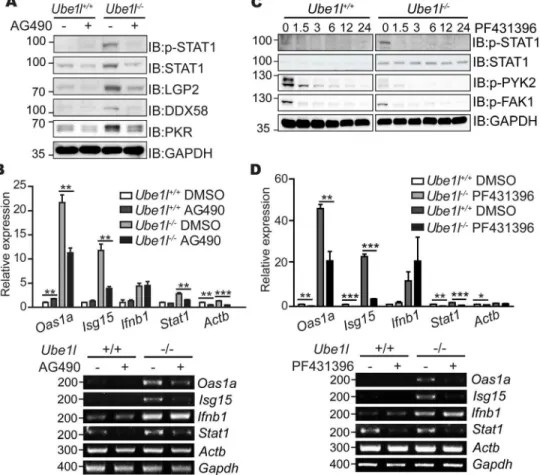
To address whether AG490-sensitive kinase activity controls the basal STAT1 activity observed inUbe1l−/−MEFs, we measured the basal phosphorylation of STAT1 (Tyr701) in Ube1l−/−-/-MEFs with the AG490 treatment (Fig 6A). Active STAT1 was strongly reduced in the AG490-treatedUbe1l−/−cells, resulting similar levels of STAT1 phosphorylation observed inUbe1l+/+. Consistent with that, the protein expressions of various anti-viral ISGs, including STAT1 itself, were significantly reduced in the same experimental samples. AG490 also signifi-cantly reduced mRNA expression of various ISGs inUbe1l−/−cells (Fig 6B). However, expres-sion ofIfnb1mRNA was not significantly altered by AG490 treatment, suggesting that STAT1 bimodality is not responsible for the type I IFN synthesis.
Fig 5. AG490 and PF431396 block the bimodality in basal surface H-2Kb expression ofUbe1ldeficient MEFs.(A)Ube1l+/+andUbe1l
-/-MEF were treated with indicated chemical inhibitor (16hour, indicated amount), and were analyzed by FACS for surface H-2Kb expression. SP600125 is JNK inhibitor, SB202190 is p38 inhibitor, and both PD98059 and U0126 are MEK1/2 inhibitors. (B) Surface H2Kb expression in MEFs treated with AG490 (16 h, indicated amount). (C) Surface H2Kb expression in MEFs treated with PF431396 (16 h, indicated amount).
Similar to AG490, PF431396-sensitive kinase also affected the basal STAT1 activity in
Ube1l−/−MEFs (Fig 6C). We measured the basal activity of STAT1 after PF431396 treatment. As the phosphorylation of FAK1 (Tyr397) and PYK2 (Tyr402) were reduced by PF431396 treatment, phosphorylated form of STAT1 was also reduced. Furthermore, FAK inhibition also lowered the expression levels of ISGs, but not ofIfnb1(Fig 6D). From these results, we con-clude that the cellular tyrosine kinases affected by AG490 and PF431396 inhibitors are respon-sible for the bimodality of basal STAT1 activity and ISG expression inUbe1l-deficient cells.
Discussion
Our data suggest that UBE1L functions to prevent population heterogeneity, which originates from the bimodal STAT1 activity. Using the ISGylation-deficientUbe1l−/−cells, we found that UBE1L suppresses basal STAT1 activity in the overall population of the cells, but also increases
Fig 6. Effect of AG490 and PF431396 inhibitor on basal STAT1 activity and ISG expression.(A) Immunoblot assay for measuring basal STAT1 activity and expression of indicated genes in MEFs treated with AG490 (50μM, 16 h). (B) Relative mRNA expression of the indicated genes were measured in MEFs treated with AG490 (50μM, 16hr). (C) Immunoblot assay for measuring basal STAT1 activity and expression of indicated genes in MEFs treated with PF431396 (10μM, indicated time). Numbers above the blot denotes treatment time in hours. (D) Relative mRNA expression of the indicated genes were measured in MEFs treated with PF431396 (15μM, 12 h). (A, C) Numbers beside blot images indicate the molecular weight (kDa). (B, D)Top–Using real-time quantitative PCR, normalizing withGapdh. Mean and standard error
obtained from three independent experiments, unpaired t test,*p<0.05,**p<0.01,***p<0.001.Bottom–
Representative agarose gel image using conventional reverse-transcription PCR. Numbers beside image indicate the size of PCR product (base pairs).
the resistance against the viral infection. During research to solve this contradiction, it was revealed thatUbe1l−/−MEFs populations consisted of two sub-populations with distinct basal STAT1 activities. This population segregation was revealed to be originated from the basal kinase activity sensitive to AG490 and PF431396, but not from the constitutive type I IFN activity present in the basal states.
In the present study, the basal signals that resulted in the bimodality of STAT1 inUbe1l−/− MEF are still elusive. Considering the result of the use of a neutralizing antibody and shRNA against type I IFN receptor, we excluded the involvement of type I IFN in this process. We also excluded the involvement of type II and type III IFNs in population segregation of theUbe1l−/− MEFs, because Jak Inhibitor 1 that is known to inhibit JAK1, JAK2, and TYK1, which are involved in IFN signaling, did not show any significant effect [28–30]. Instead, we propose that the tyrosine kinases sensitive to AG490 or PF431396 is responsible for the bimodality of STAT1 inUbe1l−/−MEFs. While AG490 targets various kinases, including JAK2, EGFR, and ERBB2 [31,32], PF431396 targets for both FAK1 and PYK2 [33], which are members of the FAK family. Based on the results acquired with the pan-JAK inhibitor (Jak Inhibitor 1), by excluding JAK2, we suspected that EGFR, ERBB2, FAK1 or Pyk2 were candidate kinases responsible for the basal STAT1 activity. The association of EGFR and FAK signaling pathway has been previously reported [34,35]. During the growth factor-induced cell migration or adhesion, EGFR is known to associate with the integrin receptors and form multi-protein sig-naling complexes [36]. Both FAK and STAT1 are reported to be found in this complex [35,37– 39]. Therefore, it is logical to consider basal growth factor or cell adhesion signaling activities as potential sources of bimodality observed inUbe1l-deficient cells.
The basal population heterogeneity that we observed inUbe1l-deficient MEFs appeared in the conventional culture method. However, in physiological circumstances, various environ-mental stresses are persistently applied to the cellular population [40,41]. These environmental factors, working as selection pressures, determine population dynamics with multiple levels of non-genetic and genetic heterogeneity [3,42–44]. Although we applied the type I IFN or chem-ical inhibitors and observed the change of population composition of MEFs, the effects of pro-longed stresses were not considered in this research. Considering the selection effect of long-term persisting stresses on the biological systems, including cancer development [3,42], further researches monitoring population dynamics upon prolonged stresses are required for identify-ing the cause and the physiological meanidentify-ing of cellular heterogeneity. In those experiments, the dynamics of population originated from genetic heterogeneity should be also considered.
heterogeneity affects host anti-viral immunity remained to be answered, our study suggests the potential roles of ISGylation on the host anti-viral response with the regulation of population heterogeneity.
Supporting Information
S1 Table. Oligonucleotide used for real-time quantitative PCR and conventional RT PCR.
(DOCX)
S2 Table. Antibodies used for immunoblot assay.
(DOCX)
Author Contributions
Conceived and designed the experiments: HN J-YY. Performed the experiments: HN. Analyzed the data: HN J-YY. Wrote the paper: HN J-YY.
References
1. Seehausen O, Butlin RK, Keller I, Wagner CE, Boughman JW, Hohenlohe PA, et al. Genomics and the origin of species. Nature reviews Genetics. 2014; 15(3):176–92. doi:10.1038/nrg3644PMID:
24535286.
2. Burrell RA, McGranahan N, Bartek J, Swanton C. The causes and consequences of genetic heteroge-neity in cancer evolution. Nature. 2013; 501(7467):338–45. doi:10.1038/nature12625PMID:
24048066.
3. Heng HH, Bremer SW, Stevens JB, Ye KJ, Liu G, Ye CJ. Genetic and epigenetic heterogeneity in can-cer: a genome-centric perspective. Journal of cellular physiology. 2009; 220(3):538–47. doi:10.1002/
jcp.21799PMID:19441078.
4. Hemberger M, Dean W, Reik W. Epigenetic dynamics of stem cells and cell lineage commitment: dig-ging Waddington's canal. Nature reviews Molecular cell biology. 2009; 10(8):526–37. doi:10.1038/
nrm2727PMID:19603040.
5. Kaern M, Elston TC, Blake WJ, Collins JJ. Stochasticity in gene expression: from theories to pheno-types. Nature reviews Genetics. 2005; 6(6):451–64. doi:10.1038/nrg1615PMID:15883588. 6. Kussell E, Leibler S. Phenotypic diversity, population growth, and information in fluctuating
environ-ments. Science. 2005; 309(5743):2075–8. doi:10.1126/science.1114383PMID:16123265.
7. Overton KW, Spencer SL, Noderer WL, Meyer T, Wang CL. Basal p21 controls population heterogene-ity in cycling and quiescent cell cycle states. Proceedings of the National Academy of Sciences of the United States of America. 2014; 111(41):E4386–93. doi:10.1073/pnas.1409797111PMID:25267623;
PubMed Central PMCID: PMC4205626.
8. Buettner F, Natarajan KN, Casale FP, Proserpio V, Scialdone A, Theis FJ, et al. Computational analysis of cell-to-cell heterogeneity in single-cell RNA-sequencing data reveals hidden subpopulations of cells. Nature biotechnology. 2015; 33(2):155–60. doi:10.1038/nbt.3102PMID:25599176.
9. Wilson A, Laurenti E, Oser G, van der Wath RC, Blanco-Bose W, Jaworski M, et al. Hematopoietic stem cells reversibly switch from dormancy to self-renewal during homeostasis and repair. Cell. 2008; 135(6):1118–29. doi:10.1016/j.cell.2008.10.048PMID:19062086.
10. Balaban NQ, Merrin J, Chait R, Kowalik L, Leibler S. Bacterial persistence as a phenotypic switch. Sci-ence. 2004; 305(5690):1622–5. doi:10.1126/science.1099390PMID:15308767.
11. Gascoigne KE, Taylor SS. Cancer cells display profound intra- and interline variation following pro-longed exposure to antimitotic drugs. Cancer cell. 2008; 14(2):111–22. doi:10.1016/j.ccr.2008.07.002
PMID:18656424.
12. Weinberger LS, Burnett JC, Toettcher JE, Arkin AP, Schaffer DV. Stochastic gene expression in a lenti-viral positive-feedback loop: HIV-1 Tat fluctuations drive phenotypic diversity. Cell. 2005; 122(2):169–
82. doi:10.1016/j.cell.2005.06.006PMID:16051143.
13. Snijder B, Sacher R, Ramo P, Damm EM, Liberali P, Pelkmans L. Population context determines cell-to-cell variability in endocytosis and virus infection. Nature. 2009; 461(7263):520–3. doi:10.1038/
nature08282PMID:19710653.
14. Stetson DB, Medzhitov R. Type I interferons in host defense. Immunity. 2006; 25(3):373–81. doi:10.
15. Schneider WM, Chevillotte MD, Rice CM. Interferon-stimulated genes: a complex web of host defenses. Annual review of immunology. 2014; 32:513–45. doi:
10.1146/annurev-immunol-032713-120231PMID:24555472; PubMed Central PMCID: PMC4313732.
16. Zawatzky R, De Maeyer E, De Maeyer-Guignard J. Identification of individual interferon-producing cells by in situ hybridization. Proceedings of the National Academy of Sciences of the United States of Amer-ica. 1985; 82(4):1136–40. PMID:3856251; PubMed Central PMCID: PMC397209.
17. Zhao M, Zhang J, Phatnani H, Scheu S, Maniatis T. Stochastic expression of the interferon-beta gene. PLoS biology. 2012; 10(1):e1001249. doi:10.1371/journal.pbio.1001249PMID:22291574; PubMed Central PMCID: PMC3265471.
18. Hwang SY, Hur KY, Kim JR, Cho KH, Kim SH, Yoo JY. Biphasic RLR-IFN-beta response controls the balance between antiviral immunity and cell damage. Journal of immunology. 2013; 190(3):1192–200.
doi:10.4049/jimmunol.1202326PMID:23284052.
19. Zhang D, Zhang DE. Interferon-stimulated gene 15 and the protein ISGylation system. Journal of inter-feron & cytokine research: the official journal of the International Society for Interinter-feron and Cytokine Research. 2011; 31(1):119–30. doi:10.1089/jir.2010.0110PMID:21190487; PubMed Central PMCID:
PMC3021351.
20. Kim KI, Yan M, Malakhova O, Luo JK, Shen MF, Zou W, et al. Ube1L and protein ISGylation are not essential for alpha/beta interferon signaling. Molecular and cellular biology. 2006; 26(2):472–9. doi:10.
1128/MCB.26.2.472-479.2006PMID:16382139; PubMed Central PMCID: PMC1346917.
21. Lai C, Struckhoff JJ, Schneider J, Martinez-Sobrido L, Wolff T, Garcia-Sastre A, et al. Mice lacking the ISG15 E1 enzyme UbE1L demonstrate increased susceptibility to both mouse-adapted and non-mouse-adapted influenza B virus infection. Journal of virology. 2009; 83(2):1147–51. doi:10.1128/JVI.
00105-08PMID:19004958; PubMed Central PMCID: PMC2612374.
22. Lenschow DJ, Lai C, Frias-Staheli N, Giannakopoulos NV, Lutz A, Wolff T, et al. IFN-stimulated gene 15 functions as a critical antiviral molecule against influenza, herpes, and Sindbis viruses. Proceedings of the National Academy of Sciences of the United States of America. 2007; 104(4):1371–6. doi:10.
1073/pnas.0607038104PMID:17227866; PubMed Central PMCID: PMC1783119.
23. Zhao C, Denison C, Huibregtse JM, Gygi S, Krug RM. Human ISG15 conjugation targets both IFN-induced and constitutively expressed proteins functioning in diverse cellular pathways. Proceedings of the National Academy of Sciences of the United States of America. 2005; 102(29):10200–5. doi:10.
1073/pnas.0504754102PMID:16009940; PubMed Central PMCID: PMC1177427.
24. Giannakopoulos NV, Luo JK, Papov V, Zou W, Lenschow DJ, Jacobs BS, et al. Proteomic identification of proteins conjugated to ISG15 in mouse and human cells. Biochemical and biophysical research com-munications. 2005; 336(2):496–506. doi:10.1016/j.bbrc.2005.08.132PMID:16139798.
25. Kim KI, Giannakopoulos NV, Virgin HW, Zhang DE. Interferon-inducible ubiquitin E2, Ubc8, is a conju-gating enzyme for protein ISGylation. Molecular and cellular biology. 2004; 24(21):9592–600. doi:10.
1128/Mcb.24.21.9592-9600.2004WOS:000224943300030. PMID:15485925
26. Yoo HS, Choi Y, Ahn N, Lee S, Kim WU, Jang MS, et al. Transcriptional regulator CTR9 inhibits Th17 differentiation via repression of IL-17 expression. Journal of immunology. 2014; 192(4):1440–8. doi:10.
4049/jimmunol.1201952PMID:24420920.
27. York IA, Rock KL. Antigen processing and presentation by the class I major histocompatibility complex. Annual review of immunology. 1996; 14:369–96. doi:10.1146/annurev.immunol.14.1.369PMID:
8717519.
28. Thompson JE, Cubbon RM, Cummings RT, Wicker LS, Frankshun R, Cunningham BR, et al. Photo-chemical preparation of a pyridone containing tetracycle: a Jak protein kinase inhibitor. Bioorganic & medicinal chemistry letters. 2002; 12(8):1219–23. PMID:11934592.
29. Platanias LC. Mechanisms of type-I- and type-II-interferon-mediated signalling. Nature reviews Immu-nology. 2005; 5(5):375–86. doi:10.1038/nri1604PMID:15864272.
30. Wack A, Terczynska-Dyla E, Hartmann R. Guarding the frontiers: the biology of type III interferons. Nature immunology. 2015; 16(8):802–9. doi:10.1038/ni.3212PMID:26194286.
31. Gazit A, Osherov N, Posner I, Yaish P, Poradosu E, Gilon C, et al. Tyrphostins. 2. Heterocyclic and alpha-substituted benzylidenemalononitrile tyrphostins as potent inhibitors of EGF receptor and ErbB2/ neu tyrosine kinases. Journal of medicinal chemistry. 1991; 34(6):1896–907. PMID:1676428. 32. Meydan N, Grunberger T, Dadi H, Shahar M, Arpaia E, Lapidot Z, et al. Inhibition of acute lymphoblastic
leukaemia by a Jak-2 inhibitor. Nature. 1996; 379(6566):645–8. doi:10.1038/379645a0PMID:
8628398.
33. Han S, Mistry A, Chang JS, Cunningham D, Griffor M, Bonnette PC, et al. Structural characterization of proline-rich tyrosine kinase 2 (PYK2) reveals a unique (DFG-out) conformation and enables inhibitor design. The Journal of biological chemistry. 2009; 284(19):13193–201. doi:10.1074/jbc.M809038200
34. Sieg DJ, Hauck CR, Ilic D, Klingbeil CK, Schaefer E, Damsky CH, et al. FAK integrates growth-factor and integrin signals to promote cell migration. Nature cell biology. 2000; 2(5):249–56. doi:10.1038/
35010517PMID:10806474.
35. Long W, Yi P, Amazit L, LaMarca HL, Ashcroft F, Kumar R, et al. SRC-3Delta4 mediates the interaction of EGFR with FAK to promote cell migration. Molecular cell. 2010; 37(3):321–32. doi:10.1016/j.molcel.
2010.01.004PMID:20159552; PubMed Central PMCID: PMC2824333.
36. Mitra SK, Schlaepfer DD. Integrin-regulated FAK-Src signaling in normal and cancer cells. Current opinion in cell biology. 2006; 18(5):516–23. doi:10.1016/j.ceb.2006.08.011PMID:16919435. 37. Xia L, Wang LJ, Chung AS, Ivanov SS, Ling MY, Dragoi AM, et al. Identification of both positive and
negative domains within the epidermal growth factor receptor COOH-terminal region for signal trans-ducer and activator of transcription (STAT) activation. J Biol Chem. 2002; 277(34):30716–23. doi:10.
1074/jbc.M202823200WOS:000177579800041. PMID:12070153
38. Mitra SK, Hanson DA, Schlaepfer DD. Focal adhesion kinase: in command and control of cell motility. Nature reviews Molecular cell biology. 2005; 6(1):56–68. doi:10.1038/nrm1549PMID:15688067. 39. Xie B, Zhao J, Kitagawa M, Durbin J, Madri JA, Guan JL, et al. Focal adhesion kinase activates Stat1 in
integrin-mediated cell migration and adhesion. The Journal of biological chemistry. 2001; 276 (22):19512–23. doi:10.1074/jbc.M009063200PMID:11278462.
40. Kourtis N, Tavernarakis N. Cellular stress response pathways and ageing: intricate molecular relation-ships. The EMBO journal. 2011; 30(13):2520–31. doi:10.1038/emboj.2011.162PMID:21587205;
PubMed Central PMCID: PMC3155297.
41. Campisi J. Aging, cellular senescence, and cancer. Annual review of physiology. 2013; 75:685–705.
doi:10.1146/annurev-physiol-030212-183653PMID:23140366; PubMed Central PMCID: PMC4166529.
42. Heng HH, Stevens JB, Liu G, Bremer SW, Ye KJ, Reddy PV, et al. Stochastic cancer progression driven by non-clonal chromosome aberrations. Journal of cellular physiology. 2006; 208(2):461–72.
doi:10.1002/jcp.20685PMID:16688757.
43. Nevo E. Evolution of genome-phenome diversity under environmental stress. Proceedings of the National Academy of Sciences of the United States of America. 2001; 98(11):6233–40. doi:10.1073/
pnas.101109298PMID:11371642; PubMed Central PMCID: PMC33451.
44. Skinner MK. Environmental stress and epigenetic transgenerational inheritance. BMC medicine. 2014; 12:153. doi:10.1186/s12916-014-0153-yPMID:25259699; PubMed Central PMCID: PMC4244059.
45. Kingsolver JG, Pfennig DW. Patterns and power of phenotypic selection in nature. Bioscience. 2007; 57(7):561–72. doi:10.1641/B570706WOS:000248201700006.
46. Martin RA, Pfennig DW. Widespread disruptive selection in the wild is associated with intense resource competition. Bmc Evol Biol. 2012; 12. Artn 136 doi:10.1186/1471-2148-12-136
WOS:000308332300001.
47. Bolnick DI. Can intraspecific competition drive disruptive selection? An experimental test in natural pop-ulations of sticklebacks. Evolution. 2004; 58(3):608–18. doi:10.1111/j.0014-3820.2004.tb01683.x
WOS:000220704800015. PMID:15119444
48. Chapman A, Fernandez del Ama L, Ferguson J, Kamarashev J, Wellbrock C, Hurlstone A. Heteroge-neous tumor subpopulations cooperate to drive invasion. Cell reports. 2014; 8(3):688–95. doi:10.1016/