Genetic Linkage Map of
Phaseolus vulgaris
and Identification
of QTLs Responsible for Resistance to X
anthomonas
axonopodis
pv. p
haseoli
*Amaury S. Santos
1, Ricardo E. Bressan-Smith
2, Messias G. Pereira
2,
Rosana Rodrigues
2& Claudia F. Ferreira
31Instituto Biológico, Cx Postal 70, Campinas, SP, CEP 13001-970, tel. (19) 3252 1657, e-mail: amaury@biologico.br;
2Laboratório de Melhoramento Genético Vegetal, Universidade Estadual do Norte Fluminense, Av. Alberto Lamego, 2000,
Campos dos Goytacazes, RJ, CEP 28015-620, e-mail: brsmith@uenf.br; 3Embrapa Mandioca e Fruticultura, Cx. Postal 007, CEP44380-000, Cruz das Almas, BA
(Accepted for publication on 03/01/2003)
Corresponding author: Amaury da Silva dos Santos
SANTOS, A.S., BRESSAN-SMITH, R.E., PEREIRA, M.G., RODRIGUES, R. & FERREIRA, C.F. Genetic linkage map of Phaseolus vulgaris and identification of QTL responsible for resistance to Xanthomonas axonopodis pv. phaseoli. Fitopatologia Brasileira 28:005-010. 2003.
ABSTRACT
Common bean (Phaseolus vulgaris) cultivars with a high degree of resistance to Xanthomonas axonopodis pv. phaseoli (Xap) are not available in Brazil. Despite many studies, a low degree of resistance to Xap continues to exist due to its complex genetic inheritance, which is not well known. The objectives of this research were to complement a common bean genetic map based on the cross between a susceptible genotype ‘HAB-52’ and a resistant genotype ‘BAC-6’, and to map and analyze genomic regions (quantitative trait loci – QTLs) related to Xap resistance. Eleven linkage groups were determined using 143 RAPD markers, covering 1,234.5 cM of the genome. This map was used to detect QTLs associated with Xap
resistance on leaves and pods. The averages of disease severity on leaves (represented by the transformed disease index – TDI) and pods (represented by the diameter of lesion on pods – DLP) were added to the data of the linkage map. Five TDI QTLs and only one LDP QTL were detected. The TDI QTLs were placed in the A, B, G and J linkage groups, with phenotypic variations ranging from 12.7 to 71.6%. The DLP QTL explained 12.9% of the phenotypic variation and was mapped in a distinct linkage group. These results indicate that there are different genes involved in the control of resistance on leaves and pods.
Additional key words: common bean, quantitative trait loci, common bacterial blight, disease resistance.
RESUMO
Mapa genético de ligação de Phaseolus vulgaris e identificação de QTLs responsáveis pela resistência à Xanthomonas axonopodis pv. phaseoli
Não há disponibilidade de cultivares comerciais de feijoeiro (Phaseolus vulgaris) com alto nível de resistência à Xanthomonas axonopodis pv. phaseoli (Xap) no Brasil. Isto se deve à complexa herança de resistência que, apesar dos diversos estudos efetuados, ainda não foi completamente elucidada. Os objetivos deste trabalho foram complementar um mapa genético do feijoeiro, construído com base no cruzamento entre um genótipo susceptível ‘HAB-52’ e um genótipo resistente ‘BAC-6’ e mapear e analisar regiões genômicas (QTLs) relacionadas com a resistência à Xap. Onze grupos de ligação
foram identificados, por meio de 143 marcadores RAPD, cobrindo 1234,5 cM do genoma. Este mapa foi usado para detectar QTLs associados à resistência em folhas e em vagens a Xap. As médias de severidade de doenças em folhas e em vagens, representadas pelo índice de doença transformado (IDT) e pelo diâmetro de lesão em vagens (DLV), respectivamente, foram adicionados aos dados do mapa de ligação. Detectaram-se cinco QTLs para IDT e um para DLV. Os QTLs para IDT localizaram-se nos grupos de ligação A, B, G e J, com variância fenotípica variando de 12,7 a 71,6%. O QTL identificado para DLV, com variância fenotípica de 12,9%, localizou-se num grupo de ligação distinto, indicando que a reação de resistência em folhas e vagens é controlada por diferentes genes.
INTRODUCTION
Brazil is the world’s largest producer of common bean and snap bean (Phaseolus vulgaris L.). Bean cultivation is also socially important because it is mainly carried out by
small farmers. The level of crop technology used is often low, because farming is at the subsistence level where use of fertilizers and pesticides is rare. Diseases are important factors that interfere with bean yield. Bean common bacterial blight (CBB) caused by Xanthomonas axonopodis pv. phaseoli (Smith 1897) Vauterin, Hoste, Kersters & Swings 1995 (Young et al., 1996) (Xap), is the main bacterial disease * Part of the D.S. Thesis of the first author. North Fluminense State University
affecting both the common bean and the snap bean in Brazil. Based on the social and economic implications of bean cultivars, adoption of resistant cultivars would be the simplest, most promising, most economically effective and ecologically sustainable method of disease control, especially when combined with the use of healthy seeds and crop practices that prevent the establishment of pathogens in the field.
Breeding cultivars for Xap resistance has proved difficult because of the influence of several factors on the complex interaction between bean and this bacterial pathogen. Several authors have reported that common bean resistance to Xap is genetically complex (Pompeu & Crowder, 1972; Valladares-Sanches et al., 1979). In the past, classic quantitative genetics was the recommended tool for dealing with complex disease resistance traits. However, classic quantitative genetics is unsuitable for dissecting polygenic resistance in discrete genetic loci or in defining the function of individual genes responsive to disease resistance (Young, 1996). An adequate methodology for studying complex and polygenic forms of resistance to disease is known as QTLs (Quantitative trait loci) mapping, which is based on the use of DNA markers (Young, 1996).
The present study was carried out to identify QTLs associated with resistance to Xap through the construction of a genetic linkage map obtained by DNA markers and through the phenotypic analysis of the resistance in plants in the ongoing bean breeding program at the North Fluminense State University, Campos dos Goytacazes, RJ.
MATERIALS AND METHODS
The genotypes used in the present study are derived from the cross between ‘HAB-52’ (susceptible to Xap) and ‘BAC-6’ (resistant to Xap) carried out by Rodrigues (1997). The F1 generation was obtained and the plants selfed to produce the F2 generation, which were then selfed to produce the F3 families. A total of 88 F2 plants were used to construct the genetic linkage map and their F3 families were used to obtain the phenotypic data (resistance to Xap).
The genomic DNA was isolated according to the method described by Skroch & Neinhuis (1995) with modifications. The DNA was purified with RNAse (10 mg/ ml) and its concentration assessed in a SPEKOL/SEISS UV-VIS spectrophotometer (Zeiss, Germany) at 260 nm. The amplifications were made with previously selected polymorphic primers. The amplification procedure used was one minute at 95 °C for initial denaturation, followed by 40 cycles, each cycle consisting of denaturation stages (1 min at 94 °C), primer annealing (1 min at 36 °C) and primer extension (2 min at 72 °C). After 40 cycles, there was a 7 min cycle at 72 °C for final extension. The electrophoresis conditions were 1.6% agarose gel in a horizontal electrophoresis cube submitted to 110 V for 3 h. After electrophoresis, the gel was bathed in ethidium bromide (0.5
µl/ml) and photodocumented in the Eagle Eye II system (Stratagene, USA) under ultraviolet light. The primers that
showed at least three polymorphic bands were used for the linkage map construction.
The linkage analysis was carried out by the MAPMAKER/EXP software (Lander et al., 1987) using 143 RAPD loci and four morphological markers (position of the tip of the flower, flower color, leaf surface and growth habit) recorded from 88 plants of the F2 population. The genotypes in the loci containing dominant alleles were standardized as follows: a) when the band came from ‘HAB-52’ (there was no band in ‘BAC-6’) the compositions were D and B for presence or absence, respectively; b) when the band came from ‘BAC-6’ (there was no band in ‘HAB-52’) the compositions were C and A for presence and absence, respectively. The segregation of each marker was tested for possible deviations from the 3:1 ratio between loci DB and CA (RAPD is dominant) by the chi-square test (χ2).
After an artificial inoculation in the field with the bacterium in the leaves (the leaf was cut with scissors) and pods (perforated with hypodermic needle), the 88 F3 families were scored for disease index (DI) on a scale from 1.0 to 5.0 and for maximum diameter of lesion on pods (DLP). The DI was transformed mathematically into arc-sin ( ) equation to obtain the transformed disease index (TDI). The TDI and DLP means were then added to the linkage map for QTL detection.
The interval mapping (Lander & Botstein, 1989) was performed by the MAPMAKER/QTL 1.1 software (Paterson et al., 1988) calculating and compiling the LOD scores at each 2 cM of the map. For each QTL identified, the MAPMAKER/QTL calculated the interval of confidence around the peak indicating the regions where the probability of significance is ten-fold smaller than the most probable position (Paterson et al., 1991b).
RESULTS AND DISCUSSION
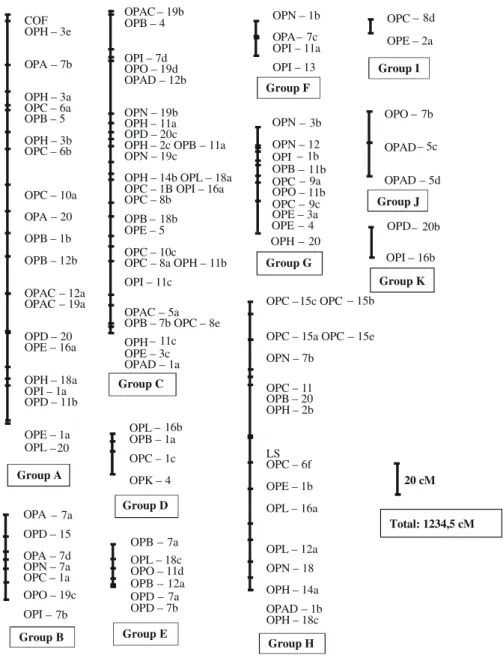
One hundred and four of the 143 polymorphic RAPD markers detected were mapped in 11 linkage groups (Figure 1). The linkage map reported in the present study spanned 1,234.5 cM with a mean interval of 11.87 cM (Table 1). Other available maps are those of Jung et al. (1996) with 545 cM distributed in eight groups with a mean interval of 6.9 cM; Nodari et al. (1993) with 827 cM and a mean interval of 6.5 cM; Vallejos et al. (1992) with 963 cM and a mean interval of 3.95 cM; Freyre et al. (1998) with 1,226 cM and a mean interval of 2.17 cM; and Ariyarathne et al. (1999) with 755 cM distributed in 11 linkage groups with a mean interval of 4.33 cM.
The expected number of linkage groups is 11, which corresponds to the haploid number of chromosomes of P. vulgaris. This agrees with the result obtained in the present study. Differences in the number of linkage groups are reported in practically all the linkage maps published on this species. Freyre et al. (1998) worked with a map in common bean spanning 1,226 cM using morphological, isoenzymatic, RFLP and RAPD markers. The size of the map reached by these
authors is very close to the estimated value of 1,200 cM by Vallejos et al. (1992). On the other hand, Boscariol et al. (1998) used three types of markers (RFLP, RAPD and SCAR) that covered only 820.8 cM. The discrepancies observed in common bean maps constructed by using different types of markers (RFLP, RAPD, SCAR, AFLP, isoenzymes, morphological, etc.) indicate that the genome is still not completely saturated with marker loci (Boscariol et al., 1998). A high proportion of segregation distortion was obtained in this study (Table 1). Indeed, many studies have shown this tendency (Jung et al., 1996; Jung et al., 1997; Freyre et al., 1998; Ariyarathne et al., 1999). However, Nodari et al.
(1993) and Vallejos et al. (1992) reported low segregation distortion by using RFLP based maps. As RAPD based maps usually generate high segregation distortion, this could have resulted from non-random distribution in the genetic map, occurrence of genetic drift, natural selection, presence of incompatibility in a specific genomic region, occurrence of problems in the gametogenesis, or seed development and plant growth (Jung et al., 1997).
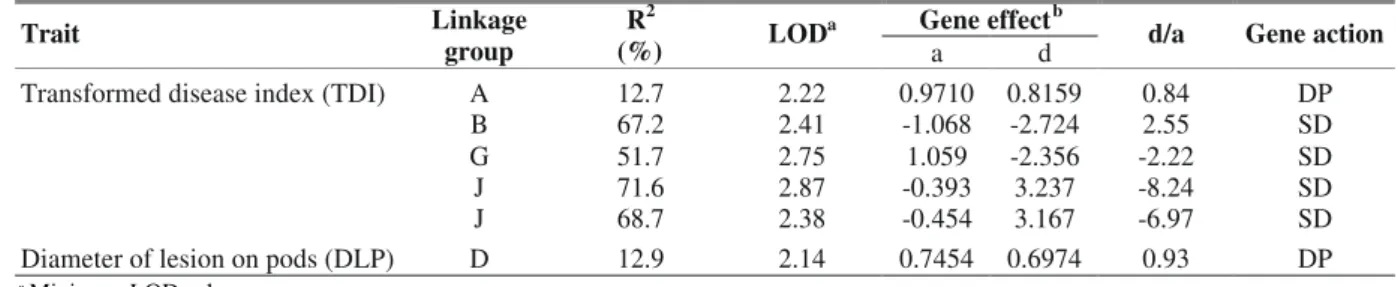
According to the localization of the QTLs and the description of their effects affecting the resistance trait to Xap (Table 2), the QTLs for the two resistance traits assessed (transformed disease index and pod lesion diameter) were COF
OPH – 3e
OPA – 7b
OPH – 3a OPC – 6a OPB – 5
OPH – 3b OPC – 6b
OPC – 10a
OPA – 20
OPB – 1b
OPB – 12b
OPAC – 12a OPAC – 19a
OPD – 20 OPE – 16a
OPH – 18a OPI – 1a OPD – 11b
OPE – 1a OPL – 20
OPAC – 19b OPB – 4
OPI – 7d OPO – 19d OPAD – 12b
OPN – 19b OPH – 11a OPD – 20c OPH – 2c OPB – 11a OPN – 19c
OPH – 14b OPL – 18a OPC – 1B OPI – 16a OPC – 8b
OPB – 18b OPE – 5
OPC – 10c
OPC – 8a OPH – 11b
OPI – 11c
OPAC – 5a OPB – 7b OPC – 8e
OPH – 11c OPE – 3c OPAD – 1a
OPN – 1b
OPA – 7c OPI – 11a
OPI – 13
OPN – 3b
OPN – 12 OPI – 1b OPB – 11b OPC – 9a OPO – 11b OPC – 9c OPE – 3a OPE – 4 OPH – 20
OPC – 8d
OPE – 2a
OPO – 7b
OPAD – 5c
OPAD – 5d
OPC – 15c OPC –15b
OPC – 15a OPC – 15e
OPN – 7b
OPC – 11 OPB – 20 OPH – 2b
LS OPC – 6f
OPE – 1b
OPL – 16a
OPL – 12a
OPN – 18
OPH – 14a
OPAD – 1b OPH – 18c
OPD –20b
OPI – 16b
20 cM OPL – 16b
OPB – 1a
OPC – 1c
OPK – 4
OPA – 7a OPD – 15
OPA – 7d OPN – 7a OPC – 1a OPO – 19c
OPI – 7b
OPB – 7a OPL – 18c OPO – 11d OPB – 12a OPD – 7a OPD – 7b Group A Group B Group C Group D Group E Group H Group G Group K Group J Group F Group I
Total: 1234,5 cM
identified: five for TDI and one for DLP. Of the five QTLs detected for TDI, three were located in a different linkage group. The two QTLs found in the J linkage group are at a shorter distance than 50 cM and are, therefore, probably linked.
The QTL detected in DLP is found in a different linkage group from those found in TDI. This result indicates the absence of relationship between the resistance reactions to Xap in leaves and pods, which is in agreement with the Pearson correlation analyses where a very low correlation of DLP with TDI was observed (0.100). The existence of Xap resistant genes specific for determined plant organs controlling resistance in leaves and pods has been suggested by several authors based on different reactions to Xap isolates. Jung et al. (1997) studied two Xap isolates and observed that there was a smaller correlation among the reactions to Xap in leaves, pods and seeds for one isolate than for the other isolate. This suggests the presence of significant specific interaction effects between isolate and plant organ. Ariyarathne et al. (1999), however, reported the existence of
a common gene or a gene cluster controlling the resistance reaction in leaves and pods. Hypotheses suggesting few genes controlling resistance to Xap infection on common bean leaves and pods have been presented in several independent studies (Valladares-Sanches et al., 1979; Arnaud-Santana et al., 1994).
The comparison of the direction of the QTLs responses (Table 2) shows that both parents contribute with favorable alleles to increase the resistance of their progenies. It was found for TDI that out of five declared QTLs, three received favorable alleles from ‘BAC-6’ and others from ‘HAB-52’. The contribution of the susceptible parent for higher resistance was also detected by Boscariol et al. (1998). These are called cryptic genetic effects that is, phenotypic effects of alleles stemming from the susceptible parent. The cryptic effects that run contrary to what is expected are commonly reported in the literature (Young, 1996).
The genetic action of partial dominance for DLP is in line with the result obtained by Pompeu & Crowder (1972), who determined that Xap resistance is expressed by few genes
Linkage group Number of markers Genetic distance a Average distance b Segregation distortion c
A 21 357.7 17.03 1
B 7 76.9 10.98 1
C 28 277.5 9.91 10
D 4 33.7 8.42 2
E 6 32.3 5.38 0
F 4 35.6 8.91 0
G 10 87.5 8.75 4
H 17 238.6 14.03 0
I 2 9.6 4.80 0
J 3 56.7 18.90 0
K 2 28.4 14.20 1
Mapped markers 104 1234.5 11.87 19
Unmapped markers 39 13
Total 143 32
TABLE 1 - Description of the Phaseolus vulgaris linkage map consisting of 102 RAPD markers and two morphological markers segregating in the F2 population from the cross between ‘HAB-52’ and ‘BAC-6’
a Distance on the map in cM
b Average distance (cM) between adjacent markers
c Number of markers deviating from the expected segregation ratio 3:1 (p < 0.05) -mapped markers (22.37%) and unmapped markers
(18.27%).
Gene effectb
Trait Linkage
group
R2
(%) LOD
a
a d d/a Gene action
Transformed disease index (TDI) A 12.7 2.22 0.9710 0.8159 0.84 DP
B 67.2 2.41 -1.068 -2.724 2.55 SD
G 51.7 2.75 1.059 -2.356 -2.22 SD
J 71.6 2.87 -0.393 3.237 -8.24 SD
J 68.7 2.38 -0.454 3.167 -6.97 SD
Diameter of lesion on pods (DLP) D 12.9 2.14 0.7454 0.6974 0.93 DP
TABLE 2 - Location, effect and action of QTLs affecting common beanXanthomonas axonopodis pv. phaseoli
resistance traits in bean (Phaseolus vulgaris)(transformed disease index – TDI and diameter of lesion on pods - DLP)
a Minimum LOD value
b Additive effects are associated with the ‘BAC-6’ allele. The negative sign indicates that the allele from ‘BAC-6’ decreases the mean value of the trait,
showing a partial dominance mean effect. It is possible that the detected QTL for DLP expresses a large main effect while others, showing smaller effects may have not been detected in this analysis. Eskridge & Coyne (1996) estimated at 5.2 and 1.1 the number of genes involved in leaf and pod resistance, respectively, in progenies derived from the XAN-159 x PC-50 cross. Jung et al. (1997) worked with recombinant lines derived from ‘XAN-159’ and ‘PC-50’ and detected one QTL strongly associated with resistance to Xap in leaves and others with smaller effects, thus confirming the hypothesis of Eskridge & Coyne (1996).
The use of new types of markers (AFLP, for example) and the trial of the genotypes in advanced generations may optimize a larger coverage by the map, facilitate the detection of new QTLs associated with resistance to Xap and also with other agronomically important quantitative traits. Many studies have indicated variation in the quantitative traits due to their sensitivity to environmental effects and to the genetic background of the genotypes used. Studies on tomatoes (Lycopersicon esculentum Mill) indicate that not all QTLs are detected in all the environments, but a few QTLs are always expressed regardless of the environmental conditions (Paterson et al., 1991a). Thus, the assessment of QTLs in several populations and environments should be essential to confirm the use of QTLs in future genetic breeding programs. Until now, two studies in the literature have reported the confirmation of QTLs in different environments and populations (Jung et al., 1999; Park et al., 1999).
All markers associated with resistance reaction in leaves and pods detected in the present research should be studied in advanced generations, using several loci and different Xap isolates and, in the future, tested on other populations with different genetic backgrounds prior to the use in selection by DNA markers. This will ensure efficiency in common bean genetic breeding programs for resistance to X. axonopodis pv. phaseoli.
ACKNOWLEDGEMENTS
We are indebted to the following people who have supported this work: Ernane R. Martins, Lourdes M. Figueiredo and Vitoria Régia de Melo. This work received financial support from “Fundação Estadual do Norte Fluminense” (FENORTE).
LITERATURE CITED
ARIYARATHNE, H.M., COYNE, D.P., JUNG, G., SKROCH, P.W., VIDAVER, A.K., STEADMAN, J.R., MIKLAS, P.N. & BASSET, M.J. Molecular mapping of disease resistance genes for halo blight, and bean common mosaic virus in a segregating population of common bean. Journal of the American Society for Horticultural Science 124:654-662. 1999.
ARNAUD-SANTANA, E., COYNE, D.P., ESKRIDGE, K.M. & VIDAVER, A.K. Inheritance, low correlations of leaf, pod, and seed reactions to common blight disease in common beans, and implications for selection. Journal of the American Society for the
Horticultural Science 119:116-121. 1994.
BOSCARIOL, R.L., SOUZA, A.A., TSAI, S.M. & CAMARGO, L.E.A. Mapeamento de regiões genômicas associadas à resistência a dois isolados de Xanthomonas axonopodis pv. phaseoli em feijoeiro. Fitopatologia Brasileira 23:132-138. 1998.
ESKRIDGE, K.M. & COYNE, D.P. Estimating and testing hypothesis about the number of genes using inbred-backcross data. Heredity 87:410-412. 1996.
FREYRE, R., SKOCH, P.W., ADAM-BLONDOM, A.F., GEFFROY, V., SHIRMOHAMADALI, A., JOHNSON, W.C., LLACA, V., NODARI, R.O., PEREIRA, P.A., TSAI, S.M., TOHME, J., DRON, M., NIENHUIS, J. & GEPTS, P. Towards on integrated linkage map in common bean IV: Correlations among RFLP maps. Theoretical and Applied Genetics 97:834-846. 1998.
JUNG, G., COYNE, D.P., SKROCH, P.W., NIENHUIS, J., ARNAUD-SANTANA, E., BOKOSI, J., ARIYARATHNE, H.M., STEADMAN, J.R., BEAVER, J.S. & KAEPPLER, S.M. Molecular markers associated with plant architecture and resistance to common blight, web blight, and rust in common beans. Journal of the American Society for Horticultural Science 121:794-803. 1996.
JUNG, G., SKROCH, P.W., NIENHUIS, J., COYNE, D.P., ARNAUD-SANTANA, E., ARIYARATHNE, H.M. & MARITA, J.M. Confirmation of QTL associated with common bacterial blight resistance in four different genetic backgrounds in common bean. Crop Science 39:1448-1455. 1999.
JUNG, G., SKROCH, P.W., COYNE, D.P., NIENHUIS, J., ARNAUD-SANTANA, E., ARIYARATHNE, KAEPPLER, S.M & BASSET, M.J. Molecular-marker-based genetic analysis of tepary bean-derived common bacterial blight resistance in different developmental stages of common bean. Journal of the American Society for Horticultural Science 122:329-337. 1997.
LANDER, E.S., GREEN, P., ABRAHANSON J., BARLOW, A., DALY, M.J., LINCOLN, S.E. & NEWBURG, L. Mapmaker: An interactive computer package for constructing primary genetic linkage maps of experimental and natural populations. Genomics 1:174-181. 1987.
LANDER; E.S. & BOTSTEIN, D. Mapping mendelian factors underlying quantitative traits using RFLP linkage maps. Genetics 121:185-199. 1989.
NODARI, R.O., TSAI, S.M., GILBERTSON, R.L. & GEPTS, P. Toward an integrated linkage map of common bean II. Development of an RFLP-based linkage map. Theoretical and Applied Genetics 85:513-520. 1993.
PARK, S.O., COYNE, D.P., MUTLU, N., JUNG, G. & STEADMAN, J.R. Confirmation of molecular markers and flower color associated with QTL for resistance to common bacterial blight in common beans. Journal of the American Society for Horticultural Science 124:519-526. 1999.
PATERSON, A.H., TANKSLEY, S.D. & SORRELS, M.E. DNA markers in plant improvement. Advanced Agronomy 46:39-90. 1991a.
PATERSON, A.H., DAMN, S., HAD, J.D., ZAMIR, D., RABINOWITCH, H.D., LINCOHN, S.E., LANDER, E. & TANKSLEY, S.D. Mendelian factors underlying quantitative traits in tomato: comparison across species, generations, and environments. Genetics 127:181-197. 1991b.
traits into mendelian factors by using a complete linkage map of restriction fragment lenght polymorphisms. Nature 335:7231-726. 1988.
POMPEU, A.S. & CROWDER, L.V. Inheritance of resistance of Phaseolus vulgaris L. (dry beans) to Xanthomonas phaseoli (common blight). Ciência e Cultura 24:1055-1063. 1972.
RODRIGUES, R. Análise genética da resistência ao crestamento bacteriano comum e outras características agronômicas em Phaseolus vulgaris. (Tese de doutorado) Campos dos Goytacazes. Universidade Estadual do Norte Fluminense. 1997.
SKROCH, P. & NIENHUIS, J. Qualitative and quantitative characterization of RAPD variation among snap bean (Phaseolus vulgaris L.). Theoretical and Applied Genetics 91:1078-1085. 1995.
VALLADARES-SANCHEZ, N.E., COYNE, D.P. & SCHUSTER,
M.L. Differential reaction of leaves and pods of Phaseolus germplasm to strains of Xanthomonas phaseoli and transgressive segregation for tolerance from crosses of susceptible germplasm. Journal of the American Society for Horticultural Science 104:648-654. 1979.
VALLEJOS, C.E., SAKIYAMA, N.S. & CHASE, C.D. A molecular marker-based linkage map of Phaseolus vulgaris L. Genetics 131:733-740. 1992.
YOUNG, J.M., SADDLER, G.S., TAKIKAWA, Y, DE BOER, S.H., VAUTERIN, L., GARDAN, L., GVOZDYAK, R.I & STEAD, D.E. Names of plant pathogenic bacteria 1864-1995. Review of Plant Pathology 75:721-763. 1996.
YOUNG, N.D. QTL mapping and quantitative disease resistance in plants. Annual Review of Phytopathology 34:479-501. 1996.