ABSTRACT: Improved spray deposition can be attained by electrostatically charging spray droplets, which increases the attraction of droplets to plants and decreases operator exposure to pesticide and losses to the environment. However, this technique alone is not sufficient to achieve desirable penetration of the spray solution into the crop canopy; thus, air assistance can be added to the electrostatic spraying to further improve spray deposition. This study was conducted to compare different spraying technologies on spray deposition and two-spotted spider mite control in cut chrysanthemum. Treatments included in the study were: conventional TJ 8003 double flat fan nozzles, conventional TXVK-3 hollow cone nozzles, semi-stationary mo-torized jet launched spray with electrostatic spray system (ESS) and air assistance (AA), and semi-stationary motorized jet launched spray with AA only (no ESS). To evaluate the effect of these spraying technologies on the control of two-spotted spider mite, a control treatment was included that did not receive an acaricide application. The AA spraying technology, with or with-out ESS, optimized spray deposition and provided satisfactory two-spotted spider mite control up to 4 days after application.
Keywords: application technology, electrostatic spraying, air assisted spraying, flower sector, two-spotted spider mite
1Dow AgroSciences Seeds and Biotechnology Brazil Ltda., Rod. SP-330, km 296 − 14140-000 − Cravinhos, SP − Brazil.
2São Paulo State University/FCA − Dept. of Plant Protection, R. José Barbosa de Barros, 1780 − 18610-307 − Botucatu, SP − Brazil.
3Dow AgroSciences Industrial Ltda., Rod. SP-147, km 71,5 − 13801-540 − Mogi Mirim, SP − Brazil.
4São Paulo State University/FCAT, Rod. SP-294, km 651 − 17900-000 − Dracena, SP − Brazil.
5São Paulo State University/FCA − Dept. of Rural
Engineering, R. José Barbosa de Barros, 1780 − 18610-307 − Botucatu, SP − Brazil.
*Corresponding author <[email protected]>
Edited by: Dionysis Bochtis
Optimization of spray deposition and Tetranychus urticae control with air assisted
Denise Tourino Rezende de Cerqueira1, Carlos Gilberto Raetano2, Mario Henrique Ferreira do Amaral Dal Pogetto3, Marina Mouzinho Carvalho2, Evandro Pereira Prado4*, Saulo Ítalo de Almeida Costa2, Caio Alexandre Ferreira Moreira5
Received August 27, 2015
Accepted March 15, 2016
Introduction
In Brazil, the cultivated area with chrysanthemum (Dendranthema grandiflora Tzvelev) has increased over the last few years resulting in increased pressure from insect and disease pests. One of the most serious pest problems in chrysanthemum under protected conditions (Reddy et al., 2014) is Tetranychus urticae Koch (Acari: Tetranychidae) which can feed on over 1,100 differ-ent plants from more than 140 differdiffer-ent plant families (Grbić et al., 2011).
The main phytosanitary problems in cut chrysan-themum occur in the lower portion of the plant. Cur-rent commercial production practices include growing the plants at an extremely high density (90 plants m−2).
These factors have made it necessary to search for new application techniques that offer more effective pest control by ensuring that the spray penetrates the plant canopy to reach the insect pests.
Pesticide applications have been characterized by a considerable waste of energy and water, improper use of chemicals, and significant environmental contamina-tion (Matthews, 2000). Only 1 % of the sprayed pesti-cides are effective and 99 % of pestipesti-cides applied are released to non-target soils, water bodies and the atmo-sphere, and finally absorbed by almost every organism (Zhang et al., 2011). Therefore, the electrostatic spraying system (ESS) is presented as an innovative application technology which will help to optimize the use of
pesti-cides by improving spray deposition on the target and re-duce volumes and/or doses of pesticide applied to plants. The main advantage of electrostatic charging is the higher deposition on the target plants and lower deposi-tion on the ground (Xiongkui et al., 2011; Esehaghbeygi, 2012; Mamidi et al., 2013). While ESS improves spray deposition only on the top of plants, air assistance (AA) is also needed to ensure that spray droplets penetrate the canopy and reach the lower part of the plants. To be effective, the deposition of electrically charged droplets on adaxial and abaxial leaf surfaces, is influenced by the spray-load voltage (system), application rate (operating), guidance and target height (Maski and Durairaj, 2010).
ESS and AA spraying offer alternative pesticide application methods for spider mite control especially to cater to small producers. The aim of this study was to evaluate the spray deposition and spider mite control achieved with ESS and AA compared with conventional application technology (manual spray boom with no ESS nor AA) in cut chrysanthemum.
Materials and Methods
Spray deposition
position was quantified on the lower, middle, and upper thirds of the plants on both the adaxial and abaxial leaf surfaces. Blotting paper was used as an artificial target and Rhodamine B as a tracer, based on the methodology described by Cerqueira-Rezende et al. (2012). The meth-od selection and reliability of the quantitative analysis of spray deposition depend on the nature of the target, the tracer substance, and the interaction between the target and the tracer. The tracer Rhodamine B is recommended for quantitative spraying evaluation on artificial targets to optimize the reliability of the quantitative analysis (Cerqueira-Rezende et al., 2012).
The experiments were conducted with plants of cut chrysanthemum from the Reagan cultivar, that were approximately 1.0 m tall, which represents the most critical development stage for phytosanitary treatment (pesticide application). The experimental design was a completely randomized design with four treatments and five replications. The dimensions of each plot were 1.20 m × 6.0 m (width × length). In the central area of each plot (0.60 m × 4.0 m) blotting papers (artificial targets) were placed on ten random plants. Blotting papers were 1.5 × 2.0 cm and were placed on the abaxial and ad-axial leaf surfaces in the lower, middle, and upper thirds (0.25, 0.5 and 0.75 m, respectively, above the ground) of each plant; thus, each plant contained a total of six blotting papers.
The four spray application techniques investigated in the study were: 1) conventional with TXVK-3 hollow conic nozzle (application system usually used in com-mercial cut chrysanthemum company production), 2) conventional with TwinJet TJ 8003 double flat fan spray nozzle, 3) semi-stationary motorized gun jet launched sprayer (ESS, model MBP 4.0, Watkinsville, GA, US) with electric charge and air assistance, and 4) semi-sta-tionary motorized gun jet launched sprayer with air as-sistance only (no electric charge).
The conventional spray application was dispersed using a manual spray boom with 5 nozzles spaced at 0.3 m to which liquid was supplied via a hose from a station-ary pump. The air assisted electrostatic spraying system had an induction-charging nozzle (at the tip of the nozzle is a tiny electrode which applies an electrical charge to the spray), a high-voltage generator, a portable blower powered by a gasoline engine, spray liquid 15 liter-tank and a flexible spray hose.
The electrostatic sprayer uses the pneumatic prin-ciple for formation and fractionation of the droplets; moreover, it uses the methods of indirect induction of
charges for drop electrification (Sasaki et al., 2013). The applicator speed was measured with a timer, and the application volume varied according to the flow rate of each nozzle. Equipment and technical characteristics of the respective treatments are provided in Table 1.
The spray height for the conventional spray boom, equipped with the nozzles TJ 8003 and TXVK-3, was 0.50 m above the crop canopy. In the electrostatic and air assisted equipment treatments the nozzle was maintained at 0.20 m above the crop canopy and tilted at 30° in the horizontal plane of the crop canopy in rela-tion to the direcrela-tion the applicator was walking. This configuration was done in order to obtain better spray deposition.
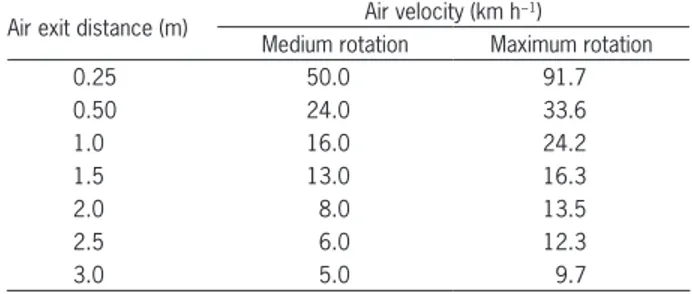
Air velocity of semi stationary sprayer was mea-sured with a portable digital thermo-anemometer in three replicates at distances of 0.25, 0.50, 1.0, 1.5, 2.0, 2.5, and 3.0 m from the equipment nozzle exit at medi-um and maximmedi-um acceleration of the engine in a closed room.
The TXVK-3 hollow cone nozzle was selected be-cause it provides thorough spray coverage (higher den-sity drops). The Twinjet TJ 8003 double flat fan spray nozzle was selected because it produces spray droplets similar in size to those produced by the TXVK-3 nozzle at similar work pressures (ASABE, 2004). Additionally, the Twinjet TJ 8003 double flat fan spray nozzle is com-monly used for phytosanitary treatments in commercial cut chrysanthemum production.
The spray solution was prepared with Rhodamine B tracer at a concentration of 0.05 g L−1 of water.
Dur-ing sprayDur-ing the temperature and the relative humidity were 32 ± 2 °C and 56 ± 2 %, respectively. After spray treatment the blotting papers were collected from each portion of the plant and placed in separate sample con-tainers. They were then taken to the Laboratory, Jaguar-iúna City, São Paulo, where they were placed in amber vials with 50 mL of extraction solution consisting of dis-tilled water + 0.2 % Tween 80 (polyoxyethelene sorbi-tan monolaurate). The vials with the extraction solution were placed on a rotary shaker at 150 rpm for 15 min and then allowed to stand for 10 min. A 4.0 mL aliquot of the extraction solution was then removed for Rho-damine B concentration measurement in a fluorometer with an NB 540 excitation filter and SC 585 emission filter.
The fluorometer calibration was performed in four replicates of 0, 10, 25, 50, 75, and 100 mg L−1
Rhoda-mine B solutions. The reading of the marker
concentra-Table 1 − Treatments, technical and operational characteristics applied in the spray deposition and control efficiency of Tetranychus urticae trials.
Treatments Nozzle Droplets size (µm) (VMD)a Work pressure (kPa) Application volume (L ha−1)b
T1 - Spray Boom (Conv.) TJ 8003 136 600 800
T2 - Spray Boom (Conv.) TXVK-3 123 1000 110
T3 - Eletrostatic+Air assistance Electrostatic + Air nozzle 40 862.5c 40
T4 - Air assistance Air nozzle 40 862.5c 40
and 7 days after application (DAA) by counting the num-ber of mites per leaf in the middle and upper thirds of plants. A second application of acaricide occurred 7 days after the first application; this was necessary to achieve further control due to the high population of mites in the area.
Mite population assessment data were submitted to analysis of variance by F test (p < 0.05) to verify the homogeneity of the population among the experimental plots. As this test is a significant one, the data were sub-jected to analysis of covariance (p < 0.05) to adjust for the number of mites in relation to the preliminary evalu-ation. To evaluate the effect of the pesticide application technology on mite control, the results were subjected to analysis of variance using an F test (p < 0.05), with treat-ments arranged in a 5 × 2 factorial (5 treattreat-ments × 2 parts of the plant). The treatment means were compared using Tukey’s test (p < 0.05). The mean efficacy of the treatments was calculated by the Handerson and Tilton formula (Henderson and Tilton, 1955), which was justi-fied by the lack of homogeneity in the experimental plots.
Results and Discussion
Spray deposition
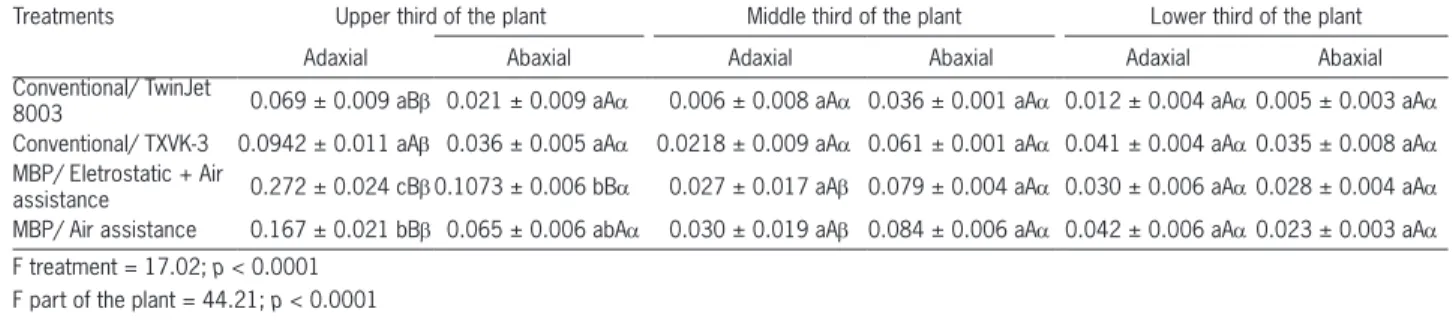
The mean air velocity of the ESS equipment at seven distances from the air outlet is presented in Table 2. Results of the spray deposition study are presented in Table 3. Only on the upper third of the plant did the ESS equipment (treatments 3 and 4) provide greater spray deposition on the adaxial leaf surface compared to con-ventional treatments. On the abaxial leaf surface (upper third), the ESS equipment with both electrostatic charge and air assisted spraying provided greater deposition concentration than the other treatments.
Spray deposition was also compared between dif-ferent parts of the plant in the same leaf surface. For the adaxial leaf surface, greater spray deposition occurred on the upper third of plant in the treatments 1, 2 and 3, while deposition did not differ across plant sections in treatmet 2. For the abaxial surface, the ESS treatment with electrostatic charge and AA spraying provided greater spray deposition in the upper third of the plant compared to the middle and lower thirds of the plant; tion values made possible the accuracy of this
analyti-cal method. Extraction method details are described by Cerqueira-Rezende et al. (2012). As the rate of applica-tion was not equal to all treatments, different doses of Rhodamine B were sprayed per area (hectare – ha / 1 ha = 10,000 m2), considering its concentration in the
solu-tion equivalent to 0.05 g L−1. In this way, the residual
values were transformed to a volume equivalent to 800 L ha−1 for comparison.
The deposition data were subjected to analysis of variance using an F test (p < 0.05), with treatments ar-ranged in a factorial design with triple interaction 4 × 3 × 2 (4 treatments × 3 plant parts × 2 leaf surfaces). The treatment means were compared by Tukey’s test (p < 0.05).
Effect of application technology on Tetranychus
ur-ticae control in chrysanthemum
The T. urticae control experiment was conducted at the same greenhouse where spray deposition experi-ments in two different chrysanthemum life cycles had been conducted, experiments A (Mar 2012) and B (May 2012). The experimental design was a completely ran-domized block design with five treatments and four replications. Each replicate was represented by a leaf; leaves were separately evaluated in the middle and up-per thirds of ten random plants in each plot (leaves of bottom thirds were not evaluated due to the low mite population). The treatments were composed of the same four application equipment system used in the spray de-position experiment plus an additional treatment con-trol - T5 (no pesticide sprayed). In the T. urticae control experiment, the techniques were used to apply the pes-ticide chlorfenapyr to control spider mite. Chlorfenapyr is a halogenated pyrrole that disrupts mitochondrial oxidaditive phosphorylation, resulting in disruption of adenosine triphosphate production and losses of energy, leading to cell dysfunction and subsequent elimination of the organism (Raghavendra et al., 2011).
A preliminary evaluation of the spider mite popu-lation was performed by counting the number of live mites (nymphs and adults) per leaf in the lower, middle and upper thirds of the plant, with a pocket magnifier (10x magnification). The pesticide was applied to mite control when one mite per leaf (control level) was de-tected in samples throughout the plant.
The acaricidal applications were made using the same procedure as the spray deposition assessment experiment. The dosage was defined according to the chlorfenapyr manufacturer's recommendation (50 mL chlorfenapyr per 100 L−1 of water). The temperature and
relative humidity levels during the application of experi-ment A were 36 ± 2 °C and 60 ± 2 % (first application) respectively; 36 ± 2 °C and 62 ± 2 % (second applica-tion). In experiment B the temperature was 34 ± 2 °C and relative humidity 57 ± 2 % (first application); 32 ± 2 °C and 69 ± 2 % (second application) respectively.
Mite population assessments were conducted 1, 4,
Table 2 − Mean air velocity measured in medium and maximum rotation at different air exit distances from the ESS (electrostatic spray system) equipment.
Air exit distance (m) Air velocity (km h−1)
Medium rotation Maximum rotation
0.25 50.0 91.7
0.50 24.0 33.6
1.0 16.0 24.2
1.5 13.0 16.3
2.0 8.0 13.5
2.5 6.0 12.3
spray deposition on the abaxial leaf surface did not differ across plant sections in the ESS with AA spraying and conventional treatments (Table 3).
The spray deposition between the two leaf surfac-es in each part of the plant revealed that all treatments had the greatest deposition on the adaxial as compared to the abaxial leaf surface in the top third of the plant. In the middle third of the plant, higher levels of spray deposits on the abaxial leaf surface compared to the ad-axial surface occurred only in treatments 3 and 4 (both with average deposition of 0.076 µg cm−2). In the bottom
third of the plants deposition on the adaxial and abaxial leaf surfaces was equal (Table 3).
Western et al. (1994) reported that the use of air assistance reduced the drift of small spray droplets by 93 %, suggesting that most of the spray reached the target. The results of Western et al. (1994) concur with results of the pioneering research conducted by Hislop et al. (1983) and Cooke et al. (1986), who reported that the use of electrostatic spraying has the potential to enhance, or at least maintain, levels of spray deposition and thereby contributes to a reduction in spray volume and, conse-quently, reduces the amount of pesticide used in some crops.
The effectiveness of the ESS and AA with the semi-stationary sprayer at increasing spray deposition is demonstrated by the results of treatment 3 on the upper third of the plants (Table 3). It is important to note that achieving greater pesticide spray deposition on the plant is expected to provide increased efficacy of pesticides on insect and disease pests.
The efficacy of technologies on Tetranychus urticae in chrysanthemum
The absence of or low mite population on the bot-tom third of the plants, due to displacement towards the tops of plants, prevented analysis of mite control data in this region. The control treatment had fewer mites when compared with the other treatments, which
indi-cates that the distribution of mites in the experimental area was uneven; therefore, the focus was on differences between control treatments that received a pesticide ap-plication (Tables 4-7).
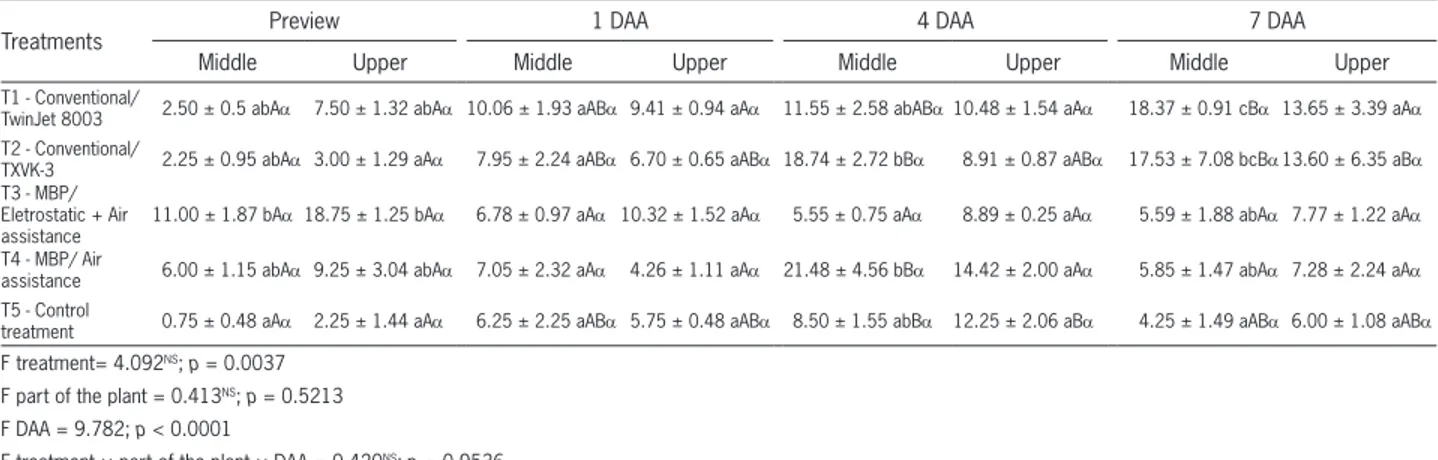
In the first chlorfenapyr application to experi-ment A, treatexperi-ment 3 had a lower number of mites in the middle third of the plant (5.55) compared to the other sprayed treatments at 4 DAA. At 7 DAA, treatments 3 and 4 also showed lower numbers of mites compared to the other two sprayed treatments in the middle third of the plant (Table 4). In experiment B the number of mites in treatments 3 and 4 was lower than that of treat-ment 2 in the middle and upper thirds of the plant at 4 DAA. At 7 DAA the number of mites in treatment 4 was lower than that of treatment 2 in the middle third of the plant and the number of mites in treatments 3 and 4 was lower than that of treatments 1 and 2 in the upper third of the plant (Table 5).
Mite control in the middle third of the plant was not observed for treatments 1 and 2 in both experiments (A and B), whereas the number of mites in the prelimi-nary evaluation (before application) of the experiments for these treatments was much lower than the number of mites found in the first, fourth, and seventh DAA (Ta-bles 4 and 5). In treatment 3, experiment A, the number of mites in the first, fourth and seventh DAA gradually decreased, falling from 11 to 5.59 mites (50 % reduction) in the middle third of the plant and from 18.75 to 7.77 mites (59 % reduction) in the upper third of the plant (Table 4).
Overall, it can be inferred that treatments 3 and 4 held the spider mite population constant between the preliminary evaluation and the control assessments, which shows the superiority of the ESS compared with the conventional application system (Tables 4 and 5). Without the control of the pest population growth pro-vided by the ESS, substantial mites damage may have occurred and prevented the producer from marketing the final product.
Table 3 − Mean values of Rhodamine B tracer (µg cm−2) spray deposit ± standard deviations in the artificial target blotter paper, for treatment × part of the plant × leaf surface (adaxial and abaxial)*.
Treatments Upper third of the plant Middle third of the plant Lower third of the plant
Adaxial Abaxial Adaxial Abaxial Adaxial Abaxial
Conventional/ TwinJet
8003 0.069 ± 0.009 aBβ 0.021 ± 0.009 aAα 0.006 ± 0.008 aAα 0.036 ± 0.001 aAα 0.012 ± 0.004 aAα0.005 ± 0.003 aAα Conventional/ TXVK-3 0.0942 ± 0.011 aAβ 0.036 ± 0.005 aAα 0.0218 ± 0.009 aAα 0.061 ± 0.001 aAα 0.041 ± 0.004 aAα0.035 ± 0.008 aAα
MBP/ Eletrostatic + Air
assistance 0.272 ± 0.024 cBβ0.1073 ± 0.006 bBα 0.027 ± 0.017 aAβ 0.079 ± 0.004 aAα 0.030 ± 0.006 aAα0.028 ± 0.004 aAα MBP/ Air assistance 0.167 ± 0.021 bBβ 0.065 ± 0.006 abAα 0.030 ± 0.019 aAβ 0.084 ± 0.006 aAα 0.042 ± 0.006 aAα0.023 ± 0.003 aAα
F treatment = 17.02; p < 0.0001 F part of the plant = 44.21; p < 0.0001 F leaf surface = 50.84; p < 0.0001
F treatment × part of the plant × leaf surface = 1.03NS; p = 0.4079
No differences were observed between the differ-ent parts of the plant at each evaluation evdiffer-ent after the first application in experiment A (Table 4). In experiment B, there was a difference only seven DAA for treatment 1, where the number of mites in the upper third of the plant was higher than that of the middle third of the plant (Table 5).
After the second pesticide application in experi-ment A, fewer mites were observed in the middle third of the plant in treatment 3 compared to the other treat-ments at 4 DAA. At 7 DAA, treattreat-ments 1 and 3 had lower numbers of mites in the upper third of the plant (Table 6). Treatment 1 also achieved a decrease in the average number of mites, falling from 17 (preview) to 4.93 (7 DAA) mites cm−2 (a 71 % reduction) in the middle third
of the plant (Table 6).
After the second application in experiment B, treatments 1 and 2 achieved a decrease in the number
of mites in the upper and middle thirds of the plant, respectively. Treatments 3 and 4 had no difference in the average number of mites after this application, indi-cating that there was no increase in the pest population and, consequently, no increase in damage to the final marketable product (Table 7).
Despite the mite control that was achieved, the ef-ficacy of this product does not meet the control expec-tations of commercial producers. Factors that inhibited T. urticae control likely included the large population, irregular distribution of the population throughout the plant when the pesticide was applied, and principally the possibility of resistance to the acaricide. It should be noted that this pesticide is heavily sprayed for spider mite control in the floriculture industry of this region and probably is the reason for the low efficiency. Nicas-tro et al. (2013) reported pesticide resistance in this mite in various regions throughout Brazil; moreover, the high-Table 4 − Mean number of mites ± standard deviation per leaf for the different treatments in the middle and upper thirds of the plant with 1, 4
and 7 days after (DAA) the first application of experiment A*.
Treatments Preview 1 DAA 4 DAA 7 DAA
Middle Upper Middle Upper Middle Upper Middle Upper
T1 - Conventional/
TwinJet 8003 2.50 ± 0.5 abAα 7.50 ± 1.32 abAα 10.06 ± 1.93 aABα 9.41 ± 0.94 aAα 11.55 ± 2.58 abABα10.48 ± 1.54 aAα 18.37 ± 0.91 cBα 13.65 ± 3.39 aAα T2 - Conventional/
TXVK-3 2.25 ± 0.95 abAα 3.00 ± 1.29 aAα 7.95 ± 2.24 aABα 6.70 ± 0.65 aABα18.74 ± 2.72 bBα 8.91 ± 0.87 aABα 17.53 ± 7.08 bcBα13.60 ± 6.35 aBα T3 - MBP/
Eletrostatic + Air
assistance 11.00 ± 1.87 bAα18.75 ± 1.25 bAα 6.78 ± 0.97 aAα 10.32 ± 1.52 aAα 5.55 ± 0.75 aAα 8.89 ± 0.25 aAα 5.59 ± 1.88 abAα7.77 ± 1.22 aAα T4 - MBP/ Air
assistance 6.00 ± 1.15 abAα 9.25 ± 3.04 abAα 7.05 ± 2.32 aAα 4.26 ± 1.11 aAα 21.48 ± 4.56 bBα 14.42 ± 2.00 aAα 5.85 ± 1.47 abAα7.28 ± 2.24 aAα T5 - Control
treatment 0.75 ± 0.48 aAα 2.25 ± 1.44 aAα 6.25 ± 2.25 aABα 5.75 ± 0.48 aABα 8.50 ± 1.55 abBα 12.25 ± 2.06 aBα 4.25 ± 1.49 aABα6.00 ± 1.08 aABα F treatment= 4.092NS; p = 0.0037
F part of the plant = 0.413NS; p = 0.5213
F DAA = 9.782; p < 0.0001
F treatment × part of the plant × DAA = 0.420NS; p = 0.9536
*Means followed by the same letter: lowercase in the column, comparing treatments in each column; Capital comparing the same part of the plant between the different days after spraying for each treatment, and Greek letters comparing different part of the plants within the same day after application in each treatment do not differ by Tukey test at 5 % probability (p > 0.05); NS = Not significant; DAA = Day(s) after application.
Table 5 − Number of mites ± standard deviations for the different treatments in the middle and upper thirds of the plant with 1, 4 and 7 days after the first application of experiment B*.
Treatments Preview 1 DAA 4 DAA 7 DAA
Middle Upper Middle Upper Middle Upper Middle Upper
T1 - Conventional/
TwinJet 8003 1.00 ± 0.7 aA 6.25 ± 1.1 bAβ 4.57 ± 1.08 aABα4.09 ± 1.74 aAα 7.37 ± 1.32 abBα 7.41 ± 1.74 abAα 7.71 ± 0.831 abBα16.74 ± 4.03 bBβ T2 - Conventional/
TXVK-3 2.00 ± 1.08 aAα 5.75±1.31 abAβ 3.18 ± 0.438 aAα5.64 ± 1.31 aAα 14.69 ± 1.85 bBα14.99 ± 2.65 bBα 10.51 ± 3.26 bBα 16.49 ± 1.94 bBα T3 - MBP/ Eletrostatic
+ Air assistance 2.50 ± 1.19 aAα3.75 ± 1.49 abAα 0.79 ± 0.42 aAα 1.82 ± 0.36 aAα 2.93 ± 1.25 aAα 4.80 ± 1.05 aAα 3.28 ± 1.08 abAα 3.50 ± 1.32 aAα T4 - MBP/Air assistance2.25 ± 0.25 aAα4.75 ± 1.44 abAα 4.08 ± 0.25 aAα 3.48 ± 1.37 aAα 2.77 ± 0.17 aAα 5.90 ± 1.18 aAα 2.77 ± 1.26 aAα 4.99 ± 0.91 aAα
T5 - Control treatment 0.25 ± 0.25 aAα0.75 ± 0.25 aAα 1.50 ± 0.65 aAα 2.50 ± 0.87 aABα 6.75 ± 2.10 abBα 7.00 ± 1.29 abBα 3.25 ± 1.93 aABα 5.00 ± 2.42 aABα
F Treatment = 18.181; p < 0.0001 F part of the plant = 18.668; p < 0.0001 F DAA = 22.900; p < 0.0001
F Treatment × part of the plant DAA = 0.848NS; p = 0.6015
est frequencies of resistance were observed in popula-tions collected from chrysanthemum in Holambra, SP.
Spider mite control has been accomplished with both insecticides and acaricides (Zhang, 2003); however, due to the short life cycle, abundant progeny, and arrhe-notokous reproduction, spider mites develop resistance to these compounds very quickly. According to Leeuwen et al. (2010), 367 resistance cases to 92 T. urticae active ingredients have been reported, which makes their con-trol a challenge. Herron and Rophail (2003) first detected spider mite resistance to chlorfenapyr in nectarine or-chards in Australia. The results obtained by Tirello et al. (2012) indicate that some acaricides such as abamectin, hexythiazox, clofentezine used in greenhouse to control T. urticae in roses and other ornamental flowers have lost most of their activity. Regardless of the occurrence of resistance in the population exposed to pesticides, the
results of this research concur with those obtained by Olivet and Val (2008). The authors reported high efficacy on whitefly in tomato with lower application rates using an electrostatic sprayer when compared to 3.5 and 8.0 times higher the application rates applied with conven-tional spray equipment (no electrostatic charge).
Research on spray deposition has shown that 50 % of the active ingredient applied through ESS has the same efficacy on disease and insect pests as convention-al methods. Additionconvention-ally, applicator safety increases due to the reduction in the loss of foliar spray residue with electrically charged droplets (Law, 2001).
The efficiency (%) average on controlling T. urticae on cut chrysanthemum after the chlorfenapyr applica-tions by different treatments in the experiments A and B, can be seen on Figures 1 to 4. In the first applica-tion of the pesticide (Experiment A) nearly 90 % effi-Table 6 − Number of mites ± standard deviation for the different treatments in the middle and upper thirds of the plant with 1, 4 and 7 days after
the second application of experiment A*.
Treatments Preview 1 DAA 4 DAA 7 DAA
Middle Upper Middle Upper Middle Upper Middle Upper
T1 - Conventional/
TwinJet 8003 17.00 ± 0.71 cBα 13.50 ± 3.3 aAα 5.75 ± 1.49 aAα9.48 ± 1.89 aA 9.03 ± 1.9 aABα 5.72 ± 0.76 aAα 4.93 ± 1.49 aAα 6.62 ± 0.87 abAα T2 - Conventional/
TXVK-3 16.00 ± 6.86 bcAα 12.50 ± 6.46 aAα 6.74 ± 0.75 aAα9.29 ± 2.24 aAα 10.39 ± 1.61 aAα 9.37 ± 0.65 aAα 16.10 ± 4.6 bAα 14.56 ± 1.08 bAα T3 - MBP/ Eletrostatic
+ Air assistance 9.75 ± 2.87 abcAα10.00 ± 1.47 aAα 6.25 ± 1.55 aAα7.44 ± 1.5 aAα 3.00 ± 0.51 aAα 4.38 ± 0.91 aAα 4.11 ± 0.66 aAα 6.89 ± 1.2 abAα T4 - MBP/Air
assis-tance 6.75 ± 1.89 abAα 7.50 ± 2.1 aABα 5.00 ± 0.41 aAα5.59 ± 2.42 aAα 6.33 ± 1.16 aAα 6.13 ± 1.77 aAα 8.38 ± 1.87 abAα16.54 ± 2.26 bBβ T5 - Control treatment 4.25 ± 1.49 aAα 6.00 ± 1.08 aAα 4.50 ± 1.44 aAα7.25 ± 1.31 aAα 8.75 ± 1.49 aAα10.00 ± 1.29 aAα 3.50 ± 0.29 aAα 4.25 ± 0.85 aAα
F Treatment = 6.678; p < 0.0001 F part of the plant = 1.849NS; p = 0.1762
F DAA = 3.106NS; p = 0.0287
F Treatment × part of the plant × DAA = 0.488NS; p = 0.9190
*Means followed by the same letter: lowercase in the column, comparing treatments in each column; capital comparing the same part of the plant between the different days after spraying for each treatment, and Greek letters comparing different part of the plants within the same day after application in each treatment do not differ by Tukey test at 5 % probability (p > 0.05); NS =Not significant; DAA = Day(s) after application.
Table 7−Number of mites ± standard deviations for the different treatments in the middle and upper thirds of the plant with 1, 4 and 7 days after the second application of experiment B*.
Treatments Preview 1 DAA 4 DAA 7 DAA
Middle Upper Middle Upper Middle Upper Middle Upper
T1 - Conventional/
TwinJet 8003 7.75 ± 0.85 abAα 16.75 ± 4.03 bBβ 5.80 ± 2.42 aAα 6.22 ± 1.42 aAα 4.56 ± 1.32 aAα 6.00 ± 1.6 aAα 1.99 ± 0.54 aAα 5.73 ± 2.34 aAα T2 - Conventional/
TXVK-3 10.50 ± 3.281 bBα16.50 ± 1.94 aAα 3.14 ± 1.02 aABα 7.46 ± 1.32 aAα 3.78 ± 1.11 aABα8.48 ± 2.24 aAα 1.68 ± 0.89 aAα10.82 ± 2.965 aAβ T3 - MBP/ Eletrostatic +
Air assistance 3.25 ± 1.03 abAα 3.50 ± 1.32 aAα 2.06 ± 0.48 aAα 3.59 ± 1.12 aAα 1.67 ± 0.33 aAα 3.13 ± 1.43 aAα 2.50 ± 0.66 aAα 7.75 ± 2.4 aAα
T4 - MBP/Air assistance 2.25 ± 1.25 aAα 5.00 ± 0.91 aAα 4.25 ± 0.91 aAα 8.38 ± 0.66 aAα 2.79 ± 1.01 aAα 4.23 ± 0.35 aAα 5.55 ± 1.61 aAα 9.46 ± 2.56 aAα
T5 - Control treatment 3.25 ± 1.93 abAα 5.00 ± 2.42 aAα 1.50 ± 0.65 aAα 4.75 ± 0.48 aAα 5.25 ± 1.25 aAα 6.00 ± 1.47 aAα 3.75 ± 0.25 aAα12.50 ± 3.43 aAβ
F Treatment = 5.133NS; p = 0.0007
F part of the plant = 35.305; p < 0.0001 F DAA = 2.909NS; p = 0.0369
F Treatment × part of the plant × DAA = 0.414NS; p = 0.9561
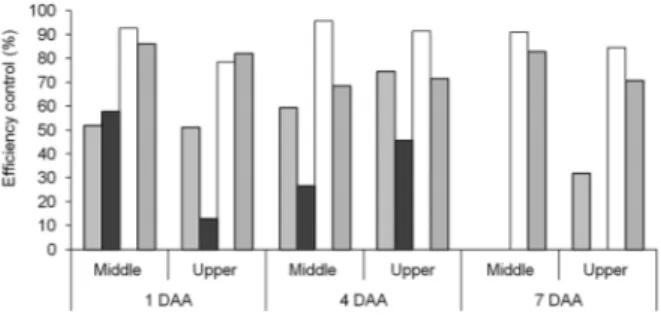
cacy was achieved with treatment 3 at 4 DAA (Figure 1). This demonstrates the increased level of control that was achieved with the ESS equipment associated with the AA. When the pesticide was sprayed only with the AA, efficacy decreased but was still higher than 75 % (Figure 1). Overall, at 4 DAA , the second application in Experiment A, the treatments achieved efficacy (average of all treatments) on the upper and middle plant third of 64 and 71 %, respectively (Figure 2).
In Experiment B, mean efficacy was up to 80 % of the control at 4 DAA in treatments 3 and 4 (AA with elec-trostatic and only air assistance treatments, respective-ly), as shown in Figure 3. After the second application of experiment B, there was less effective mite control in the first DAA. At 4 DAA the average control remained up to 50 % for both parts of the plant (Figure 4).
Fluctuations in the spider mite population may be related to the favorable environmental conditions for their development and their relatively short life cycle. These factors, coupled with the likelihood of resistance to chlorfenapyr, may have inhibited control of this pest in chrysanthemum. The effects of dispersal and gene
Figure 1 − Efficiency (%) after the first application on T. urticae of
chlorfenapyr- Experiment A, with different application technologies in the upper and middle thirds of the chrysanthemum plants. DAA = Day(s) after application.
Figure 3 − Efficiency (%) after the first application on T. urticae of chlorfenapyr - Experiment B, with different application technologies in the upper and middle thirds of the chrysanthemum plants. DAA = Day(s) after application.
Figure 4 − Efficiency (%) after the second application on T. urticae of
chlorfenapyr - Experiment B, with different application technologies in the upper and middle thirds of the chrysanthemum plants. DAA = Day(s) after application.
Figure 2 − Efficiency (%) after the second application on T. urticae of
chlorfenapyr - Experiment A, with different application technologies in the upper and middle thirds of the chrysanthemum plants. DAA = Day(s) after application.
flow stability to two-spotted mite populations in the dif-ferent experiments (A and B) probably influenced the acaricide resistance development. The knowledge of these effects is very important for advancing pesticide resistance management for arthropod pests.
The AA and ESS equipment provided increased spray deposition and improved efficacy on two-spotted spider mite in cut chrysanthemum as compared to the spray deposition and efficacy provided by conventional spray technology. It is possible to substantially reduce the pesticide application rate in cut chrysanthemum with the AA, with or without the ESS, without affecting the efficacy of the pesticide. The electrostatic technique provided acceptable two-spotted spider mite control us-ing 20 times less acaricide per ha in relation to the con-ventional spray; however, the control level was depen-dent on the T. urticae population size that was present when the acaricide was applied.
com-fort to the applicator. In Brazil, small producers improvise steady spray systems by using water tanks with greater volumes to apply pesticides in their cultivation areas. Throughout the conduct of this research, it was verified that the ESS equipment with AA provides producers with many benefits (i.e. lower application volume, increased spray deposition, improved efficacy, and reduction of pesticide rate area unit) that may be, despite the initial investment, an economic tool over the years; however, producers do not always consider these advantages and often select the conventional equipment, which appears to them to be the most practical and cost-effective equip-ment that applies large quantities of spray solution.
The use of AA combined with electrostatic in backpack and semi-stationary equipment is very prom-ising, especially in floriculture and horticulture where pesticides could be applied in lower dosages and spray volumes. For crops where spray droplet penetration is not a limiting factor in the control of harmful plant pests, potential use of products with contact action is higher, especially if the electrical charge droplets transfer is not associated with AA as an optional use of this spray equipment.
Future research on the effect of techniques and equipment on mite control should evaluate the suscep-tibility of the mite population to the acaricides used in a particular region. The low efficacy of some chemical groups of insecticides/acaricides, linked with the differ-ent population resistance levels and the population sizes at the time that the pesticide is applied, can negatively influence the efficacy that is offered by a particular tech-nique or spray selection.
Acknowledgements
We would like to thank the São Paulo State Foun-dation for Research Support (FAPESP) for supporting the first author through an assistantship and Brandon J. Fast, from Dow AgroSciences, for reviewing the spelling, grammar, usage and scientific English of this paper.
References
American Society of Agricultural and Biological Engineers [ASABE]. 2004. Spray Nozzle Classification by Droplet Spectra. ASABE, St. Joseph, MI, USA. (Standard S-572).
Cerqueira-Rezende, D.T.; Raetano, C.G.; Dal Pogetto, M.H.F.A.; Prado, E.P.; Christovam, R.S.; Serra, M.E.; Costa, S.I.A. 2012. Agricultural spray deposit quantification methods. Applied
Engineering in Agriculture28: 1-7.
Cooke, B.K.; Hislop, E.C.; Herrington, P.J.; Western, N.M.; Jones, K.G.; Woodley, S.E.; Chapple, A.C. 1986. Physical, chemical and biological appraisal of alternative spray techniques in cereals. Crop Protection 5: 155-164.
Esehaghbeygi, A.; Tadayyon, A.; Besharati, S. 2012. Comparison of electrostatic and spinning-discs spray nozzles on wheat weeds control. International Journal of Agricultural and Environmental 5: 49-53.
Grbić, M.; Van Leeuwen, T.; Clark, R.M.; Rombauts, S.; Rouzé, P.;
Grbić, V.; Osborne, E.J.; Wannes, D.; Ngoc, P.C.T.; Ortego,
F.; Hernández-Crespo, P.; Diaz, I.; Martinez, M.; Navajas, M.;
Sucena, E.; Magalhães, S.; Nagy, L.; Pace, R.M.; Djuranović,
S.; Smagghe, G.; Iga, M.; Christiaens, O.; Veenstra, J.A.; Ewer, J.; Villalobos, R.M.; Hutter, J.L.; Hudson, S.D.; Velez, M.; Yi, S.V.; Zeng, J.; Silva, A.P.; Roch, F.; Cazaux, M.; Navarro, M.; Zhurov, V.; Acevedo, G.; Bjelica, A.; Fawcett, J.A.; Bonnet, E.; Martens, C.; Baele, G.; Wissler, L.; Sanchez-Rodriguez, A.; Tirry, L.; Blais, C.; Demeestere, K.; Henz, S.R.; Gregory, T.R.; Mathieu, J.; Verdon, L.; Farinelli, L.; Schmutz, J.; Lindquist,
E.; Feyereisen, R.; Peer, Y.V. 2011. The genome of Tetranychus
urticae reveals herbivorous pest adaptations. Nature 479: 487-492.
Henderson, C.F.; Tilton, E.W. 1955. Test with acaricides against the brown wheat mite. Journal of Economic Entomology 43:157-161.
Herron, G.A.; Rophail, J. 2003. First detection of chlorfenapyr (Secure®) resistance in two-spotted spider mite (Acari: Tetranychidae) from nectarines in an Australia orchard. Experimental and Applied Acarology 31: 131-134.
Hislop, E.C.; Cooke, B.K.; Harman, J.M.P. 1983. Deposition and biological efficacy of a fungicide applied in charged and uncharged sprays in cereal crops. Crop Protection 2: 305-316.
Law, S.E. 2001. Agricultural electrostatic spray application: a
review of significant research and development during the 20th
century. Journal of Electrostatics 51-52: 25-42.
Leeuwen, T.V.; Vontas, J.; Tsagkarakou, A.; Dermauw, W.; Tirry, L. 2010. Acaricide resistance mechanisms in the two-spotted
spider mite Tetranychus urticae and other important Acari: a
review. Insect Biochemistry and Molecular Biology 40: 563-572.
Mamidi, V.R.; Ghanshyam, C.; Kumar, P.M.; Kapur, P. 2013. Electrostatic hand pressure knapsack spray system with enhanced performance for small scale farms. Journal of Electrostatics 71: 785-790.
Maski, D.; Durairaj, D. 2010. Effects of electrode voltage, liquid flow rate, and liquid properties on spray. Journal of Electrostatics 68: 152-158.
Matthews, G.A. 2000. Pesticide Application Methods. 3ed. Blackwell, Oxford, UK.
Nicastro, R.L.; Sato, M.E.; Arthur, V.; Silva, M.Z. 2013.
Chlorfenapyr resistance in the spider mite Tetranychus urticae:
stability, cross-resistance and monitoring of resistance. Phytoparasitica 41: 503-513.
Olivet, J.; Val, L. 2008. Application technology for controlling
whitefly Trialeurodes vaporariorum (Westwood) in tomato
greenhouses. Agrociencia 12: 40-47 (in Spanish, with abstract in English).
Raghavendra, K.; Barik, T.K.; Sharma, P.; Bhatt, R.M.; Srivastava, H.C.; Sreehari, U.; Dash, A.P. 2011. Chlorfenapyr: a new insecticide with novel mode of action can control pyrethroid resistant malaria vectors. Malaria Journal 10: 16.
Reddy, S.G.E.; Urvashi, C.; Sapana, K.; Gireesh, N.; Singh, M.K. 2014. Comparative bio-efficacy of acaricides against two spotted
spider mite, Tetranychus urticae (Koch) on chrysanthemum in
Sasaki, R.S.; Teixeira, M.M.; Fernandes, H.C.; Monteiro, P.M.D.B.; Rodrigues, D.E.; Alvarenga, C.B.D. 2013. Parameters of electrostatic spraying and its influence on the application efficiency. Revista Ceres 60: 474-479.
Tirello, P.; Pozzebon, A.; Cassanelli, S.; Van Leeuwen, T.; Duso, C.
2012. Resistance to acaricides in Italian strains of Tetranychus
urticae: toxicological and enzymatic assays. Experimental and Applied Acarology 57: 53-64.
Western, N.M.; Hislop, E.C.; Dalton, W.J. 1994. Experimental air electro hydro dynamic spraying. Crop Protection 13: 179-188. Xiongkui, H.; Aijun, Z.; Yajia, L.; Jianli, S. 2011. Precision orchard
sprayer based on automatically infrared target detecting and electrostatic spraying techniques. International Journal of Agricultural and Biological Engineering 4: 35-40.
Zhang, W.; Jiang, F.; Ou, J. 2011. Global pesticide consumption and pollution: with China as a focus. Proceedings of the International Academy of Ecology and Environmental Sciences 1: 125-144.