Effect of age and gender on sweat
lactate and ammonia concentrations
during exercise in the heat
1Laboratório de Pesquisa do Exercício, Escola de Educação Física,
Universidade Federal do Rio Grande do Sul, Porto Alegre, RS, Brasil
2Children’s Exercise and Nutrition Centre, Department of Pediatrics,
Department of Physical Education, Department of Medical Sciences, McMaster University, Hamilton, Ontario, Canada
F. Meyer1, O. Laitano1,
O. Bar-Or2, D. McDougall2
and G.J.F. Heigenhauser2
Abstract
The dependence of sweat composition and acidity on sweating rate (SR) suggests that the lower SR in children compared to adults may be accompanied by a higher level of sweat lactate (Lac-) and ammonia
(NH3) and a lower sweat pH. Four groups (15 girls, 18 boys, 8 women,
8 men) cycled in the heat (42ºC, 20% relative humidity) at 50% VO2max for two 20-min bouts with a 10-min rest before bout 1 and
between bouts. Sweat was collected into plastic bags attached to the subject’s lower back. During bout 1, sweat from girls and boys had higher Lac- concentrations (23.6 ± 1.2 and 21.2 ± 1.7 mM; P < 0.05)
than sweat from women and men (18.2 ± 1.9 and 14.8 ± 1.6 mM, respectively), but Lac- was weakly associated with SR (P > 0.05; r =
-0.27). Sweat Lac- concentration dropped during exercise bout 2,
reaching similar levels among all groups (overall mean = 13.7 ± 0.4 mM). Children had a higher sweat NH3 than adults during bout 1 (girls
= 4.2 ± 0.4, boys = 4.6 ± 0.6, women = 2.7 ± 0.2, and men = 3.0 ± 0.2 mM; P < 0.05). This difference persisted through bout 2 only in females. On average, children’s sweat pH was lower than that of adults (mean ± SEM, girls = 5.4 ± 0.2, boys = 5.0 ± 0.1, women = 6.2 ± 0.5, and men = 6.2 ± 0.4 for bout 1, and girls = 5.4 ± 0.2, boys = 6.5 ± 0.5, women = 5.2 ± 0.2, and men = 6.9 ± 0.4 for bout 2). This may have favored NH3 transport from plasma to sweat as accounted for by a
significant correlation between sweat NH3 and H+ (r = 0.56). Blood pH
increased from rest (mean ± SEM; 7.3 ± 0.02) to the end of exercise (7.4 ± 0.01) without differences among groups. These results, how-ever, are representative of sweat induced by moderate exercise in the absence of acidosis.
Correspondence
O. Laitano
Laboratório de Pesquisa do Exercício Escola de Educação Física, UFRGS Rua Felizardo, 750
90690-200 Porto Alegre, RS Brasil
E-mail: [email protected]
Research supported by a grant from the Gatorade Sports Science Institute. F. Meyer was the recipient of a fellowship from CNPq.
Received November 10, 2005 Accepted July 12, 2006
Key words
•Sweat pH •Electrolytes •Ammonia •Lactate
Introduction
During prolonged exercise in the heat, two major solutes excreted in sweat are lac-tate (Lac-) and ammonia (NH
3), whose
re-spective concentrations are 10-15 and 80-150 times greater than those in plasma (1). The Lac- in sweat is derived mainly from
from the sweat gland itself or by diffusion from plasma (1,5,6).
The widely reported variability in sweat Lac- and NH
3 may be accounted for by their
dependence on factors such as sweating rate (SR), sweat acidity, and the transport of other ions in the duct of the sweat gland. These factors may in turn determine the concentration of a person’s sweat Lac- and
NH3. For example, SR was shown to
in-versely correlate with sweat Lac- (7,8).
Lamont (8) detected very high sweat Lac
-(43-100 mM) in women and suggested that this reflects women’s lower SR. Controlled studies found no gender differences in SR in either adults (9) or children (10). However, males had a higher SR when corrected for surface area and compared with females (11). Thus, based on SR alone, it is unlikely that sweat Lac- would be different between
gen-ders. Because SR has been shown to in-crease with maturation, we hypothesized that sweat Lac- should be higher in children than
in adults. Indeed, sweat Lac- has already
been demonstrated to be higher in prepubes-cent than in late-pubesprepubes-cent boys at the first 20 min of moderate exercise (50% VO2max)
(7). It is not known whether this difference persists through adulthood.
Much less is known about inter-individual differences in sweat NH3 during exercise.
NH3 transport between water compartments
depends on the pH gradient, moving to-wards the lower pH. It has been shown (1,12) that sweat pH is lower (5 to 7) than blood pH.
Whether sweat pH differs between children and adults during exercise has not yet been demonstrated. One might predict that sweat pH would be lower in children than in adults for two reasons: the expected higher sweat Lac- in children and the increase of pH with
SR (13,14). One possible way to prevent very low levels of sweat pH is to increase its NH3 content. Therefore, we hypothesized
that a lower sweat pH in children would be accompanied by a higher sweat NH3.
The main purpose of the present study was to compare sweat Lac- and NH
3 and
their respective losses among four groups (girls, boys, women, and men) that exer-cised intermittently (1 h) at the same relative intensity (50% VO2max) and under the same
environmental conditions.
Subjects and Methods
Subjects
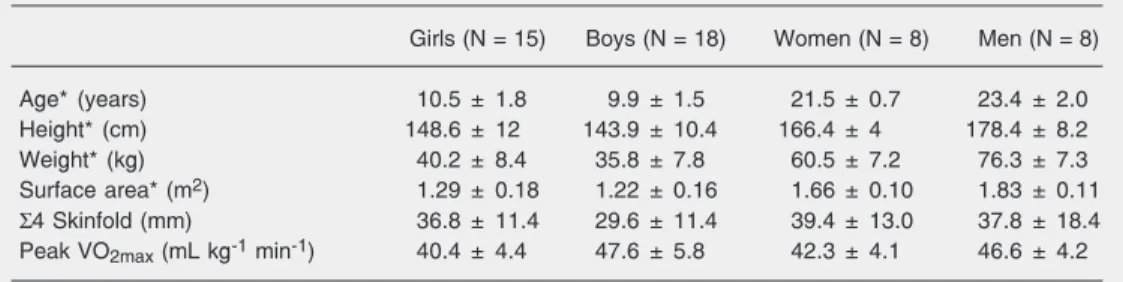
Forty-nine subjects (15 girls, 8 women, 18 boys, and 8 men) were included in the study and signed an informed consent term. Their physical characteristics are shown in Table 1. Seventeen children out of a total of 33 were prepubescent and 16 (8 girl and 8 boys) were at the beginning or in the middle of puberty. All subjects were healthy as determined by a medical interview and a physical examina-tion. Experiments took place during the late fall and winter in Ontario, Canada, suggesting that subjects were not acclimatized to the heat.
Table 1. Physical and physiological characteristics of the subjects.
Girls (N = 15) Boys (N = 18) Women (N = 8) Men (N = 8)
Age* (years) 10.5 ± 1.8 9.9 ± 1.5 21.5 ± 0.7 23.4 ± 2.0 Height* (cm) 148.6 ± 12 143.9 ± 10.4 166.4 ± 4 178.4 ± 8.2 Weight* (kg) 40.2 ± 8.4 35.8 ± 7.8 60.5 ± 7.2 76.3 ± 7.3 Surface area* (m2) 1.29 ± 0.18 1.22 ± 0.16 1.66 ± 0.10 1.83 ± 0.11 Σ4 Skinfold (mm) 36.8 ± 11.4 29.6 ± 11.4 39.4 ± 13.0 37.8 ± 18.4 Peak VO2max (mL kg-1 min-1) 40.4 ± 4.4 47.6 ± 5.8 42.3 ± 4.1 46.6 ± 4.2
Data are reported as mean ± SD.
The McMaster University Ethics Committee approved this study.
Procedures and protocols
Prior to the experimental session, sub-jects came to the laboratory for anthropo-metric and peak VO2 tests. Weight and height
were measured, and body surface area (in m2) was calculated by the formula of DuBois
and DuBois (15) (body surface area = 0.20247 x height (m)0.725 x body mass
(kg)0.425. Adiposity was calculated by
sum-ming 4 skinfolds (triceps, biceps, subscapu-lar, and suprailiac) measured in triplicate with a Harpenden caliper. Peak VO2 was
assessed by adopting a continuous progres-sive (2-min stages) protocol on a cycle ergo-meter, at a constant cadence of 50 rpm, in a thermoneutral environment. The test was terminated upon subject’s volitional exhaus-tion or when the target cadence could not be maintained. VO2 was measured with an
open-circuit spirometer with respiratory gases an-alyzed through an automated system (Beck-man-Horizon Metabolic Cart, Anaheim, CA, USA).
On the day of the in-chamber trial, sub-jects were advised to come to the laboratory having abstained from drinking alcohol for 48 h, caffeine for 8 h, and from exercising in the previous 2 h. Subjects were encouraged to drink large volumes of water on this day and, upon arrival in the laboratory, they were given 150-250 mL of water to reduce the likelihood of hypohydration. Before en-tering the chamber (40-42ºC and 18-20% relative humidity), subjects voided and dressed in shorts and sports shoes, plus bi-kini tops for females.
In the chamber, subjects cycled (Monark, Varberg, Sweden) for two 20-min bouts at 50% of their predetermined peak VO2, with
a 10-min rest before bout 1 and between bouts. VO2 was measured in the middle of
bout 2. Heart rate (Sport Tester PE3000 system, Kempele, Finland) and rectal
tem-perature (YSI 400 series, Yellow Springs, OH, USA) were measured continuously. Subjects were kept euhydrated by drinking cool (8-12ºC) water throughout the session. Hydration state was checked by weighing subjects before and after bout 1, and at the end of the session using a Mott electroscale LC2424, ± 20 g accuracy (Brantford, Ontario, Canada).
Sampling and analysis of sweat and blood
To guarantee enough volume, sweat was collected into two plastic bags (one in each side) attached to the subjects’ lower back as previously described (7,10). The format of the plastic bag was such that the skin area covered was equivalent in children and adults. Once collected, the sample was stored in microtubes and frozen (-4ºC) until bio-chemical analysis. A separate sample was frozen at -70ºC for the pH and NH3
determi-nation.
Sweat Lac- was determined using the
Yellow Springs Instrument analyzer (model 23L; Yellow Springs, OH, USA), NH3 was
determined by spectrophotometry using a colorimetric assay (Sigma 70-UV, St. Louis, MO, USA), and osmolality by freezing point depression (Model 3M0, Needham Heights, MA, USA). Sweat Na+ and K+ were
meas-ured using ion selective electrodes (Kodak Ektachem Analyzer 700XR, Rochester, NY, USA) and Cl- was measured with a
Buchler-Cotlover chloridometer (Kansas City, MO, USA). Sweat pH was determined using Ra-diometer pH -(g2040c) and reference (K4040) electrodes coupled to a Radiometer PHu62 pH meter (Hamilton, Ontario, Ca-nada).
collec-tion. Using a 21-gauge butterfly, blood was collected (6 mL) from a vein of the dorsum of the hand, without stasis, into a blood gas syringe and into two vacutainers containing lithium heparin and EDTA. The blood col-lected anaerobically into a syringe was freed from air bubbles, sealed, and kept on ice until determination (within 1 h) of blood gases, HCO3, and pH (AVL 995/Blood Gas
Analyzer with H+, O
2 and CO2 electrodes;
Roswel, GA, USA). Blood Lac- was
ana-lyzed immediately (model 23L, Yellow Springs Instruments) in the sample from one of the vacutainers (lithium heparin). Blood was then centrifuged and the plasma was kept on ice for later analysis. Plasma electro-lyte concentrations were measured using ion selective electrodes (Kodak Ektachem Ana-lyzer 700XR), protein was measured by re-fractometry, and osmolality was measured by freezing point depression (model 3MO). The blood sample collected into EDTA vacutainers was used for hematocrit and he-moglobin determination (Coulter-Counter, Model S-plus STKR; Miami, FL, USA).
Calculations
Sweating rate was calculated from the differences in nude body weight obtained before and immediately after the experi-ment, corrected for fluid intake, respiratory water loss (16), and urine volume and cor-rected for surface area (m2) and time (min).
Sweat lactate and NH3 losses were
calcu-lated by multiplying the volume of total body sweat by its respective concentration. Hydration level was calculated by the change in body weight and expressed as percent initial body weight, corrected for urine out-put and change in clothes weight. Percent changes in plasma volume (%∆PV) and red blood cell volume (%∆RBC) were calcu-lated from changes in hemoglobin and hem-atocrit (17). Exercise blood Lac- was
cor-rected for %∆PV. Sweat pH was converted to the equivalent free hydrogen ion (H+).
Plasma and sweat strong ion difference (SID) were calculated as Na+ + K+ - Cl- - Lac- and
Na+ + K+ + NH
3 - Cl- - Lac-, respectively.
Statistical analysis
Within genders, prepubescent and pu-bescent subjects were found to be similar with respect to all sweat and blood param-eters, as determined by two-way analysis of variance (ANOVA). The children were there-fore pooled into two groups: boys and girls. ANOVA was used to compare children vs adults and females vs males. Two-way ANOVA was used to examine changes with time (e.g., bout 1 vs bout 2). Statistical sig-nificance was considered when P < 0.05. Data are reported as means ± SEM.
Results
Physiological responses
The mean increase in rectal temperature (ºC) from rest to the end of bout 2 did not differ among groups: 0.90 ± 0.08 (girls), 0.83 ± 0.08 (boys), 0.75 ± 0.11 (women), and 0.81 ± 0.07 (men). Heart rate (bpm) at the end of bout 2 was similar among groups: 165 ± 4 (girls), 162 ± 7 (boys), 162 ± 6 (women), 159 ± 8 (men). By the end of bout 2, most subjects maintained their hydration levels within 1% of initial body weight (range = -0.6 to 0.8%). The mean ± SEM percent change in body weight per group was 0.11 ± 0.09 (girls), 0.01 ± 0.11 (boys), -0.09 ± 0.3 (women), -0.19 ± 0.02 (men).
Sweat composition
Children had 25% higher sweat Lac- than
their counterparts after bout 1 (P < 0.05; Table 2). In each group there was a drop in sweat Lac- from bout 1 to bout 2, and all
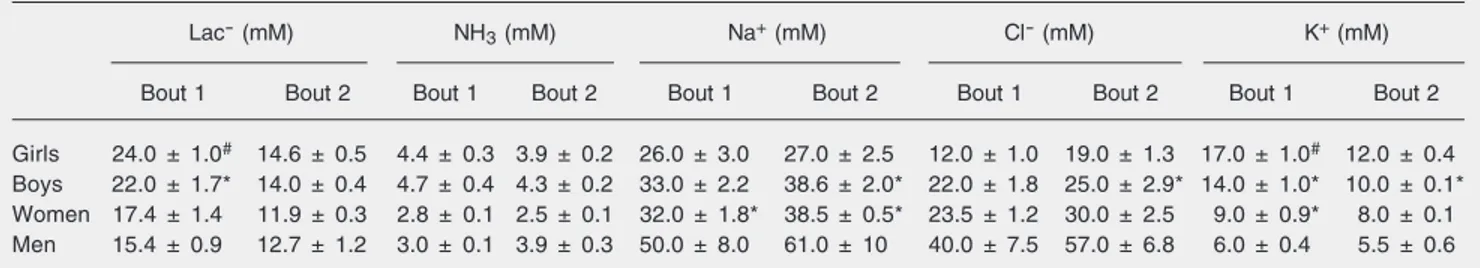
Table 2. Sweat lactate (Lac-), ammonia (NH
3), sodium (Na+), chloride (Cl-), and potassium (K+) concentrations.
Lac- (mM) NH3 (mM) Na+ (mM) Cl- (mM) K+ (mM)
Bout 1 Bout 2 Bout 1 Bout 2 Bout 1 Bout 2 Bout 1 Bout 2 Bout 1 Bout 2
Girls 24.0 ± 1.0# 14.6 ± 0.5 4.4 ± 0.3 3.9 ± 0.2 26.0 ± 3.0 27.0 ± 2.5 12.0 ± 1.0 19.0 ± 1.3 17.0 ± 1.0# 12.0 ± 0.4
Boys 22.0 ± 1.7* 14.0 ± 0.4 4.7 ± 0.4 4.3 ± 0.2 33.0 ± 2.2 38.6 ± 2.0* 22.0 ± 1.8 25.0 ± 2.9* 14.0 ± 1.0* 10.0 ± 0.1* Women 17.4 ± 1.4 11.9 ± 0.3 2.8 ± 0.1 2.5 ± 0.1 32.0 ± 1.8* 38.5 ± 0.5* 23.5 ± 1.2 30.0 ± 2.5 9.0 ± 0.9* 8.0 ± 0.1 Men 15.4 ± 0.9 12.7 ± 1.2 3.0 ± 0.1 3.9 ± 0.3 50.0 ± 8.0 61.0 ± 10 40.0 ± 7.5 57.0 ± 6.8 6.0 ± 0.4 5.5 ± 0.6
Data are reported as means ± SEM.
*P < 0.05 compared to men (within bouts) (ANOVA). #P < 0.05 compared to women (within bouts) (ANOVA). Lac- decreased from bout 1 to bout
2 in all groups (P < 0.05, two-way ANOVA). Cl- increased in men and K+ decreased in girls and boys from bout 1 to bout 2 (P < 0.05, two-way
ANOVA).
gender difference in sweat Lac-. Mean sweat
NH3 after bout 1 was 66% higher in children
than in adults. Although sweat NH3 did not
change significantly with time in any group, opposite trends among groups resulted in men having similar values to boys but higher than women (Table 2). The total sweat losses of Lac- were higher in adults than in
chil-dren, but similar among groups when cor-rected for kg body mass (Table 3). A similar trend was found for total NH3. Men had a
higher sweat Na+ and Cl- compared to the
other groups. Men’s sweat Cl- increased from
bout 1 to bout 2 (Table 2). Girls and boys had higher K+ than their adult counterparts in
bout 1. Overall, sweat SID was similar among groups with one exception: at bout 2, it was higher in boys than in men. Sweat H+ was
lower in men compared to boys during bouts 1 and 2, and compared to women during bout 2 (Table 4). The lower sweat H+ of
women compared with girls was close to being statistically significant (P = 0.07 in bout 1, and P = 0.06 in bout 2). Sweat pH during both bouts was lower in girls and boys compared to their adult counterparts. The respective means ± SEM were 5.4 ± 0.2 (girls), 5.0 ± 0.1 (boys), 6.2 ± 0.5 (women), and 6.2 ± 0.4 (men) for bout 1, and 5.4 ± 0.2 (girls), 6.5 ± 0.5 (boys), 5.2 ± 0.2 (women), and 6.9 ± 0.4 (men) for bout 2.
While sweat osmolality decreased in boys and girls (P < 0.05), it did not change in men
and women (Table 4). SR was consistently lower in girls and boys compared to their respective adult group (Table 4).
Blood results
Blood pH at rest was similar among groups, while at the end of exercise it was higher in girls than in women (Table 5). However, the magnitude of the changes in blood pH, HCO3-, and PCO2 was similar
among the four groups (Table 5). Overall there was an increase in blood pH and a decrease in HCO3- and PCO2. When changes
within groups were analyzed, significant dif-ferences (P < 0.05) were found in all groups for blood PCO2, but not for pH or HCO3
-(Table 5). While blood Lac- increased in
men, it decreased in boys and did not change in the female groups.
Plasma osmolality and RBC volume did not change from rest to the end of the exercise session. There was a decrease in PV and an increase in plasma proteins in all groups, with these changes being significantly greater in adults (P < 0.05; Table 6). There was no change in plasma Na+ or Cl- from rest to the
end of the exercise session in any of the groups, while plasma K+ increased on average by 12%
Table 4. Sweat hydrogen (H+), strong ion difference (SID), osmolality, and sweating rate (SR).
H+ (mM) SID (mM) Osmolality (mOsm/kg) SR (mL m2 min-1)
Bout 1 Bout 2 Bout 1 Bout 2 Bout 1 Bout 2 Bout 1 Bout 2
Girls 8.0± 3.0 10.0±1.0 9.8± 4.0 9.6±3.0 119.0±3.2 99.0± 3.0 2.8±0.7# 4.2± 0.6#
Boys 15.0± 3.2 13.0±2.3 9.7± 3.0 14.0±2.0* 128.0±11.8 118.0± 7.4 3.0±0.1* 4.7± 0.02* Women 4.0± 1.2 3.8±1.4 4.0± 1.7 4.3±1.8 93.0±3.4* 105.0± 6.2 6.2±0.8 6.4± 0.8 Men 3.0± 1.2 2.5±1.0 4.2± 1.6 1.2±8.0 133.0±21.0 141.0± 15.3 6.5±0.7 8.0± 0.7
Data are reported as mean ± SEM.
*P < 0.05 compared to men (within bouts) (ANOVA). #P < 0.05 compared to women (within bouts) (ANOVA).
Osmolality decreased from bout 1 to bout 2 in girls and boys (P < 0.05, two-way ANOVA).
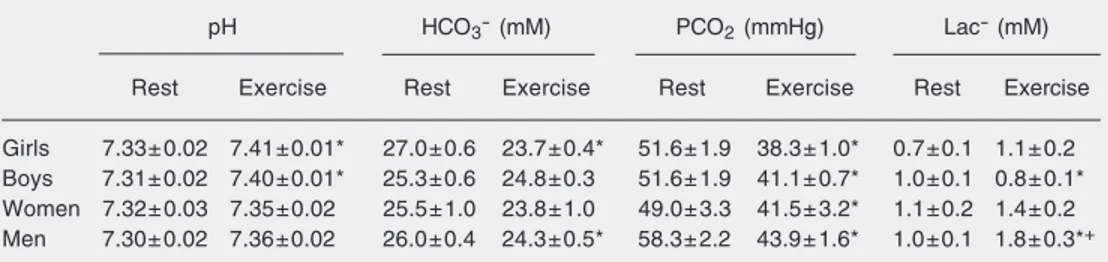
Table 5. Blood pH, HCO3-, PCO2, and lactate (Lac-) at rest and at the end of the whole exercise session.
pH HCO3- (mM) PCO2 (mmHg) Lac- (mM)
Rest Exercise Rest Exercise Rest Exercise Rest Exercise
Girls 7.33± 0.02 7.41±0.01* 27.0±0.6 23.7±0.4* 51.6± 1.9 38.3± 1.0* 0.7±0.1 1.1± 0.2 Boys 7.31± 0.02 7.40±0.01* 25.3±0.6 24.8±0.3 51.6± 1.9 41.1± 0.7* 1.0±0.1 0.8± 0.1* Women 7.32± 0.03 7.35±0.02 25.5±1.0 23.8±1.0 49.0± 3.3 41.5± 3.2* 1.1±0.2 1.4± 0.2 Men 7.30± 0.02 7.36±0.02 26.0±0.4 24.3±0.5* 58.3± 2.2 43.9± 1.6* 1.0±0.1 1.8± 0.3*+
Data are reported as mean ± SEM.
*P < 0.05 compared to the respective resting values (two-way ANOVA); +P < 0.05 compared to boys (ANOVA).
Table 3. Total sweat lactate and ammonia losses throughout the whole exercise session (bout 1 + bout 2).
Lactate (mM) Lactate (mM kg-1 h-1) Ammonia (mM) Ammonia (mM kg-1 h-1)
Girls 5.45 ± 0.94* 0.13 ± 0.02 1.11 ± 0.17 0.026 ± 0.003 Boys 4.83 ± 0.54* 0.15 ± 0.02 1.33 ± 0.14* 0.022 ± 0.004 Women 9.22 ± 1.36 0.15 ± 0.02 1.35 ± 0.17 0.037 ± 0.002 Men 11.40 ± 2.30 0.14 ± 0.03 2.35 ± 0.46 0.032 ± 0.006
Data are reported as mean ± SD. Values are also corrected for body weight (kg) and time (h). *P < 0.05 compared to the respective adult group (ANOVA).
Table 6. Changes in plasma volume (∆PV), red blood cells (∆RBC), plasma protein (∆Protein), and osmolality (∆Osmolality) from rest to the end of exercise.
∆PV* ∆RBC ∆Protein* ∆Osmolality
Girls -3.6 ± 1.4%+ 0.08 ± 0.5% 4.62 ± 0.9%+ 0.09 ± 0.6%
Boys -2.3 ± 0.4%+ 0.32 ± 0.4% 2.15 ± 1.0%+ 0.62 ± 0.8%
Women -8.8 ± 0.7% -1.25 ± 0.9% 9.22 ± 1.4% 0.95 ± 0.6%
Men -8.6 ± 2.0% -0.09 ± 0.4% 9.97 ± 1.2% 0.94 ± 0.6%
Data are reported in percent as means ± SEM.
*Significant differences within each group (P < 0.05, ANOVA); +P < 0.05 compared to the respective adult
among children and adults of both genders. Although children’s sweat Lac- after bout
1 was higher than that of adults, this cannot be accounted for by their lower SR. We found a negative but very weak association between SR and sweat Lac- (P > 0.05, r = -0.27, for all
subjects). Such a relationship is not consistent since some investigators have reported an in-verse correlation (7,8,24), while studies using single sweat glands have shown a significant positive correlation (14), or none at all (13).
It is unclear why children have higher sweat Lac- at the beginning of exercise. One
possibility is that the energy required for the onset of sweating is higher than that required to maintain sweating. The higher sweat Lac
-in children at the start of exercise may be due to their higher sweating threshold (25,26). Timing for sweat collection was the same for all subjects and was set according to exer-cise duration, which may not necessarily match sweating duration. This time lag could be responsible for the higher sweat Lac- at
the start of exercise.
It is difficult to state whether the sweat glands of children respond with a greater gly-colytic rate at the start of exercise. Sweat Lac
-may not be an accurate index of glycolytic rate of the sweat gland since some Lac-, in
con-junction with other ions or in exchange with H+, is reabsorbed in the sweat duct (14,27).
A consistent finding of the present study was that Lac- dropped with exercise duration,
which is in agreement with other studies in which subjects cycled at constant work rates (7,11,18,28,29). The drop in sweat Lac- could
be due to the fact that, besides glycolysis, the sweat gland uses oxygen (oxidative phospho-rylation) as a substrate for sweating (4,30). At the start of exercise, the vasoconstrictive ef-fect of epinephrine release and reduced oxy-gen supply to the skin may cause the sweat glands to rely more on anaerobic glycolysis and produce more Lac-. As exercise
contin-ues, especially in a warm environment, more blood is shunted to the skin, thus allowing the sweat glands to work more aerobically.
Discussion
The main purpose of the present study was to compare sweat Lac- and NH
3, and their
respective losses, between children and adults of both genders during one hour of intermit-tent exercise (50% peak VO2) in the heat. Girls
and boys had a higher sweat Lac- and NH 3
compared to their adult counterparts within 20 min of the beginning of exercise. Thereafter, this difference persisted in females for NH3
only. During this later stage of the session, men had higher sweat NH3 than women. This
was the only gender difference found within age groups. The total sweat Lac- and NH
3
losses, corrected per kg body mass, were simi-lar among groups. To our knowledge, this was the first study that compared the four groups under the same conditions.
The overall sweat Lac- of the boys (16.6
mM) and men (15.1 mM) in the present study agrees with those reported for boys (7) and men (6,11,18) performing similar exer-cise protocols. The mean sweat Lac- of
women (14.3 mM) in the present study, how-ever, was much lower than that of sedentary (100 mM) or fit (43 mM) women (8). The method of collecting sweat (plastic bags vs whole body washdown) and the exercise intensity (50 vs 70% VO2max) may have ac-counted for the difference. Although sweat collected with bags represents only one site of the body, it is a reliable (19) method and involves the least contamination (20). Un-less the investigator is very familiar with the procedures, the whole-body washdown is prone to errors and, whenever used, its reli-ability should be reported (21-23).
Sweat Lac- at the beginning of exercise
has been found to be higher in prepubertal than in adolescent boys (7). Green et al. (11) found that males have higher sweat lactate than females. Our findings were that, at this early stage of sweating, boys have a higher sweat Lac- than men and that corresponding
-Sweat NH3 has rarely been studied during
exercise. In the present study, the men’s aver-age sweat NH3 (3.3 mM) was somewhat higher
than that found when men cycled at 40% (2.1 mM), but much lower than that obtained at a higher exercise intensity (7.1 mM at 80% VO2max) (6). This further indicates that sweat
NH3 increases with exercise intensity.
As expected, children had a higher sweat NH3 in the first bout, and this can reflect a
mechanism for avoiding further decrease in sweat pH. NH3 diffusion is facilitated by an
increased pH gradient between compart-ments. NH3, as a base, diffuses from the
extracellular space (higher pH) to the sweat gland duct (lower pH) where, once proto-nated to NH4+, it becomes poorly diffusible
(1,5). Indeed, the children in the present study had a lower sweat pH than adults (5.2 vs 6.1 for bout 1; 5.3 vs 6.7 for bout 2) and, at least at the end of bout 2, they tended to have a higher blood pH (Table 5). To sup-port this hypothesis, we found a significant and positive correlation between sweat NH3
and H+ for all the subjects combined (r =
0.56), in agreement with other studies (5,31). Although some sweat NH3 may originate
from plasma, it is unlikely that the higher sweat NH3 of children in this study was a
reflection of their greater plasma NH3. At rest,
plasma NH3 in children is similar to that of
adults (32) and, in response to exercise (tread-mill VO2max test), the magnitude of its increase
may even be higher in adults than in children (33).
The mechanisms involved in sweat acidi-fication are not known. It was suggested that the duct acidifies the precursor sweat by reabsorbing HCO3- and/or secreting H+ in
exchange of Na+ (34,35). In the present study,
overall sweat Na+ was inversely correlated
with sweat H+ (r = -0.45, P < 0.05), but r
values were greater in children than in adults (-0.43 vs -0.29). This indicates that lower sweat pH in children may be associated with their greater Na+ reabsorption.
The average sweat SID (7 mM) in the
present study was much lower than that of plasma (37.6 mM). Our values are close to those already reported in men as “residual ions” (14), even though our calculations in-cluded ammonia. We did not find a strong inverse correlation between sweat H+ and sweat
SID (r = 0.1). This is probably due to a lower and small range of sweat (SID). Besides SID, the H+ (or acid-base status) of a solution
de-pends on two other variables: PCO2 and weak
anions (mostly proteins). In fact, when SID is around zero, very small changes in PCO2 may
cause a big change in pH (and H+) (36). On the
other hand, proteins do not affect sweat H+
because of their low concentration in sweat (2 mg/dL vs 7 g/dL in blood) (1).
Our finding that blood pH did not change over time in men is in agreement with a study that used a similar exercise/heat protocol (37). Although in children an increase in blood pH achieved significance, the pH changes among groups were similar. This is somewhat diver-gent from high intensity exercise in which a fall in blood pH is considerably greater in adults than in children (38). The overall de-crease in blood pH in the present study may be due to increased ventilation (as shown by the PCO2 decrease) and increased skin blood flow
(perfusion), both promoted by increased body temperature (39).
We have shown that children present a higher sweat Lac- and NH
3 compared to adults
during the first 20 min of exercise in the heat. Within one hour of exercise, the overall sweat losses of Lac- and NH
3 corrected per kg body
mass were similar among groups. These re-sults are representative of an exercise plus heat stress that was too low to induce fatigue or blood acidosis. The extent to which such a pattern will persist during exercise-induced acidosis has yet to be determined.
Acknowledgments
References
1. Sato K, Kang WH, Saga K, Sato KT. Biology of sweat glands and their disorders. I. Normal sweat gland function. J Am Acad Dermatol
1989; 20: 537-563.
2. Gordon RS Jr, Thompson RH, Muenzer J, Thrasher D. Sweat lac-tate in man is derived from blood glucose. J Appl Physiol 1971; 31: 713-716.
3. Sato K, Dobson RL. Glucose metabolism of the isolated eccrine sweat gland. II. The relation between glucose metabolism and so-dium transport. J Clin Invest 1973; 52: 2166-2174.
4. Sato K. The physiology, pharmacology, and biochemistry of the eccrine sweat gland. Rev Physiol Biochem Pharmacol 1977; 79: 51-131.
5. Brusilow SW, Gordes EH. Ammonia secretion in sweat. Am J Physiol
1968; 214: 513-517.
6. Czarnowski D, Gorski J. Sweat ammonia excretion during submaxi-mal cycling exercise. J Appl Physiol 1991; 70: 371-374.
7. Falk B, Bar-Or O, MacDougall JD, McGillis L, Calvert R, Meyer F. Sweat lactate in exercising children and adolescents of varying physical maturity. J Appl Physiol 1991; 71: 1735-1740.
8. Lamont LS. Sweat lactate secretion during exercise in relation to women’s aerobic capacity. J Appl Physiol 1987; 62: 194-198. 9. Buono MJ, Sjoholm NT. Effect of physical training on peripheral
sweat production. J Appl Physiol 1988; 65: 811-814.
10. Meyer F, Bar-Or O, MacDougall D, Heigenhauser GJ. Sweat elec-trolyte loss during exercise in the heat: effects of gender and matu-ration. Med Sci Sports Exerc 1992; 24: 776-781.
11. Green JM, Bishop PA, Muir IH, McLester JR Jr, Heath HE. Effects of high and low blood lactate concentrations on sweat lactate re-sponse. Int J Sports Med 2000; 21: 556-560.
12. Yuan Y, Chan KM. A review of the literature on the application of blood ammonia measurement in sports science. Res Q Exerc Sport
2000; 71: 145-151.
13. Kaiser D, Songo-Williams R, Drack E. Hydrogen ion and electrolyte excretion of the single human sweat gland. Pflugers Arch 1974; 349: 63-72.
14. Bijman J, Quinton PM. Lactate and bicarbonate uptake in the sweat duct of cystic fibrosis and normal subjects. Pediatr Res 1987; 21: 79-82.
15. DuBois D, DuBois EF. Clinical calorimetry: a formula to estimate the approximate surface area if height and weight be known. Arch Intern Med 1916; 17: 863-871.
16. Mitchell JW, Nadel ER, Stolwijk JA. Respiratory weight losses dur-ing exercise. J Appl Physiol 1972; 32: 474-476.
17. Harrison MH. Effects of thermal stress and exercise on blood vol-ume in humans. Physiol Rev 1985; 65: 149-209.
18. Fellmann N, Grizard G, Coudert J. Human frontal sweat rate and lactate concentration during heat exposure and exercise. J Appl Physiol 1983; 54: 355-360.
19. Calvert R, Bar-Or O, Meyer F, Falk B, Blimkie CJ. A modified, disposable and reliable sweat collection device for use in adults and children during exercise in the heat. Med Sci Sports Exerc 2006; 22: S89 (Abstract).
20. Sato K, Sato F. Methods for studying eccrine sweat gland function in
vivo and in vitro. Methods Enzymol 1990; 192: 583-599.
21. Lemon PW, Yarasheski KE, Dolny DG. Validity/reliability of sweat analysis by whole-body washdown vs regional collections. J Appl Physiol 1986; 61: 1967-1971.
22. Shirreffs SM, Maughan RJ. Whole body sweat collection in humans: an improved method with preliminary data on electrolyte content. J Appl Physiol 1997; 82: 336-341.
23. Patterson MJ, Galloway SD, Nimmo MA. Variations in regional sweat composition in normal human males. Exp Physiol 2000; 85: 869-875.
24. Fellmann N, Labbe A, Gachon AM, Coudert J. Thermal sweat lac-tate in cystic fibrosis and in normal children. Eur J Appl Physiol Occup Physiol 1985; 54: 511-516.
25. Araki T, Toda Y, Matsushita K, Tsujino A. Age differences in sweat-ing dursweat-ing muscular exercise. Jpn J Phys Fitness Sports Med 1979; 28: 239-248.
26. Wagner JA, Robinson S, Tzankoff SP, Marino RP. Heat tolerance and acclimatization to work in the heat in relation to age. J Appl Physiol 1972; 33: 616-622.
27. Bijman J, Quinton PM. Influence of abnormal Cl- impermeability on sweating in cystic fibrosis. Am J Physiol 1984; 247: C3-C9. 28. Green JM, Pritchett RC, Tucker DC, Crews TR, McLester JR. Sweat
lactate response during cycling at 30 degrees C and 18 degrees C WBGT. J Sports Sci 2004; 22: 321-327.
29. Green JM, Pritchett RC, Crews TR, McLester JR Jr, Tucker DC. Sweat lactate response between males with high and low aerobic fitness. Eur J Appl Physiol 2004; 91: 1-6.
30. Fellmann N, Fabry R, Coudert J. Calf sweat lactate in peripheral arterial occlusive disease. Am J Physiol 1989; 257: H395-H398. 31. Morimoto T, Johnson RE. Ammonia and the regulation of acidity in
human eccrine sweat. Nature 1967; 216: 813-814.
32. Colombo JP, Peheim E, Kretschmer R, Dauwalder H, Sidiropoulos D. Plasma ammonia concentrations in newborns and children. Clin Chim Acta 1984; 138: 283-291.
33. Nazar K, Dobrzynski B, Lewicki R. Relationship between plasma ammonia and blood lactate concentrations after maximal treadmill exercise in circumpubertal girls and boys. Eur J Appl Physiol Occup Physiol 1992; 65: 246-250.
34. Quinton PM. Suggestion of an abnormal anion exchange mechan-ism in sweat glands of cystic fibrosis patients. Pediatr Res 1982; 16: 533-537.
35. Quinton PM. Sweating and its disorders. Annu Rev Med 1983; 34: 429-452.
36. Stewart PA. Modern quantitative acid-base chemistry. Can J Physiol Pharmacol 1983; 61: 1444-1461.
37. Sawka MN, Knowlton RG, Glaser RM. Body temperature, respira-tion, and acid-base equilibrium during prolonged running. Med Sci Sports Exerc 1980; 12: 370-374.
38. Zanconato S, Buchthal S, Barstow TJ, Cooper DM. 31P-magnetic
resonance spectroscopy of leg muscle metabolism during exercise in children and adults. J Appl Physiol 1993; 74: 2214-2218. 39. Senay LC Jr, Christensen ML. Respiration of dehydrating men