197
ABSTRACT
Introduction: Physical activity raises body temperature, increases the sweat rate and accelerates fluid loss during exercise, thereby impairing exercise performance. However, studies using the high intensity interval training (HIIT) approach and its effects on rates of perspiration and hydration are still inconclusive. Objectives: The objective of this study was to assess sweating and water loss during an HIIT workout session, using body weight, with healthy college students. Methods: Twenty male individuals (31 ± 07 years) were split into two groups: Active group (AG) and Inactive group (IG). The HIIT workout protocol, using body weight, consisted of a single bout with 1:1 stimuli, being: 30” “all out” intensity, involving jumping jack, mountain climber, burpee and squat jump exercises; and 30” of passive recovery, totaling 20 minutes of exercises. For comparison purposes, after 48 hours all the individuals underwent the continuous running protocol with intensity corresponding to 75% of maximum heart rate for 40 minutes. The intensity of the session was monitored continuously, at each 30”, using the perceived exertion scale for both protocols. To ensure euhydration status, all individuals ingested 500 ml of water 120 minutes before the training session. Results: Significant differences (p= 0.01) were found in body mass after HIIT compared to the Moderate session in both Active (HIIT: -0.60 ± 0.29 kg, Moderate: -0.26 ± 0.12 kg) and Inactive (HIIT: -0.92 ± 0.30 kg, Moderate: -0.26 ± 0.26 kg) groups, however, no differences were found between groups. Absolute sweating rate values comparing moderate and HIIT single bout in Inactive (Moderate: 10.55 ± 10.59 ml/min; HIIT: 28.90 ± 13.88 ml/min) and Active (Moderate: 9.60 ± 4.52 ml/min; HIIT: 26.00 ± 15.06 ml/min) groups were different between types of exercise, but not between groups. Conclusions: The sweating rate is influenced by the intensity of the exercise, being higher after HIIT than after a moderate exercise session. However, the sweating rate variation is not affected by the subjects’ physical activity level. Level of Evidence II; Diagnostic studies-Investigating a diagnostic test.
Keywords:Physical exercise; High-Intensity interval training; Sweat.
RESUMO
Introdução: A prática de atividade física eleva a temperatura corporal, aumenta a taxa de sudorese e acelera a perda de líquidos durante o exercício, com consequente prejuízo no desempenho do exercício. Entretanto, os estudos que utilizam o método de treinamento intervalado de alta intensidade (HIIT) e seus efeitos sobre as taxas de suor e hidratação ainda não são conclusivos. Objetivos: O objetivo desse estudo consistiu em avaliar a sudorese e a perda de água durante uma sessão de HIIT, utilizando o peso corporal, em universitários saudáveis. Métodos: Vinte indivíduos (31 ± 07 anos) foram distribuídos em dois grupos: grupo ativo (GA) e grupo inativo (GI). O protocolo de HIIT utilizando o peso corporal consistiu em uma única sessão com estímulos 1:1, sendo: 30” com intensidade “all out”, utilizando os exercícios de polichinelo, mountain climber, burpee e squat jump com recuperação passiva de 30”, totalizando 20 minutos de exercícios. Para fins de comparação, após 48 horas todos os indivíduos foram submetidos ao protocolo de exercício contínuo com intensidade correspondente a 75% da frequência cardíaca máxima durante 40 minutos. A intensidade da sessão foi monitorada continuamente, a cada 30”, utilizando a escala de percepção de esforço para ambos protocolos. Para garantir o estado de normoidratação todos os indivíduos ingeriram 500 ml de água, 120 minutos antes da sessão de treinamento. Resultados: Foram encontradas diferenças significativas (p = 0,01) na massa corporal após a realização do protocolo HIIT quando comparada à sessão moderada tanto nos grupos ativos (HIIT: -0,60 ± 0,29 kg, Moderado: -0,26 ± 0,12 kg) como inativos (HIIT: -0,92 ± 0,30 kg, Moderado: -0,26 ± 0,26 kg), no entanto, não foram encontradas diferenças entre os grupos. Os valores absolutos da taxa de sudorese comparados às atividades moderadas e HIIT em uma única sessão tanto nos grupos inativos (Moderado: 10,55 ± 10,59 ml/min, HIIT: 28,90 ± 13,88 ml/min) como ativos (Moderado: 9,60 ± 4,52 ml/min, HIIT: 26,00 ± 15,06 ml/min) foram diferentes entre os tipos de exercício, mas não entre os grupos. Conclusões: A taxa de sudorese é influenciada pela intensidade do exercício, sendo maior após o HIIT do que após sessão de exercício moderada. Entretanto, a variação da taxa de
sudorese não é afetada pelo nível de atividade física dos indivíduos.Nível de Evidência II; Estudos diagnósticos -
Investigação de um exame para diagnóstico.
Descritores: Exercício físico; Treinamento intervalado de alta intensidade; Suor.
SWEAT RATE MEASUREMENTS AFTER HIGH INTENSITY
INTERVAL TRAINING USING BODY WEIGHT
TAXA DE SUDORESE APÓS TREINAMENTO INTERVALADO DE ALTA INTENSIDADE USANDO
PESO CORPORAL
TASA DE SUDORACIÓN DESPUÉS DE ENTRENAMIENTO POR INTERVALOS DE ALTA INTENSIDAD
USANDO PESO CORPORAL
Alexandre Fernandes Machado1
(Physical Education Professional) Alexandre Lopes Evangelista2
(Physical Education Professional) João Marcelo de Queiroz Miranda1,2
(Physical Education Professional) Cauê Vazquez La Scala Teixeira3,4
(Physical Education Professional) Gerson dos Santos Leite2
(Physical Education Professional) Roberta Luksevicius Rica1
(Physical Education Professional) Aylton Figueira Junior1
(Physical Education Professional) Julien Steven Baker5
(Physical Education Professional) Danilo Sales Bocalini6
(Physical Education Professional)
1. Universidade São Judas Tadeu, Department of Post-Graduation in Physical Education, São Paulo, SP, Brazil.
2. Universidade Nove de Julho, Department of Education, São Paulo, SP, Brazil.
3. Universidade Federal de São Paulo, Grupo de Estudos da Obesidade, Santos, SP, Brazil.
4. Faculdade Praia Grande, Faculdade de Educação Física, Praia Grande, SP, Brazil
5. University of the West of Scotland, Institute for Clinical Exercise and Health Science, Paisley, UK. 6. Universidade Federal do Espírito Santo, Laboratórios de Fisiologia Experimental e Bioquímica, Centro de Educação Física e Esporte, Vitória, ES, Brazil.
Correspondence:
Danilo Sales Bocalini. Rua Militão Barbosa de Lima, 132, Centro, São Bernardo do Campo, São Paulo, SP, Brazil. 09720-420.
ORIGINAL ARTICLE ARTIGO ORIGINAL
198
RESUMEN
Introducción: La práctica de actividad física eleva la temperatura corporal, aumenta la tasa de sudoración y acelera la pérdida de líquidos durante el ejercicio, con consiguiente perjuicio en el desempeño del ejercicio. Entretanto, los estudios que usan el método de entrenamiento por intervalos de alta intensidad (HIIT) y sus efectos en las tasas de sudor e hidratación aún no son conclusivos. Objetivos: El objetivo del estudio consistió en evaluar la sudoración y la pérdida de agua durante una sesión de HIIT, utilizando el peso corporal, en universitarios saludables. Métodos: Veinte individuos (31 ± 07 años) fueron distribuidos en dos grupos: grupo activo (GA) y grupo inactivo (GI). El protocolo de HIIT utilizando el peso corporal consistió en una única sesión con estímulos 1:1, siendo: 30” con intensidad “all out”, usando los ejercicios de jumping jack, mountain clim-ber, burpee y squat jump con recuperación pasiva de 30”, totalizando 20 minutos de ejercicios. Para fines de comparación, después de 48 horas todos los individuos fueron sometidos al protocolo de ejercicio continuo con intensidad correspondiente a 75% de la frecuencia cardiaca máxima durante 40 minutos. La intensidad de la sesión fue monitorizada continuamente, a cada 30”, utilizando la escala de percepción de esfuerzo para ambos protocolos. Para garantizar el estado de normohidratación, todos los individuos ingirieron 500 ml de agua 120 minutos antes de la sesión de entrenamiento. Resultados: Se encontraron diferencias significativas (p= 0,01) en la masa corporal después de la realización del protocolo HIIT cuando comparada a la sesión moderada tanto en los grupos activos (HIIT: -0,60 ± 0,29 kg, Moderado: -0,26 ± 0,12 kg) como inactivos (HIIT: -0,92 ± 0,30 kg, Moderado: -0,26 ± 0,26 kg), sin embargo, no se encontraron diferencias entre los grupos. Los valores absolutos de la tasa de sudoración comparados a las actividades moderadas e HIIT en una única se-sión tanto en los grupos inactivos (Moderado: 10,55 ± 10,59 ml/min, HIIT: 28,90 ± 13,88 ml/min) como activos (Moderado: 9,60 ± 4,52 ml/min, HIIT: 26,00 ± 15,06 ml/min) fueron diferentes entre los tipos de ejercicio, pero no entre los grupos. Conclusiones: La tasa de sudoración es influenciada por la intensidad del ejercicio, siendo mayor después del HIIT que después de sesión de ejercicio moderada. Entretanto, la variación de la tasa de
sudoración no es afectada por el nivel de actividad física de los individuos.Nivel de Evidencia II; Estudios
diagnósticos - Investigación de un examen para diagnóstico.
Descriptores: Ejercicio físico; Entrenamiento de intervalos de alta intensidad; Sudor.
Article received on 04/17/2017 accepted on 10/23/2017 DOI: http://dx.doi.org/10.1590/1517-869220182403178641
INTRODUCTION
The physical activity practice can increase body temperature in up 15 to 20 times in relation to the temperature in rest, due to the low body efficiency to use the energy for movement. Considering this and with the purpose to promote balance between thermogenesis and central heat dissipation, some thermoregulatory mechanisms are triggered to maintain body internal temperature seamless, protecting the body against overheating.1 Thus, the increase of body temperature raises
the sweating rate and, consequently, accelerates the fluid loss during the exercise. In this sense, there is a consensus in the literature2,3 that
previous hydration, as well as its maintenance during the exercise, is important to boost physical performance, due to the impairment that dehydration could promote.4
The physiologic effects of dehydration in exercise have been studied through the comparison of many physiologic responses in individuals with partial or total replacement during physical activity practice.5
Al-though the physiologic indicators assessment is related to the effort´s acute effect, the physical feat characteristics contribute to the perfor-mance level of the activity.6 Besides, body water loss could be associated
with the intensity, duration, proprieties and quantity of the outfits used during the practice.2
In this view, even though studies challenge its efficacy in some oc-casions,7 the high-intensity training in treadmill8 bicycle9 and using the
body´s weight10,11 has been used with the objective to improve levels
of physical fitness as well as health, due to its superiority in relation to moderate exercises.12-14
Nonetheless, studies using the HIIT approach and its effects on sweating and hydration rates are still non conclusive in the literature.
Being so, the aim of this study was to assess the sweating rate of a single HIIT session with body weight and running of moderate intensity with individuals with different levels of physical activity.
MATERIALS AND METHODS
After the approval of USJT research ethics committee (Nº 1738246) and signed an approved informed consent document, twenty healthy adult men (≥ 18 years), physically independent, freely participated in this study. The International Physical Activity Questionnaire (IPAQ) was used to estimate physical activity levels.15 All participants were interviewed
using the IPAQ short form. The questions were based on the preceding weeks´ physical activity levels, exploring the frequency and duration of physical activity including walking, moderate and vigorous physical exercise and sitting time. Individuals were considered active if they participated in physical activity for more than 150 minutes per week, and inactive if their participation levels were less than 150 minutes per week. After IPAQ´s analyse the subjects were distributed in inactive (n: 10) and active (n: 10) groups as per previously publication of our group.16 Exclusion criteria were: positive clinical diagnosis of diabetes
mellitus, smoker and musculoskeletal complications and/or cardiovas-cular alterations confirmed by medical evaluation.
An single acute bout high-intensity interval training based on whole body exercise was performed according to previoulslly publication of our group17 in a session and involved 2 min warm-up followed by 20
199 The acute single bout moderate session consisted of 40 min of
run-ning at a moderate intensity, which was calculated at 75% of maximal heart rate. Maximum heart rate was calculated according to the Karvo-nen’s equation. The heart rate was monitored by a heart rate monitor (RS800CX; Polar Electro Ltd.) with a chest strap. Participants were able to monitor their current heart rate and were asked to maintain constant exercise intensity at their calculated heart rate.
Anthropometric and sweat rate measurements
Height was measured by a Cardiomed (WCS model) stadiometer, with an accuracy of 115/220 cm. The measurement was performed with the cursor at an angle of 90° in relation to the scale, with the individual in a standing position, keeping feet together in contact with Stadiometer. The subjects were instructed to stay in inspira-tory apnea, and head parallels to the ground. Total body mass was measured by a calibrated Filizola electronic scale (Personal Line Model 150) with a 100g scale and a maximum capacity of 150 kg. Body mass index (BMI, kg/m2) was calculated using the equation BMI = weight/height.2
To evaluate the sweating rate (SR), all subjects were weighted 15 minutes before the beginning (BW) and shortly after (AW) in both single bout exercise according to previously publications.18,19 The SR was
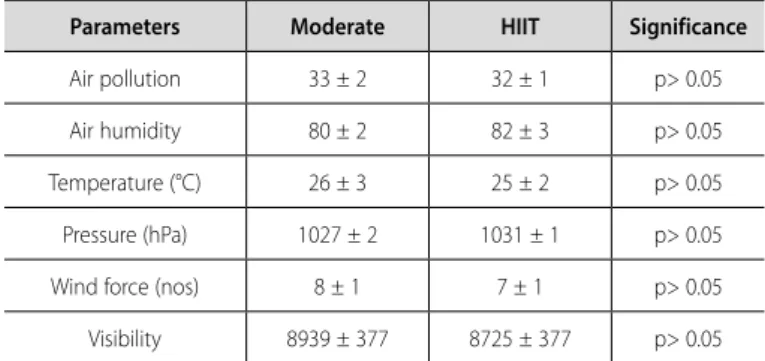
ex-pressed as (ml/min) obtained by the following equation: SR= (BW-AW) / total time of physical activity. All subjects ingested 500ml of water and 50g of carbohydrate 40 minutes before both sessions. The environmental parameters in both exercise sessions are described in Table 1.
The rate of perceived exertion (RPE) method was measured for each subject during the period of the study indicated by the RPE through the scale according to previously studies.20,21 Briefly, the subjects were told to choose a describer and a number from 0 to 10 (maximum value corresponds to the highest physical exertion experienced by the individual, and the minimum value is the rest condition). To guarantee that the RPE mean data obtained refers to the total training, subjects were asked to answer a question 20 to 30 minutes after the end of the session:
“How was your training today”?.
RESULTS
Significant differences (p<0.001) were found between time spent weekly on physical activity among groups (Inactive: 100 ± 15 and Active: 331 ± 53; minute/week.
As showed at Figure 1A, Significant reduction on body mass (p< 0.05) (kg) was found in inactive (Before: 81.95 ± 7.66, After: 81.75 ± 7,83; Before: 81.80 ± 7.82, after: 81.40 ± 7.94) and Active (Before: 73.40 ± 17.05, After: 73.30 ± 17.08; Before: 74.00 ± 17.33, After: 73.50 ± 17.46) groups after moderate and HIIT single bout, respectively. Additionally, significant changes (p= 0.01) (%) were found on body mass after HIIT compared to Moderate session in both Active (HIIT: -0.60 ± 0.29, Moderate: -0.26 ± 0.12) and Inactive (HIIT: -0.92 ± 0.30, Moderate: -0.26 ± 0.26), however, no differences were found between groups.
Similar results were found in sweat rate parameters showed at Figure 1B. Significant differences (p= 0.01) were found on sweat rate comparing Moderate and HIIT single bout in Inactive (Moderate: 10.55 ± 10.59; HIIT: 28.90 ± 13.88) and Active (Moderate: 9.60 ± 4,52; HIIT: 26.00 ± 15.06) groups.
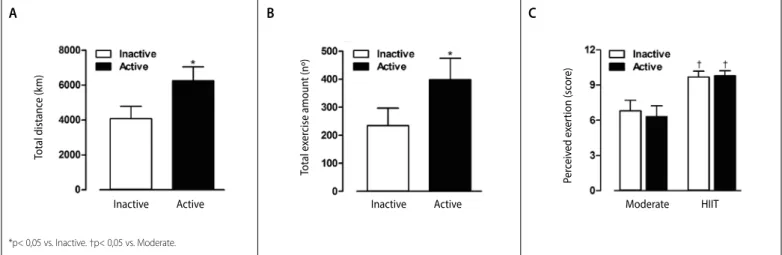
The total distance (Inactive: 4080 ± 719 meters, Active: 6249 ± 801 meters; p< 0.001) and total exercise amount (Inactive: 234 ± 63 numbers, Active: 398 ± 76 numbers; p< 0.001) were higher on Active group as sho-wed in Figure 2A and 2B respectivally. The perceived exertion parameters are showed at Figure 2C. No differences were found between groups at Moderate (Inactive: 6.80 ± 0.91; Active: 6.30 ± 0.94) and HIIT (Inactive: 9.80 ± 0.42; Active: 9.70 ± 0.91) session.
Table 1. Enviromental parameters at the day test.
Parameters Moderate HIIT Significance
Air pollution 33 ± 2 32 ± 1 p> 0.05
Air humidity 80 ± 2 82 ± 3 p> 0.05
Temperature (°C) 26 ± 3 25 ± 2 p> 0.05
Pressure (hPa) 1027 ± 2 1031 ± 1 p> 0.05
Wind force (nos) 8 ± 1 7 ± 1 p> 0.05
Visibility 8939 ± 377 8725 ± 377 p> 0.05
Values are presented as mean ± standard deviation.
Statistical analysis
The D’Agostino–Pearson test was applied to Gaussian distribution analysis. The paired Student’s t-test and One-way ANOVA followed by Kruskal–Wallis or Bonferroni’s post-hoc test were performed to compare differences in fatigue protocol. Comparison analysis between inactive and active groups was done by a repeated-measures ANOVA, followed by Kruskal–Wallis or Bonferroni’s post-hoc test. An alpha of 0.05 was used to determine statistical significance. All data values were expressed as a mean ± standard deviation. All analysis were performed using SPSS software (v 15.0; IBM, Armonk, NY, USA).
Figure 1. Values expressed in a mean ± SD of body mass (Panel A) and sweat rate (Panel B) of inactive and active groups.
*p< 0,05 vs. before.†p< 0,05 vs. Inactive. ‡p< 0,05 vs. Moderate.
Inactive Active Inactive Active
Moderate HIIT
A
B
Inactive Active
Moderate HIIT Before
B
ody mass (kg)
Sw
ea
t r
at
e (ml/min)
200
DISCUSSION
The main findings of the present study are related to the higher rate of sweating on HIIT compared to the moderate intensity exercise, regardless the subjects´ physical activity level.
It is known that the sweating rate during exercise is affected by thermal and no thermal mechanisms.22 Besides, the intensity of stimuli
as well as the physical fitness level also influences directly in the response of these control mechanisms.23
Although it is simple, the alteration of body mass after physical exer-cise has been considered a suitable parameter to assess dehydration.24
The body mass variation found in this study was similar other studies.2,25
The body mass reduction is associated with the decrease in the hydric body content, mainly for the maintenance of the temperature to avoid damaging the normal physiologic functions.2 In that way, it is possible to
consider that with higher sweating rates, the body mass will be smaller after the practice of exercise.26,27
Regarding the difference between sessions HIIT and moderate, the intensity (all out) used at HIIT´s session can explain the results found in this study. Consequently, it is possible to consider that although the human body has a limitation to take advantage of the energy for movement (20%), about 80% of the energy is wasted in the form of heat27 being
proportional to higher intensities. Therefore, in exercises demanding higher oxygen consumption, as HIIT methods, it is possible to consider that the higher energetic expenditure highlighted in the literature28 could
induce a higher internal production of heat, which, in turn, increases the sweating rate to maintain even the body temperature.29
Amano et al.2 also reported the connection between intensive
methods and higher sweating rates. According to the authors, if there is no increase in the sweating rate, the inner body will be damaged as consequence of the excessive increase of the core´s temperature.
Besides this, although the total amount of work had been greater in both protocols in the Active group, the perception of effort was not different between the groups, which shows that regardless the fact that the external load was different in function of each one´s physical fitness,30
the internal workload was similar between the groups.
Frazão et al.,15 when applying the HIIT protocol in treadmill also
observed that the inner load response, assessed through the perception
exertion, was similar for both untrained and trained individuals, although the absolute intensity has been greater with the former. This fact could be associated with the comparable sweating rate found in the groups in the protocols.
Possibly, the differences observed in performance between the groups and the similar responses in effort´s perception and sweating rate are related to the economy of movement. Many works31,32 show that
trained individuals present higher economy of movements, that is, they manage to expend fewer calories per time unit compared to untrained people performing tasks with similar absolute intensity.
Thus, in comparison with inactive individuals, people with higher levels of physical activity manage to work more, perhaps because they use the same amount of calories making the same quantity of heat with a similar sweating rate.
Based on the above, the results of the study show that, although active and inactive individuals differ about the work´s production in activities with similar intensities, the perception of the effort and the sweating rate do not differ between individuals with different levels of physical activity.
It is important to highlight that HIIT provides higher sweating rates in moderate physical activity; thus it deserves greater attention to control the exercise´s extrinsic circumstances, such as ambient temperature and liquid replacement pre and post activity.
CONCLUSIONS
The sweating rate is influenced by the intensity of the exercise, being higher after HIIT than after moderate exercise session, however, this sweat rate variation is not affected by the physical activity level of the subjects.
ACKNOWLEDGEMENT
The authors thank CAPES (Coordenação de Aperfeicoamento de Pessoal de Nível Superior) fellowships addressed to Machado AF and Rica RL. The fund providers had no part in the decision to publish and in the preparation of this paper.
All authors declare no potential conflict of interest related to this article. Figure 2. Values expressed in a mean ± SD of total distance (A), total exercise amount (B) and Internal load (C) measurements of Inactive and Active groups.
*p< 0,05 vs. Inactive. †p< 0,05 vs. Moderate.
AUTHORS’ CONTRIBUTIONS: Each author made significant individual contributions to this manuscript. AFM (0000-0002-6728-9107)* and DSB (0000-0003-3993-8277)*: were the main contributors to the writing of the manuscript; ALE (0000-0002-4941-6475)* and JMQM (0000-0003-2371-4527)*: performed the laboratory procedures, recruited the volunteers, conducted the anthropometric measurements and filled out the questionnaires, in addition to training volunteers; GSL 4941-4576)*, CVLT (0000-0002-8523-5794)* and RLR (0000-0002-6145-1337)*: evaluated the data from the statistical analysis; AFJ (0000-0002-6635-8019)* and JSB (0000-0001-7550-8616)*: conducted the literature review and revision of the English text . All authors contributed to the intellectual concept of the study and approved the final version of the manuscript. *ORCID (Open Researcher and Contributor ID).
Inactive Active Moderate HIIT
Inactive Active
Total distanc
e (k
m)
Total e
xer
cise amoun
t (nº)
Per
ceiv
ed e
xer
tion (sc
or
e)
201
REFERENCES
1. Amano T, Koga S, Inoue Y, Nishiyasu T, Kondo N. Characteristics of sweating responses and peripheral sweat gland function during passive heating in sprinters. Eur J Appl Physiol. 2013;113(8):2067-75.
2. Ramos JS, Dalleck LC, Tjonna AE, Beetham KS, Coombes JS. The impact of high-intensity interval training versus moderate-intensity continuous training on vascular function: a systematic review and meta-analysis. Sports Med. 2015; 45(5):679-92.
3. Suzuki FS, Kalytczak MM, Casarin CA, Serra AJ, Evangelista AL, Marchetti PH, et al. Physical activity level does not influence the neuromuscular fatigue in adults. Rev Bras Med Esporte. 2016;22(2):97-101.
4. Tucker WJ, Sawyer BJ, Jarrett CL, Bhammar DM, Gaesser GA. Physiological responses to high-intensity interval exercise differing in interval duration. J Strength Cond Res. 2015;29(12):3326-35.
5. Marcos A, Manonelles P, Palacios N, Wärnberg J, Casajús JA, Pérez M, et al. Physical activity, hydration and health. Nutr Hosp. 2014;29(6):1224-39.
6. Foster C, Hoyos J, Earnest C, Lucia A. Regulation of energy expenditure during prolonged athletic competition. Med Sci Sports Exerc. 2005;37(4):670-5.
7. Sunderland C, Nevill ME. High-intensity intermittent running and field hockey skill performance in the heat. J Sports Sci. 2005;23(5):531-40.
8. Shibasaki M, Rasmussen P, Secher NH, Crandall, CG. Neural and non-neural control of skin blood flow during isometric handgrip exercise in the heat stressed human. J Physiol. 2009;587(9):2101-7.
9. Gist NH, Freese EC, Ryan TE, Cureton KJ. Effects of low-volume, high-intensity whole-body calisthenics on Army ROTC Cadets. Mil Med. 2015;180(5):492-8.
10. Hafstad AD, Boardman NT, Lund J, Hagve M, Khalid AM, Wisløff U, et al. High intensity interval trai-ning alters substrate utilization and reduces oxygen consumption in the heart. J Appl Physiol (1985). 2011;111(5):1235-41.
11. Gibala MJ, Gillen JB, Percival ME. Physiological and health-related adaptations to low-volume interval training: influences of nutrition and sex. Sports Med. 2014;44(Suppl 2):127-37.
12. Foster C, Lucia, A. Running economy: the forgotten factor in elite performance. Sports Med. 2007;37(4-5):316-9.
13. Sijie T, Hainai Y, Fengying Y, Jianxiong W. High intensity interval exercise training in overweight young women. J Sports Med Phys Fitness. 2012;52(3):255-62.
14. Gist NH, Freese EC, Cureton KJ. Comparison of responses to two high-intensity intermittent exercise protocols. J Strength Cond Res. 2014;28(11):3033-40.
15. Frazão DT, Farias Junior LF, Dantas TC, Krinsk K, Elsangedy HM, Prestes J, et al. Correction: feeling of pleasure to high-intensity interval exercise is dependent of the number of work bouts and physical activity status. PLoS One. 2016;11(4):e0153986.
16. Powers SK, Howley ET. Exercise physiology theory and application to fitness and performance. 9th.
ed. New York: McGrawHill. 2015.
17. Machado AF, Baker JS, Figueira Junior AJ, Bocalini DS. High-intensity interval training using whole body exercises: training recommendations and methodological overview. Clin Physiol Funct Imaging. 2017. doi: 10.1111/cpf.12433.
18. Karvonen J, Vuorimaa, T. Heart rate and exercise during sports activities: practical application. Sports Med. 1988;5(5):303-11.
19. Reis VA, Azevedo CO, Rossi L. Anthropometric profile and sweat rate in young soccer players. Rev Bras Cineantropom Desempenho Hum. 2009;11(2):134-41.
20. Hamouti N, Del Coso J, Ortega JF, Mora-Rodriguez R. Sweat sodium concentration during exercise in the heat in aerobically trained and untrained humans. Eur J Appl Physiol. 2011;111(11):2873-81. 21. Foster C, Hoyos J, Earnest C, Lucia A. Regulation of energy expenditure during prolonged athletic
competition. Med Sci Sports Exerc. 2005;37(4):670-5.
22. Hostrup M, Bangsbo, J. Limitations in intense exercise performance of athletes: effect of speed endurance training on ion handling and fatigue development. J Physiol. 2017;595(9):2897-913.
23. Foster C, Florhaug JA, Franklin J, Gottschall L, Hrovatin LA, Parker S, et al. A new approach to monitoring exercise training. J Strength Cond Res. 2001;15(1):109-15.
24. Lambert GP, Lang J, Bull A, Eckerson J, Lanspa S, O’Brien J. Fluid tolerance while running: effect of repeated trials. Int J Sports Med. 2008;29(11):878-82.
25. Schlader ZJ, Raman A, Morton RH, Stannard SR, Mündel, T. Exercise modality modulates body temperature regulation during exercise in uncompensable heat stress. Eur J Appl Physiol. 2011;111(5):757-66.
26. Ramos JS, Dalleck LC, Tjonna AE, Beetham KS, Coombes JS. The impact of high-intensity interval training versus moderate-intensity continuous training on vascular function: a systematic review and meta-analysis. Sports Med. 2015;45(5):679-92.
27. MacInnis, MJ Gibala, MJ. Physiological adaptations to interval training and the role of exercise intensity. J Physiol. 2017;595(9):2915-30.
28. Amano T, Ichinose M, Koga S, Inoue Y, Nishiyasu T, Kondo N. Sweating responses and the muscle metaboreflex under mildly hyperthermic conditions in sprinters and distance runners. J Appl Physiol (1985). 2011;111(2):524-9.
29. Pérez-Idárraga A, Aragón-Vargas LF. Postexercise rehydration: potassium-rich drinks versus water and a sports drink. Appl Physiol Nutr Metab. 2014;39(10):1167-74.
30. Hood MS, Little JP, Tarnopolsky MA, Myslik F, Gibala MJ. Low-volume interval training improves muscle oxidative capacity in sedentary adults. Med Sci Sports Exerc. 2011;43(10):1849-56.
31. Perrella MM, Noriyuki PS, Rossi L. Evaluation of water loss during high intensity rugby training. Rev Bras Med Esporte. 2005;11(4):217-9.