Valorisation of codfish (
Gadus morhua
L.) salting
processing wastewater through the extraction of
high added value compounds
Thesis submitted to the Universidade Católica Portuguesa to attain the degree
of PhD in Biotechnology – with specialisation in Environmental
Engineering
By
Valorisation of codfish (Gadus morhua L.) salting
processing wastewater through the extraction of high
added value compounds
Thesis submitted to the Universidade Católica Portuguesa to attain the degree
of PhD in Biotechnology – with specialisation in Environmental
Engineering
By
VINCENZA FERRARO
Under the academic supervision of Prof. Paula Maria Lima Castro
Under the co-supervision of Prof. Maria Manuela Estevez Pintado
To my Family and Faustino
Without whose encouragement, understanding and support, I could not have finished my PhD course.
VI
Preface
The research work published in this PhD dissertation has been developed at WeDoTech -Companhia de Ideias e Tecnologias, Lda., spin-off enterprise of the College of Biotechnology of Catholic University of Portugal, in Porto, through an Early Stage Research grant inside the InSolEx-RTN Programme (Innovative Solution for Extracting high value natural compounds-Research and Training Network) of Marie Curie Actions, under the 6th Frame Programme of the European Research Area.
Acknowledgements
I would like to express my gratitude to my academic supervisors Prof. Maria Paula Lima Castro and Prof. Maria Manuela Estevez Pintado, whose expertise, understanding and patience added considerably to my graduate and professional experience. I really appreciate not only their vast knowledge and skills in many areas but also the human relationship they guided me with through the very intense PhD research period at the College of Biotechnology of the Catholic University of Portugal.
I express a special gratefulness to WeDoTech Lda., in the persons of Dr. Isabel Braga da Cruz and Dr. Ruben Ferreira Jorge, for giving me the opportunity to develop my PhD course in their company. I am grateful not just for the technical support and direction they provided me but also for the encouragements, motivation and friendship.
I acknowledge Marie Curie Actions of European Research Area for the doctoral grant inside the InSolEx–RTN programme (Innovative Solution for Extracting high value natural compounds – Research and Training Network) under FP6.
I am grateful to the programme co-ordinator Prof. Andrew Livingston of Imperial College London (UK), for the scientific supervision provided during the InSolEx–RTN programme’s meetings. I would also like to thank all the InSolEx–RTN network partners – MET, Membrane Extraction Technology, Ltd., London (UK); Dynamic Extraction, Ltd., London (UK); Denomega Nutritional Oils, SA, Sarpsborg (Norway); Due Miljø, SA, Oslo (Norway); Brno University of Technology (Czech Republic); Technical University of Crete (Greece); John Frantzeskakis and BROS, SA, Crete (Greece) – for the interesting debates, points of view and suggestions provided along the InSolEx–RTN programme’s meetings.
I still express my gratefulness to Dr. Anita Estevez Pintado and Eng. Cristina Santos for having teaching me important analytical and technical concepts on chromatographic analysis, and to Dr. Teresa Brandão for having helped me in statistical data treatment.
VIII
The cod fishing and processing Company Pascoal & Filhos, S.A., Aveiro (Portugal), is acknowledged for having provided samples and for technical support.
Finally, I would like to say thanks to all my researcher colleagues who worked at the CBQF (Centro de Biotecnologia e Química Fina) Laboratory of Escola Superior de Biotecnologia along with me, for their friendship, encouragement, exchange of knowledge and assistance, which consistently contributed enrich my life and research experience.
Scope of the Thesis
The studies reported in this PhD thesis aimed at the valorisation of the wastewater arising from the dry salting processing of codfish (Gadus morhua L.). The residual water object of this research has been collected at Pascoal & Filhos, S.A., a cod fishing and processing company based in Aveiro (Portugal).
Salting processing wastewater has been selected among all liquid waste effluents – salting, drying and re-hydrating water – based on its composition. Codfish salting processing wastewater is currently treated as an ecotoxic effluent, due to the high load of chloride, and according to the Portuguese environmental regulation.
Extensive characterisation has shown that 10 g/L of valuable organic compounds, such as free amino acids and proteins, are present in codfish salting wastewater along with ca. 250 g/L of sodium chloride. The nutritional, medical and also technical value of both essential and not essential free amino acids and of proteins found in codfish salting processing wastewater corroborated the potential of valorisation of the effluent.
The release of free amino acids and proteins has been studied in order to understand the mechanisms of their liberation from codfish muscle tissue along time. Free amino acids and proteins released at the end of salting have been selectively extracted from the wastewater by sorption using a commercial resin. Free amino acids extract has shown to have high intestinal bioavailability, antioxidant capacity and protection against oxidation of DNA, supporting the possibility of application as a nutritional or medical supplement.
X
Resumo
Apesar do desenvolvimento de outros métodos de preservação, a salga do bacalhau (Gadus morhua L.) continua a ser uma realidade devido a um conjunto de factores, entre os quais a simplicidade e o baixo custo do processo bem como as características sensoriais do produto final, muito apreciadas pelos consumidores.
Ao longo do processo de salga o bacalhau incorpora sal até 20% do seu peso e liberta concomitantemente cerca de 22% da sua água fisiológica; assim, aproximadamente 200 litros de água residual salgada são gerados para cada tonelada de bacalhau fresco. Esse efluente é actualmente tratado como resíduo tóxico devido ao alto teor de cloro, que pode atingir valores de concentração de cerca de 160 g/L.
A libertação desta água trás como consequência alterações significativas na composição e na estrutura do tecido muscular do bacalhau, levando à perda de compostos bioativos importantes, entre os quais aminoácidos livres, peptídeos e proteínas, nutrientes que, embora não essenciais, podem ser benéficos em certas circunstâncias. Assim, a recuperação de compostos orgánicos e do sal marinho de grau alimentar utilizado no processo de salga pode contribuir para a gestão integrada da água residual em questão. Com este objetivo, o perfil químico da água libertada foi avaliado. No final do período de salga o conteúdo de matéria seca na água libertada atinge o valor de ca. 10 g/L. A concentração de aminoácidos livres aumentou de 3.5 g/L a 6.5 g/L em 6 dias, devido a fenómenos de proteólise. Creatina, ácidos aspártico e glutâmico, arginina, glicina, metionina, lisina, taurina e triptofano, foram os aminoácidos livres predominantes e cuja libertação demonstrou-se obedecer a uma cinética monomolecular ou de pseudo-segunda ordem, dependendo do aminoácido. Embora em menor escala, a concentração de proteínas miofibrilares também aumentou com o tempo – de 3 para 3.7 g/L – fenómeno este ainda atribuível à proteólise.
A análise do azoto total e as suas fracções mostraram que, no final do processo de salga, 36.6% (w/w) de azoto total corresponde a peptídeos curtos com até 20 residuos e a aminoácidos livres, 14.7% (w/w) aos peptídeos com mais de 20 residuos e os restantes 48.7% (w/w) às proteínas. A concentração total de aminas biogénicas na água no final do processo de salga foi de ca. 100 mg/kg.
Proteínas, peptídeos a aminoácidos foram recuperados com sucesso por meio de um processo de sorção em batch e após um pré-tratamento com etanol de grau alimentar de forma a reduzir a concentração de sal da água, cuja elevada concentração, ca. 4.3 M, demonstrou afectar negativamente o mecanismo de adsorção dos aminoácidos. A presença do sal em certas concentrações demonstrou-se no entanto ser positiva, devido ao efeito da força iónica sobre a adsorção de aminoácidos.
A resina polimérica comercial Amberlite XAD16, uma resina neutra e não-polar, foi seleccionada para prosseguir com estudos de adsorção. Aminoácidos livres, proteínas e peptideos foram adsorvidos no mesmo estágio. O processo de recuperação foi efectuado recorrendo a solventes de grau alimentar.
Foi efectuada uma análise paramétrica do processo de adsorção examinando o efeito de diferentes parâmetros, nomeadamente temperatura, pH, percentagem de etanol adicionado a água residual, agitação, força iónica da solução, quantidade de adsorvente. O volume de solvente eluente e a temperatura foram os parâmetros avaliados na etapa de desadsorção. Os resultados mostraram que o processo de adsorção é controlado pela temperatura e pela força iónica, a qual neutraliza os efeitos do pH, e que a desadsorção é controlada pela temperatura e pela natureza do solvente eluente. A acetona resultou como o melhor solvente para desadsorção de aminoácidos livres, com um rendimento de recuperação de aminoácidos hidrofobicos e neutros de 100 %. As proteínas foram desadsorvidas por uma solução básica de hidróxido de sódio em água ao 4% (w/v), com um rendimento de recuperação de 100 %.
Os aminoácidos livres extraídos da água residual mostraram actividade antioxidante em geral e de proteção do DNA contra a oxidação em particular. Para os mesmos aminoácidos, a biodisponibilidade in-vitro foi estudada usando celulas Caco-2, medindo a taxa de transporte paracelular e a resistência elétrica transepitelial para verificar a integridade das células do epitelio intestinal. Os resultados mostraram que todos os aminoácidos livres extraídos permearam através da monocamada celular intestinal, embora em taxas diferentes e dependendo da sua concentração inicial; o transporte foi superior a 90 % para todos os aminoácidos livres, excepto a creatina, cujo transporte não passou de 6 %. A presença de sal na solução teve um papel positivo sendo o cloreto de sódio entre os mais importantes osmólitos de aminoácidos em seres humanos.
XII
Abstract
Despite the development of other means of preservation, salt-cured codfish (Gadus morhua L.) continues to be widely produced due to the simplicity of processing, low operating costs, and the highly appreciated sensory characteristics promoted by salt. Codfish takes salt up to ca. 20 % (w/w) during the dry-salting and drains concomitantly ca. 22 % (w/w) of its physiological water. Approximately 200 L of heavy salted wastewater are generated for each ton of fresh codfish undergoing the dry-salting process, which drives important changes in composition and structure of the muscle tissue. Water drained away through the salting process is currently treated as an ecotoxic waste due to the high content of chlorine, which can reach values as high as 160 g/L, representing a strong impact to the environment.
This residual water carries important bioactive compounds, ca. 10 g/L, such as free amino acids, peptides and proteins, which although not regarded as essential nutrients, can be considered beneficial under certain circumstances. As such, the recovery of organic compounds and of food-grade marine salt used in the salting process can be considered as valuable management options for that wastewater.
In this study, the chemical profile of the salting process residual water has been thoroughly examined. During the salting period the content of dry matter in wastewater increased with time. Concentration of free amino acids increased from 3.5 g/L to 6.5 g/L within 6 days probably due to proteolysis. Myofibrillar proteins concentration also increased however at a lower extent, from 3 to 3.7 g/L, a phenomenon still related to proteolysis. Creatine, aspartic and glutamic acids, arginine, glycine, methionine, lysine, taurine and tryptophan were the dominant free amino acids, which release was successfully modelled through a monomolecular or pseudo-second order kinetic, depending on the amino acid. When total nitrogen and relative fractions have been scrutinised, results showed that, by the end of the salting process, 36.6 % (w/w) of total nitrogen corresponded to small peptides (up to 20 residues) and free amino acids, 14.7 % (w/w) corresponded to peptides and the remaining 48.8 % (w/w) represented proteins. Total biogenic amines concentration in wastewater at the end of the salting process was ca. 100 mg/kg.
The organic load was successfully recovered by batch sorption on a polymeric resin after a pre-treatment aimed at reducing salt concentration in wastewater and whose elevated concentration – 4.3 M – negatively affected the mechanism of adsorption of amino acids. Food-grade ethanol was used for salt precipitation from wastewater. Investigation carried out revealed however the positive effect of ionic strength – up to certain molarities – on amino acids adsorption onto resin up to certain molarities. Amberlite XAD16, a commercial macroreticular polymeric resin, neutral and non-polar, has been selected amongst all resins tested. Free amino acids and proteins were adsorbed in the same stage but desorption has been performed selectively. Parametric analysis of the adsorption process has been carried out by studying the effect of six entities, namely temperature, pH, mixing rate, ionic strength, amount of ethanol in solution and adsorbent dose. Effect of temperature and solvent nature were examined for the desorption step. Results showed that the adsorption process is controlled by temperature and ionic strength, which neutralize pH effects, and desorption is controlled by temperature and by the nature of the regenerant solvent. Acetone resulted as the best solvent for free amino acids desorption with a yield of recovery of hydrophobic and neutral amino acids of 100 %. Proteins were desorbed by a strong basic solution of sodium hydroxide in water at a rate of 4 % (w/v), with a yield of recovery of 100 %. Free amino acids extracted from wastewater showed chemical antioxidant activity; they also demonstrated biological activity by preventing DNA oxidation. In vitro bioavailability of extracted amino acids was studied using Caco-2 cell line by measuring the paracellular transport of free amino acids extracted and the transepithelial electrical resistance to verify intestinal cell monolayer integrity. Results showed that all free amino acids were transported through the intestinal monolayer, however at different rates depending on initial concentration; transport has been higher than 90 % for all free amino acids except for creatine, whose transport has been not higher than 6 %. The presence of salt in solution contributed to the paracellular transport of free amino acids being sodium chloride among the most important amino acids osmolytes in human beings.
XIV
Keywords
(By alphabetic order)Adsorption Amberlite XAD16 Antioxidant activity
Bioavailability
By-products and waste valorisation Chromatography
Codfish salting process Design of experiments Desorption DNA protection Equilibrium Factorial design Food-grade Free amino acids High added value compounds
Inorganic salt Kinetic Marine by-products Microscopy Modelling of release Muscle proteins Nitrogen fractions Pelagic fish Precipitation processes Protic and aprotic solvents
Regenerant Salting-out Solvent extraction
List of Abbreviations
HAVC – High Added Value Compounds
WSN – Water Soluble Nitrogen
FAA – Free Amino Acids
TCASN – Trichloroacetic Acid Soluble Nitrogen
PTASN – Phosphotungstic Acid Soluble Nitrogen
ABTS
·
+ – 2,2'-Azino-Bis(3-ethylbenzThiazoline-6-Sulphonic acid) Cationic Radical ORAC – Oxygen Radical Absorbance CapacityHPLC-UV/Vis – High Performance Liquid Chromatography interfaced to Ultra Violet and Visible field detector
SDS-Page – Sodium Dodecyl Sulphate Polyacrilamide gel electrophoresis
SEM – Scanning Electronic Microscope
DNA – Deoxyribonucleic Acid
TEER – Trans-Epithelial Electrical Resistance
MW – Molecular Weight
IP – pH at the isoelectric point
HI2 and HI7
–
Hydrophobicity index at pH 2 and pH 7, respectively R – Aliphatic or aromatic lateral chain of amino acidCOD – Chemical Oxygen Demand
BOD – Biochemical Oxygen Demand
SS – Suspended Solids
XVI
List of Tables
Table 1.1 Content and typical market value of high added value compounds found in marine residues
Table 1.2 Effects of ω-3 polyunsaturated fatty acids EPA and DHA on human being
Table 1.3 Applications of chitin, chitosan and their oligomers
Table 1.4 Sources of enzymes from fish, aquatic invertebrates, marine mammals and their by-products
Table 1.5 Current and potential applications of enzymes obtained from marine products and by-products
Table 2.1 By-products and waste through the salting process of codfish (adapted from AWARENET, 2004)
Table 2.2 Amount of by-products and waste from salting process generated at Pascoal & Filhos S.A. and based on 30 ton/day of codfish
Table 2.3 Screening of composition of codfish salting processing liquid waste generated at Pascoal & Filhos, S.A.
Table 3.1 Wastewater composition (mean ± standard deviation) throughout the salting process of codfish
Table 3.2 Concentration of total muscle protein, actin and free amino acids throughout the codfish salting process (mean ± standard deviation)
Table 3.3 Kinetic parameters (C∞, n, k1, k2 and kn) and statistic parameters (R2, adjusted R2 and SER) for wastewater, total muscle protein and actin, and for major free amino acids released (confidence level of 95%)
Table 4.1 Properties of Amberlite XAD16 resin (Rohm & Haas, 2010)
Table 4.2 Physicochemical properties of amino acids Table 4.3 Experiments for adsorption equilibrium study
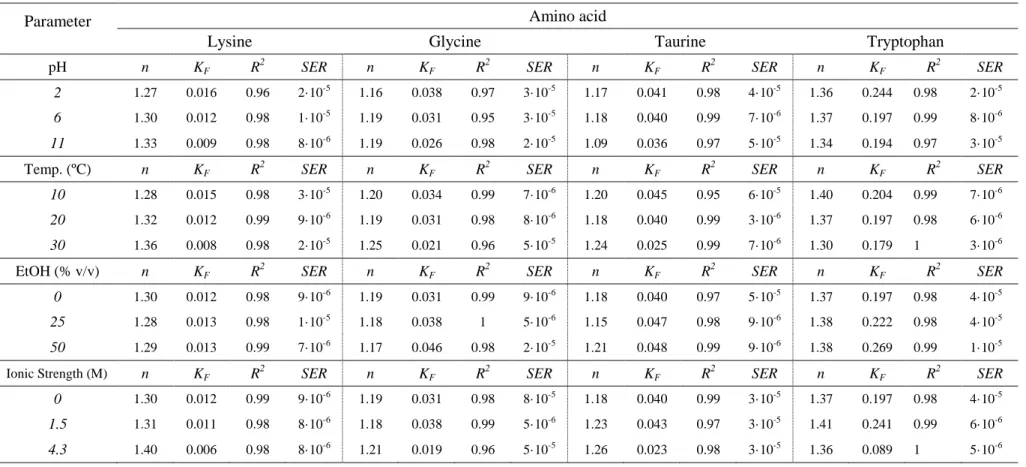
Table 4.4 Isotherms parameters n and KF and statistics parameters R2 and SER
Table 4.5 Thermodynamic parameters of adsorption ΔG, ΔH and ΔS for each amino acid and for each temperature
Table 4.6 Recovery of amino acids depending on temperature, at 0 M NaCl, C0=0.5 g/L and 10 g of resin for 100 ml of solution
Table 4.7 Recovery of amino acids depending on ionic strength, at 20 ºC, C0=0.5 g/L and 10 g of resin for 100 ml of solution
Table 4.8 Recovery of amino acids depending on percentage (v/v) of ethanol in the amino acids solutions, at 20 ºC, C0=0.5 g/L and 10 g of resin for 100 ml of solution
Table 4.9 Recovery of amino acids depending on pH of solution, at 20 ºC, C0=0.5 g/L and 10 g of resin for 100 ml of solution
Table 4.10 Maximum amino acids recovery for each parameter investigated
Table 4.11 Recovery of taurine by combining pH with ionic strength, at 10 ºC
Table 4.12a Matrix of experiments for factorial design
Table 4.12b Matrix of data for factorial design
Table 5.1 Matrix of experiments for factorial design
Table 5.2 Composition of wastewater, wastewater-ethanol mixture and precipitated phase at the best operating conditions 0ºC, 30 min, wastewater:ethanol ratio 1:1 (mean±standard deviation)
Table 5.3 NaCl precipitated along 120 min at 27 ºC (ambient temperature) and at a sample:ethanol ratio of 1:1 (v/v). Values are expressed in % (mean ± standard deviation)
Table 5.4 NaCl precipitated depending on ethanol added to sample (v/v) at 27 ºC (ambient temperature) and after 30 min. Values are expressed in % (mean ± standard deviation)
Table 5.5 NaCl precipitated depending on temperature at a sample:ethanol ratio of 1:1 (v/v) and after 30 min. Values are expressed in % (mean ± standard deviation)
Table 5.6 Matrix of data (mean values) for factorial design
Table 6.1 Kinetic parameters (Cad∞ and kad, in g/g and min-1 respectively), statistic parameters (R2 and SER) and yield after first and second adsorption cycles (in %) for proteins and free amino acids, at 12ºC and 300 rpm
Table 6.2 Kinetic parameters (Cdes∞ and kdes, in g/L and min-1 respectively), statistic parameters (R2 and SER), yields of desorption cycles and total sorption yields for free amino acids and proteins, at the best operating condition (in %)
XVIII
Table 6.3 Concentration of free amino acids and proteins in the eluents and on dry base after evaporation
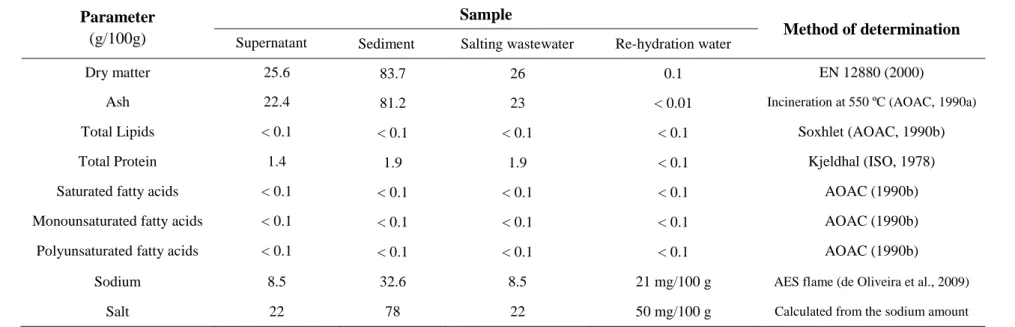
Table 7.1 Composition of samples
Table 7.2 Antioxidant capacity of samples
List of Figures
Figure 2.1 Codfish skin
Figure 2.2 Supernatant of codfish salting and drying processing wastewater
Figure 2.3 Sediment of codfish salting and drying wastewater stream
Figure 2.4 Codfish salting processing wastewater
Figure 3.1 Nitrogen (mean ± standard deviation) evolution trend throughout the codfish salting process
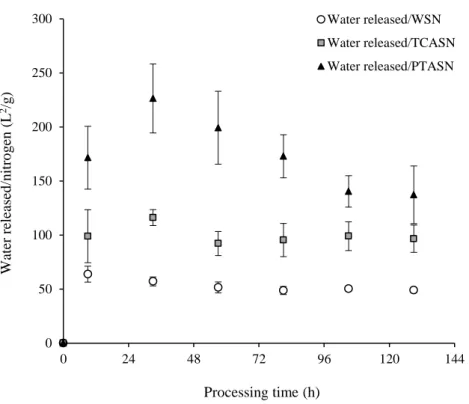
Figure 3.2 Ratios of volume of water released to total and fractional nitrogen (mean ± standard deviation) throughout the codfish salting process
Figure 3.3 Evolution trend of ratios TCASN/WSN and PTASN/WSN (mean ± standard deviation) throughout the codfish salting process
Figure 3.4 SDS-Page profile of codfish salting process wastewater. First lane: high molecular weight standard; second lane: low molecular weight standard; third lane: wastewater sample. Molecular weights are expressed in kDa
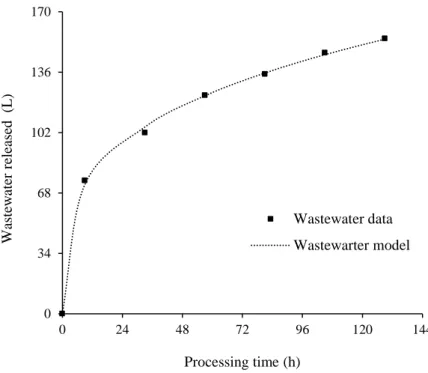
Figure 3.5 Experimental and model dataset for wastewater released according to a power-law kinetics
Figure 3.6 Experimental and model dataset for free amino acids released according to a pseudo-first order kinetics
Figure 3.7 Experimental and model dataset for free amino acids released according to a pseudo-second order kinetics
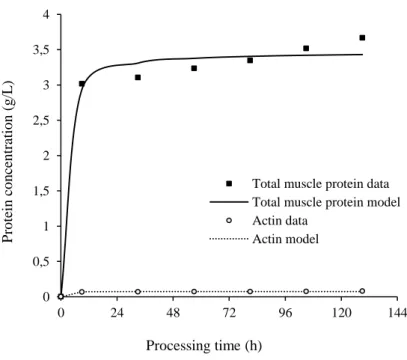
Figure 3.8 Experimental and model dataset for muscle proteins released according to a pseudo-second order kinetics
Figure 4.1 Chemical structure of Amberlite XAD16 polymeric adsorbent
Figure 4.2 Adsorption isotherms at a constant temperature
Figure 4.3 Examples of effect of temperature on physical adsorption isotherms
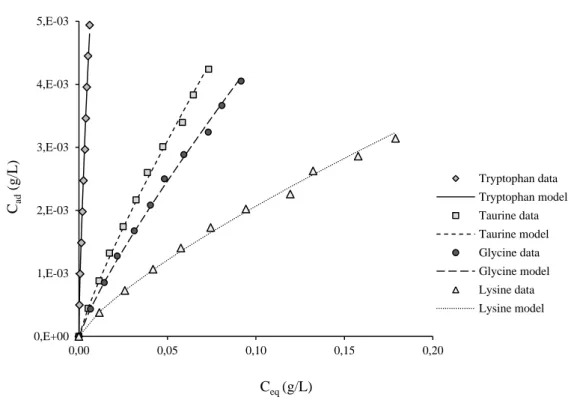
Figure 4.4 Amino acids adsorption isotherms at 20ºC (mean values ± standard deviation bars, which are not visible) with 10 g of resin for 100 ml of solution, and theoretical model data set
XX
Figure 4.5 Adsorption isotherms of taurine at different temperatures (mean values ± standard deviation bars, which are not visible) with 10 g of resin for 100 ml of solution, and theoretical model data set
Figure 4.6 Adsorption isotherms of taurine at 20ºC from 0, 1.5 and 4.3 M NaCl aqueous solution (mean values ± standard deviation bars, which are not visible) with 10 g of resin for 100 ml of solution, and theoretical model data set
Figure 4.7 Adsorption isotherms of taurine at 20ºC from 0, 25 and 50 % of ethanol (v/v) in 100 ml of solution of amino acids with 10 g of resin (mean values ± standard deviation bars, which are not visible), and theoretical model data set
Figure 4.8 Adsorption isotherms of lysine at 20ºC from 0, 25 and 50 % of ethanol (v/v) in 100 ml of solution of amino acids with 10 g of resin (mean values ± standard deviation bars, which are not visible), and theoretical model data set
Figure 4.9 Adsorption isotherms of taurine at 20ºC at pH 2, 6 and 11 (mean values ± standard deviation bars, which are not visible) with 10 g of resin for 100 ml of solution, and theoretical model data set
Figure 4.10 Effect of initial concentration on the recovery of tested amino acids, at 20ºC, 10 g of resin for 100 ml of solution
Figure 4.11 Effect of adsorbent dose on amino acid recovery from a solution at C0=0.5 g/L and at 20ºC
Figure 4.12 Effect of adsorbent dose on amino acid recovery from a solution at C0=0.05 g/L and at 20ºC
Figure 4.13 Second-order fitted surface of response (R% of taurine) for 32 factorial design
Figure 4.14 Second-order contour plot of response (R% of taurine) for 32 factorial design
Figure 4.15 Pareto plot of the standardised effects of the two factors on the response (R% of taurine). “L” stands for “linear”, “Q” stands for “quadratic”. Vertical line defines significance limit expressed by the p-value at a confidence level of 95%
Figure 5.1 SDS-Page electropherogram of samples. First lane represents standards mixture with weight expressed in kDa. Second and third lanes refer to wastewater; fourth and fifth lanes refer to wastewater-ethanol mixture supernatant; sixth and seventh lanes represent the precipitated phase
Figure 5.2 Salt precipitation trends in blank solution and wastewater after 100 ml of ethanol added to 100 ml of sample, along 120 min (mean values ± standard deviation bars)
Figure 5.3 Salt precipitation trends in blank solution and wastewater along ethanol addition, after 30 min and at 27 ºC (mean values ± standard deviation bars)
Figure 5.4 Salt precipitation trends in blank solution and wastewater along temperature increasing, after 30 min and for 100 ml of ethanol added to 100 ml of sample (mean values ± standard deviation bars)
Figure 5.5 Second-order fitted surface of response (% salt precipitated)
Figure 5.6 Pareto plot of the standardised effects of the two factors (“EtOH”- ethanol; “Temp”- temperature) on the response (salt precipitated). “L” stands for “linear”, “Q” stands for “quadratic”. Vertical line defines significance limit expressed by the p-value at a confidence level of 95%
Figure 5.7 Pareto plot of the effects of the two factors (“EtOH” – ethanol; “Temp” - temperature) on the response (salt precipitated). “L” stands for “linear”, “Q” stands for “quadratic”
Figure 6.1 Scanning electron microscopy images of Amberlite XAD16 along the sorption process: (a) Amberlite XAD16, before washing; (b) washed Amberlite XAD16; (c) Amberlite XAD16 after adsorption; (d) Amberlite XAD16 after free amino acids desorption; (e) Amberlite XAD16 after proteins desorption
Figure 6.2 Yields of adsorption for proteins and free amino acids along time (mean values ± standard deviation) at 12ºC and 300 rpm. Data from 0 to 70 min represent yields along the first adsorption cycle; data from 70 to 140 min represents yields along the second adsorption cycle.
Figure 6.3 Amount of proteins and free amino acids adsorbed on the resin along time (mean values ± standard deviation) during the first adsorption cycle, at 12ºC and 300 rpm
Figure 6.4 Plot of Bt versus time (Reichenberg model)
Figure 6.5 Plot of Cad (g/g) versus time1/2 (Weber & Morris model)
Figure 6.6 Amount of taurine adsorbed on Amberlite XAD16 (mean values ± standard deviation) along time depending on agitation speed
Figure 6.7 SDS-Page electopherogram of samples. From left to right, first and second lanes (enclosed by the first and the second solid line rectangles respectively) represent
XXII
mixture of free amino acids eluted by acetone; third lane represents standard mixture with molecular weight expressed in kDa; fourth and fifth lanes (enclosed by the third and the fourth dotted line rectangles respectively) represent the wastewater-ethanol mixture after second adsorption cycle; sixth and seventh lanes represent the proteins mixture eluted by the NaOH solution
Figure 6.8 Yields of desorption cycle for proteins and free amino acids along time. Experimental data (mean values ± standard deviation) at 30ºC, 40 ml of eluting solvents and 300 rpm
Figure 6.9 Concentration of proteins and free amino acids (mean values ± standard deviation), in 40 ml 4% NaOH solution and 40 ml of acetone respectively, along time and during the first desorption cycle, at 30 ºC and 300 rpm
Figure 6.10 Effect of temperature upon proteins and taurine desorption, using 40 ml of acetone for elution
Figure 6.11 Yield of desorption of proteins and taurine depending on volume of eluting solvents
Figure 6.12 Effect of eluent nature upon taurine desorption yield, at 30 ºC, 40 ml of eluting solvent (acetone and ethanol)
Figure 6.13 Process flow diagram for the extraction of free amino acids and proteins from codfish salting processing wastewater
Figure 7.1 Effects of samples on DNA oxidative damage. Lane (a) represents DNA alone (positive control); lane (b) represents DNA+Cu(II)-ascorbic acid (negative control); lane (c) represents DNA+sample III; lane (d) represents DNA+Cu(II)-ascorbic acid+sample III; lane (e) represents DNA+sample IV; lane (f) represents DNA+Cu(II)-ascorbic acid+sample IV; lane (g) represents DNA+sample II; lane (h) represents DNA+Cu(II)-ascorbic acid+sample II; lane (i) represents DNA+sample I; lane (l) represents DNA+Cu(II)-ascorbic acid+sample I; lane (m) represents again DNA alone
Figure 8.1 TEER along time for each sample (mean values ± standard deviation bars)
Figure 8.2 Transport of free amino acids extracted from codfish salting processing wastewater (sample II) through the Caco-2 cells monolayer (mean values ± standard deviation bars)
Figure 8.3 Apparent permeability of free amino acids extracted from codfish salting processing wastewater (sample II) through the Caco-2 cells monolayer (mean values ± standard deviation bars)
Thesis Layout
Part I General introduction
Chapter 1 – High added value compounds in marine by-products and
waste
Part II
High added value compounds from the codfish (Gadus morhua L.) salting processing residues
Chapter 2 – By-products and waste through the salting process of
codfish
Chapter 3 – Characterisation of wastewater through the salting
process of codfish
Part III
Extraction of free amino acids and proteins from codfish salting processing wastewater by sorption
Chapter 4 – Equilibrium and thermodynamics of adsorption of
selected amino acids upon AmberliteXAD16 resin
Chapter 5 – Ethanolic precipitation of sodium chloride from codfish
salting processing wastewater
Chapter 6 – Kinetics of adsorption and desorption of free amino
acids and proteins upon AmberliteXAD16 resin
Part IV
Characterisation of free amino acids extract
Chapter 7 – Evaluation of antioxidant activity of free amino acids
extract
Chapter 8 – In-vitro bioavailability of free amino acids extract
Part V
Synthesis and follow up
XXIV
Keynotes and Outlines
This thesis is organized in five parts.
In Part I, a general introduction to the valorisation of marine by-products and waste produced worldwide has been delineated. This part comprises one chapter, Chapter 1, which describes important high added value compounds found in marine by-products and waste, with a special attention to those arising from pelagic fish processing for food purposes.
Part II focuses on residues generated along the salting process of codfish and comprises two chapters. In Chapter 2 by-products and waste generated though the salting process of codfish at a Portuguese company operating inside the fishing and fish processing industry are presented. Chapter 3 delineates the characterisation of residue selected for valorisation – codfish salting processing wastewater – from a general description of the main classes of organic compounds found in the residue to the specific components of each of those. Qualitative and quantitative analysis is reported along with modelling of release of most important class of substances – free amino acids and proteins.
Part III focuses on the extraction of free amino acids and proteins in codfish salting processing wastewater by sorption, and includes three chapters. In Chapter 4 the study of adsorption equilibrium and thermodynamics of selected amino acids upon Amberlite XAD16 resin, as well as the investigation on optimal conditions for adsorption is reported. In Chapter 5 a wastewater pre-treatment step, consisting of partial precipitation of salt, which allowed for a higher recovery of amino acids and proteins, is described. Adsorption kinetics and desorption are finally discussed in Chapter 6.
Part IV is dedicated to the characterization and bioavailability of the free amino acids mixture recovered from codfish salting wastewater by the sorption process. That part includes two chapters. Chapter 7 is dedicated to the description of chemical antioxidant activity of amino acids mixture evaluated by ABTS and ORAC methodology, and also a description of protection against oxidation of DNA.
Bioavailability of extracted free amino acids, based on Caco-2 cell line test, has been reported in Chapter 8.
A synthesis of the research work carried out during the PhD course is traced in Part V, with a general conclusion on the main results achieved and a note on the future work, both covered by Chapter 9.
XXVI
List of Publications
Publications in peer-reviewed international journals
Published articles
Ferraro, V., B. Cruz, I., Ferreira Jorge, R., E. Pintado, M., Castro, L. P. M. Solvent extraction of sodium chloride from codfish (Gadus morhua L.) salting processing wastewater. Accepted for publication in the Desalination Journal, Elsevier.
Ferraro, V., B. Cruz, I., Ferreira Jorge, R., Malcata, X.F., Castro, L. P. M., E. Pintado, M. Characterisation of high added value compounds in wastewater throughout the salting process of codfish (Gadus morhua). Food Chemistry 124 (2011), 1363-1368.
Ferraro, V., B. Cruz, I., Ferreira Jorge, R., Malcata, X.F., Castro, L. P. M., E. Pintado, M. Characterisation of soluble nitrogen and muscle proteins in wastewater throughout the salting process of codfish (Gadus morhua). Chemical Engineering Transaction 21 (2010), 829-834.
Ferraro, V., B. Cruz, I., Ferreira Jorge, R., Malcata, X.F., E. Pintado, M., Castro, L. P. M. Valorisation of natural extracts from marine source focused on marine by-products – A Review. Food Research International 43 (2010), 2221-2233.
Articles in preparation
Ferraro, V., B. Cruz, I., Ferreira Jorge, R., Castro, L. P. M., E. Pintado, M. In-vitro bioavailability of free amino acids extracted from codfish (Gadus morhua L.) salting processing wastewater.
Ferraro, V., B. Cruz, I., Ferreira Jorge, R., E. Pintado, M., Castro, L. P. M. Recovery of free amino acids and proteins from codfish (Gadus morhua L.) salting processing wastewater by adsorption and desorption on a commercial resin.
Ferraro, V., B. Cruz, I., Ferreira Jorge, R., Castro, L. P. M., E. Pintado, M. Evaluation of antioxidant activity and DNA protection capacity of free amino acids extracted from codfish (Gadus morhua L.) salting processing wastewater.
Publications (posters) in peer-reviewed international events
Ferraro, V., B. Cruz, I., Ferreira Jorge, R., Malcata, X.F., Castro, L. P. M., E. Pintado, M. Characterisation and modelling of high added value compounds released during the salting process of codfish (Gadus morhua L.). 19th CHISA Congress, Poster Nº 2245, Prague, Czech Republic 2010.
Ferraro, V., B. Cruz, I., Ferreira Jorge, R., Malcata, X.F., Castro, L. P. M., E. Pintado, M. Characterisation of high added value compounds in drained water
during the codfish (Gadus morhua L.) salting process. 2nd SAFE–AOPC Congress,
Poster Nº 14, Gerona, Spain 2009.
Santos, A. F., Ferraro, V., B. Cruz, I., Ferreira Jorge, R., Carvalho, A.P., Castro, L. P.M., E. Pintado, M. Potential valorisation of vinification by-products. 2nd SAFE – AOPC Congress, Poster Nº 33, Gerona, Spain 2009.
Ferraro, V., B. Cruz, I., Ferreira Jorge, R., Malcata, X.F., E. Pintado, M., Castro, L., P. M. High added value compounds from codfish processing. 18th CHISA Congress, Poster Nº 204, Prague, Czech Republic 2008.
XXVIII
Table of Content
Preface...VI
Acknowledgments...VII
Scope of the Thesis...IX
Resumo...X
Abstract...XII
Keywords...XIV
List of Abbreviation...XV
List of Tables...XVI
List of Figures... ...XIX
Layout...XXIII
Keynotes and Outlines...XXIV
List of Publications... ...XXVI
PART I – GENERAL INTRODUCTION...1
Abstract...3
Chapter 1 – High added value compounds in marine by-products and waste...5
1.1 Introduction... ...7
1.2 High added value compounds in marine by-products and waste...8
1.2.1 Polyunsaturated fatty acids ω-3...11
1.2.2 Amino acids taurine and creatine...15
1.2.2.1 Taurine...16
1.2.2.2 Creatine...17
1.2.3 Chitin and chitosan... ...20
1.2.4 Collagen and gelatine...22
1.2.5 Hydroxyapatite...26
1.2.6 Antifreeze proteins... ...28
1.2.7 Enzymes...30
1.2.8 Astaxanthin... ...33
1.3 Conclusion...34
PART II – HIGH ADDED VALUE COMPOUNDS THROUGH THE SALTING PROCESS OF CODFISH (Gadus morhua L.)...35
Abstract...36
Chapter 2 – By-products and waste through the salting process of codfish...39
2.1 Introduction... ...41
2.2 By products and waste generated through the codfish salting process at a processing company...42
Chapter 3 – Characterisation of wastewater through the salting process of codfish... ...49
3.1 Introduction...51
3.2.1 Wastewater sampling...53
3.2.2 HPLC-UV/Vis analysis...54
3.2.2.1 Taurine and creatine... ...54
3.2.2.2 Other free amino acids...54
3.2.2.3 Actin... ...55
3.2.2.4 Biogenic amines... ...55
3.2.3 Assessment of total nitrogen and nitrogen fractions...56
3.2.4 Assessment of proteins...56
3.2.5 Electrophoresis of proteins...56
3.2.6 Total lipids determination...57
3.2.7 Assessment of salt and dry matter...57
3.2.8 Experimental data modelling and statistical analysis...58
3.3 Results and Discussion...58
3.3.1 Composition of codfish salting processing wastewater along time...58
3.3.2 Kinetics of release of water from codfish tissues...66
3.3.3 Kinetics of release of free amino acids from codfish tissues...67
3.3.4 Kinetics of release of muscle proteins from codfish tissues...70
3.4 Conclusion... ...71
PART III – EXTRACTION OF FREE AMINO ACIDS AND PROTEINS FROM
CODFISH SALTING PROCESSING WASTEWATER BY SORPTION...73
Abstract...75
Chapter 4 – Equilibrium and Thermodynamic of adsorption of free amino acids upon Amberlite XAD16 resin...77
4.1 Introduction...79
4.2 Materials and Methods...83
4.2.1 Adsorbent...83
4.2.2 Free amino acids and proteins to be absorbed...84
4.2.3 Amberlite XAD16 pretreatment and recovery of resin washing solvents....86
4.2.3.1 Amberlite XAD16 pretreatment...86
4.2.3.2 Washing solvents recovery...86
4.2.4 Adsorption operating conditions...87
4.2.5 Study of equilibrium of adsorption upon Amberlite XAD16...87
4.2.5.1 Theoretical background of equilibrium of physical adsorption...87
4.2.5.2 Theoretical background of thermodynamics of physical adsorption...91
4.2.5.3 Determination of the adsorption isotherms...92
4.2.6 Modelling of experimental data and design of experiments...94
4.3 Results and Discussion... ...94
4.3.5 Adsorption of selected free amino acids...94
4.3.6 Effects of temperature upon adsorption equilibrium...99
4.3.7 Effects of ionic strength upon adsorption equilibrium...101
4.3.8 Effects of ethanol upon adsorption equilibrium...103
XXX
4.3.10 Effects of initial concentration on amino acid recovery...106
4.3.11 Effects of AmberliteXAD16 dose upon amino acids recovery...107
4.3.12 Effects of parameters interaction upon adsorption...109
4.4 Conclusion...114
Chapter 5 – Ethanolic precipitation of sodium chloride from codfish salting processing wastewater...115
5.1 Introduction... ...117
5.2 Materials and Methods...118
5.2.1 Wastewater, blank solution and ethanol...118
5.2.2 Sodium chloride precipitation procedure...118
5.2.3 HPCL analysis...120
5.2.3.1 Analysis of free amino acids and actin...120
5.2.3.2 HPLC-RID analysis of ethanol...120
5.2.4 Assessment of proteins and electrophoretic analysis...120
5.2.5 Determination of salt and dry matter...121
5.2.6 Design of experiments and statistical analysis...121
5.3 Results and Discussion... ...122
5.3.1 Effects of pH...122
5.3.2 Effects of ethanol...122
5.3.2.1 One-variable-at-a-time approach...128
5.3.2.1.1 Amount of NaCl precipitated depending on time...128
5.3.2.1.2 Amount of NaCl precipitated depending on ethanol added to samples... ...129
5.3.2.1.3 Amount of NaCl precipitated depending on temperature...130
5.3.2.1.4 Amount of NaCl precipitated depending on pH...131
5.3.2.2 Experimental design methodology...132
5.4 Conclusion...134
Chapter 6 – Kinetics of adsorption and desorption of free amino acids and protein on AmberliteXAD16...137
6.1 Introduction...139
6.2 Theoretical background of kinetics and mechanism of adsorption and desorption...140
6.3 Materials and Methods...144
6.3.1 Solution of free amino acids and proteins...144
6.3.2 Batch adsorption and desorption of free amino acids and proteins...144
6.3.2.1 Adsorption...144
6.3.2.2 Desorption...145
6.3.3 HPLC-UV analysis...147
6.3.4 Assessment of proteins and electrophoresis analysis...147
6.3.5 Determination of salt...147
6.3.6 Modelling of experimental data...147
6.4 Results and Discussion...148
6.4.1 Adsorption...148
6.4.1.1 Elucidation of mechanism of adsorption...153
6.4.1.2 Effect of agitation speed on adsorption...154
6.4.2 Desorption...156
6.4.2.1 Effects of temperature on desorption yield...160
6.4.2.2 Effects of different volumes of eluting solvents on desorption yields....160
6.4.2.3 Effects of eluent nature on desorption yield...160
6.5 Purification of free amino acids and proteins and summary of the overall purification process...162
6.6 Conclusion...164
PART IV – CHARACTERISATION OF FREE AMINO ACIDS EXTRACT...165
Abstract...167
Chapter 7 – Evaluation of antioxidant activity of free amino acid extract...169
7.1 Introduction...171
7.2 Materials and Methods...174
7.2.1 Samples...174
7.2.2 ABTS radical cation decolourisation assays...175
7.2.3 ORAC assay...176
7.2.3.1 DNA oxidative damage inhibition assay...177
7.2.3.2 Statistical analysis...178
7.3 Results and Discussion...178
7.3.1 ORAC and ABTS assay...178
7.3.2 DNA oxidative damage inhibition assay...179
7.4 Conclusion...181
Chapter 8 – In vitro bioavailability of free amino acids extract...183
8.1 Introduction...185
8.2 Materials and Methods...187
8.2.1 Samples...187
8.2.2 Cell culture... ...188
8.2.3 TEER determination...189
8.2.4 Permeability and transport determination...189
8.2.5 Statistical analysis...190
8.3 Results and Discussion...190
8.4 Conclusion...197
PART V – SYNTHESIS AND FOLLOW UP...199
Abstract...201
Chapter 9 – General conclusion and future work...203
9.1 Conclusion...205
9.2 Future work...207
1
PART I
3
Abstract
The wide chemical and biological diversity observed in the marine environment makes the Ocean an extraordinary source of high added value compounds (HAVC), which can be employed in many applications. Minerals, lipids, amino acids, polysaccharides and proteins from marine sources have unique features and, surprisingly, their highest concentration is often found in parts of marine organisms that are commonly discarded. Fish heads, viscera, skin, tails, offal and blood, as well as seafood shells possess several HAVC suitable for human health applications, yet most end up as residues throughout the raw material processing.
Part I updates information on marine by-products and waste valorization and conveys critical analysis of the chief methodologies to carry out extraction, purification and eventual transformation, with a focus on their actual and potential applications.
Chapter 1 has been published as “Ferraro, V., B. Cruz, I., Ferreira Jorge, R., Malcata, X.F., E. Pintado, M. M., Castro L., P. M. Valorisation of natural extracts from marine source focused on marine by-products – A Review. Food Research International 43, (2010) 2221-2233.”
5
CHAPTER 1
HIGH ADDED VALUE COMPOUNDS IN
7
1.1 Introduction
Fishing is a rather ancient human activity and has played an important role in many human societies. Since the early 1960s, the state of fisheries has been consistently monitored by the Food and Agriculture Organization (FAO) Fisheries Resources Division. According to FAO (2000), the world fish production from marine catches has been increasing at an yearly rate of 6%, from 1950 (ca. 19.3 million tons) up to 1970 (ca. 60 million tons) (Blanco et al., 2007); however, more recent data point at more than 91 million tons of fish and shellfish caught each year (Rustad, 2003). In the 25 Member States European Union, the annual fish captures (from fishing and aquaculture) added up to 6.9 million ton in 2003 (Fishery Statistic Data, Eurostat, 2006) and the fish processing sector has generated an added value of EUR 3.8 billion (Eurostat, NACE, 2008).
Nowadays, an integrated and sustainable exploitation of fisheries resources is a must as only 50% of the catch is used for actual human consumption. Fisheries worldwide annual discards are estimated to be ca. 20 million tons, which represent 25% of the catch (Rustad, 2003) and include “non-target” species, and processing waste and by-products. In the European Union those discards represent a total of ca. 5.2 million tons per year (Mahro & Timm, 2007; AWARENET, 2004). Fish filleting, salting and smoking generate the major amount of solid waste and by-products (50-75 % of the fish) with a total of 3.17 million tons per year; fish canning is regarded as the second source of solid waste and by-products (30-65 % of the fish) with an amount of 1.5 million tons per year; crustaceans and mollusk processing also generate significant amounts of solid residues (20-50 %), ca. 0.5 million tons per year (AWARENET, 2004). In the UK it is estimated that ca. 313.000 tons of seafood processing residues are produced every year, so only 43% of the catches end up as products for human consumption (Archer et al., 2005).
Waste and by-products discharged by fisheries are currently rising, driven by both a net increase in fisheries products consumption and the changing consumer trend towards ready-to-use products. The seafood consumption has consistently increased during recent years as seafood has been progressively recognized as an important source of nutrients for human health. Proteins, lipids and polysaccharides and minerals from seafood possess unique features some of which are a consequence of specific factors
prevailing in the marine environment, such as temperature, pressure, salt concentration and oxygen availability (Shahidi, 1997). Seafood by-products and waste constitute at present a serious environmental problem (Arvanitoiannis & Kassaveti, 2008); those by-products and waste require appropriate management, especially because they are highly perishable, owing chiefly to the action of microorganisms that there find an excellent growth medium. Furthermore, in recent years more stringent quality and hygienic standards enforced to industries have caused a significant increase in the amounts of waste and wastewater generated from seafood processing. Major efforts have been focused on how to deal with the aforementioned by-products and waste in efficient ways, including useful applications; at present, most are taken advantage of as animal feed and plant fertilizers as well as ingredients for adhesive manufacture (AWARENET, 2004). Nutraceutical, functional food formulation or pharmaceutical applications can also be hypothesized as they already exist in such inexpensive marine feedstocks as head, viscera, skin, tails, offal, blood and shells (Kim & Mendis, 2005). Extraction of those high added value compounds (HAVC) - which can be profitable owing to their beneficial role upon human health - joined to the development of new technologies for recovery and purification, will run along with concomitant benefits towards long term sustainability of marine activities.
1.2 High added value compounds in marine by-products and waste
By-products generated during seafood processing typically range between 20 and 60% of starting raw material. For pelagic fish, such as tuna, cod, mackerel, anchovy and herring, major amounts of residues are represented by offal, head and tail (27% of the fish) collected through eviscerating, cutting and filleting processes. Skin, bones, blood and frames are the second major residues (25% of the fish) collected along skinning and cutting processes (AWARENET, 2004).At present, the majority of these by-products are sent to fish meal plants, where fish meal and fish oil are produced. Fish meal is by far the most valuable non-edible commodity produced from marine by-products; its global production ranges between 5.5 and 7.5 million tons/year (Hardy & Tacon, 2002). It is a relatively dry product, used either as animal feed or as plant fertilizer, and is composed of protein (70%), minerals
9
(10%), fat (10%) and water (10%), on a weight basis (Blanco et al., 2007). The first stage of fish meal production includes mincing, cooking and pressing of solid fish by-products, from which wastewaters and a solid cake are generated. At a second stage, those wastewaters are desludged to remove any remaining solid particles, which are then added to the solid cake, and then centrifuged to separate the oil fraction; this crude fish oil is further processed or sold as such. The water is fed back to the process line where the solid cake, along with the material from the wastewater, is dried and grounded to produce fish meal (SEAFISH, 2008). Fish oil can have edible and non-edible applications depending on its composition. Production of soap, glycerol, varnishes, drying and hydraulic oils, fertilizers and substrates for fermentation, are the most common uses, whilst its edible applications are essentially accounted for the production of margarine and shortenings (AWARENET, 2004).
Fish meal can exhibit very diverse specifications, in terms of amino acid profile, digestibility and palatability, depending on the raw material and production process employed (Blanco et al., 2007). Fish meal from pelagic fish is the most widely used, and may generate an income up to 108 Euro/ton depending on its specific composition; currently its average market value is 46 Euro/ton (SEAFISH, 2008; AWARENET, 2004). The main HAVC that can be found in marine by-products are presented in Table 1.1. The highest concentration of these bioactive compounds is generally found in the parts of the marine organisms that are discarded (AWARENET, 2004). Note that present concentrations can attain up to 80% of the by-product in question – especially in the case of lipids in cod liver. Table 1 also shows the mean market values for selected HAVC that, as expected, are strongly dependent upon purity. It must be highlighted that the least expensive HAVC – gelatin/collagen – hold a value 30-fold higher than fish meal. Finally, for HAVC such as natural free amino acids and hydroxyapatite, a market value has not been established yet, since only synthetic forms have been used until now. In the following sections, the current and potential uses of the most important types of HAVC will be described in detail together with reference to state-of-the-art technologies for extraction and purification.
Table 1.1. Content and typical market value of high added value compounds found in marine residues
High added value
compounds Marine residues Content (% w/w) Market value (Euro/kg) References
Polyunsaturated fatty acids (ω-3 and ω-6)
Algae, cod liver, oil of mackerel flesh residues
50-80% in cod liver, 23% are ω-3 PUFA
24
(as purified cod liver oil)
Bimbo, 2007; Falch et al., 2006; Mondello et al., 2006; Ward & Singh,
2005; AWARENET, 2004
Free amino acids
Mussels, fresh clams, white fish flesh residues,
crustacean shells
0.8-2% of taurine, 2.7% of creatine (on dry matter)
Not available
Larsen et al., 2007; Leuchtenberger et al., 2005;
Heu et al.,2003
Chitin and chitosan Shrimp and crab shells 15-40% 15-750
Abdou et al., 2008; Sini et al., 2007; Kurita, 2006; AWARENET, 2004; Healy et al., 2003; Kumar 2000;
Collagen and gelatin Pelagic fish skin, scales and
bones
Up to 80% in skin,
up to 50% in scales 9-14
Wang et al., 2008; Kim et al., 2007;
Wasswa et al., 2007; AWARENET, 2004
Hydroxyapatite Pelagic fish scales and bones 60-70% in bones,
up to 50% in scales Not available
Barakat et al., 2008; Aronov et al., 2007; Haberko et al., 2006
Antifreeze proteins Cold water pelagic fish blood
and skin
5-35 mg/ml in cold
water fish blood 5000
Jin & de Vries, 2006; AWARENET, 2004; Evans & Fletcher, 2004;
Crevel et al., 2002;
Astaxanthin Algae, crustacean shells 2.3-33% 3000-12000 Cervantes et al., 2006; AWARENET, 2004 Babu et al., 2008b; Yang, 2007;
Lopez-Enzymes Algae, pelagic fish viscera 14400 (cod proteases)
SEAFISH, 2008; Rasmussen & Morrissey, 2007;
11
1.2.1 Polyunsaturated fatty acids ω-3
ω-3 fatty acids concentrates remains a topic of general interest for the pharmaceutical and food industries, for the production of drugs with enhanced performance and for the production of nutritional supplements. As known, fat is a source of energy but is also a vital structural component of cellular membranes and is involved in many important cell-signaling pathways (Ma et al., 2004). Since the early studies on long-chain ω-3 polyunsaturated fatty acids (PUFA) carried out by Burr back in 1929, the health benefits of these compounds have been thoroughly investigated, so their market is expected to grow further in the future (Bimbo, 2007). Such HAVC are considered as “essential fatty acids” due to their key role in many metabolic processes and because they cannot be synthesized de novo by mammalian cells (Harris et al., 2007). Dietary ω-3 PUFA ameliorates numerous biological and physiological functions in human body, being particularly valuable in treating some diseases (Ma et al., 2004).
In cell culture, ω-3 and ω-6 PUFA are generated from the precursor α-linolenic acid and linoleic acid, respectively (Tapiero et al., 2002); the former leads to eicosapentaenoic acid (EPA, 20:5ω3) and docoesahexaenoic acid (DHA, 22:6ω3), whereas the latter leads to arachidonic acid (AA, 20:4ω6) and other long-chain ω-6 fatty acids (Harris et al., 2007; Tapiero et al. 2002). After absorption in the human body, PUFA are incorporated at cellular level into triglycerides (i.e., 3 fatty acids molecules on a glycerol backbone), phospholipids (i.e., 2 fatty acids molecules on a phosphatidic acid backbone) and cholesterol esters (i.e., 1 fatty acid molecule on free cholesterol). Some studies indicate that ω-3 PUFA are most promptly absorbed from the intestine when taken orally in the form of free fatty acids, moderately absorbed if in the triglyceride form and poorly absorbed if in ethyl esters form. However, ω-3 PUFA in the form of triglycerides are the most stable and desirable for food formulation, unlike as free fatty acids, which are easily oxidized, and as ethyl esters, which continue to be unacceptable for food purposes in terms of safety (Liu et al., 2007). The major reported effects of ω-3 PUFA - EPA and DHA - on human tissues are described in Table 1.2.
PUFA can be recovered from a number of marine by-products. Marine protists and microalgae have been referred as the major sources of EPA and DHA (Schizochytrium spp. for the specific recovery of DHA; Phaeodactylum and Monodus spp. for the specific recovery of EPA; Isochrysis galbana spp. for the recovery of both EPA and
DHA) (Ward & Sing, 2005; Robles et al., 1998). Antarctic krill (Ju & Harvey, 2004) and by-products from edible fish (e.g. sardine, anchovy, salmon and cod) are the second most important sources of PUFA (Mondello et al., 2006), followed by fish caught especially for fish meal and oil production (Bimbo, 2007).
Table 1.2. Effects of ω-3 polyunsaturated fatty acids EPA and DHA on human being
Claimed function of EPA and DHA References
Improvement of vision acuity, field of vision and adaptation to light. Alteration of permeability, fluidity, thickness and lipid phase properties of retinal photoreceptor membrane (DHA only)
Harris et al., 2007; SanGiovanni & Chew, 2005
Reduction of risk of myocardium lesion and coronary heart disease via lowering blood pressure, triglyceride levels and platelet aggregation, and prevention of arrhythmias
Harris et al., 2007; Moore et al., 2006
Protective effects against some common cancers (breast and colon) via inhibition of eicosanoids synthesis
Goldberg & Katz, 2007; Rose & Connoly, 1999
Increase of level of insulin Patel et al., 2007
Beneficial effects in sclerosis treatments via affecting functions of
central nervous system Weinstock-Guttman et al., 2005
Preventive and curative effects upon non-alcoholic fatty liver disease
via lowering liver fat content Spadaro et al., 2008
Increase of toleration to noxious therapies (e.g. chemotherapy) Morisco et al., 2007
Decrease of heart rate beating Svensson et al., 2007
Improvement of emotional state (e.g. in depression and anxiety
conditions) Raeder et al., 2007
Beneficial effects on autoimmune diseases (e.g. rheumatoid arthritis,
psoriasis, systemic lupus, Crohn‟s disease). Curtis et al., 2004
Reduction of joint pain associated with inflammatory conditions, via inhibition of central regulators of inflammation.
Fedacko et al., 2007; Goldberg & Katz, 2007
The most important natural sources of ω-3 PUFA are indeed fish oils of common species such as sardine, mackerel, cod, shark and menhaden with PUFA levels of ca. 30%, which makes them commercially interesting raw materials to prepare ω-3 PUFA concentrates (Chakraborty & Raj, 2007). In particular, cod liver has for long been the most suitable marine by-product for recovery of ω-3 PUFA, for extended use as nutraceutical, having a high content of vitamins A, D and E (Mondello et al., 2006); this oil contains high amounts of lipids (ca. 50-80%), of which 23% is accounted for EPA (Falch et al., 2006; Kolakowska et al., 2002). Anchovy and bluefin possess
13
exceptionally high DHA levels. Salmon head, which represents the main salmon by-product, is also regarded as a good source of PUFA due to a significant content of lipids, ca. 15-18% (Huang & Sathivel, 2008). Among fish flesh, mackerel is accordingly the main source of EPA/DHA: it yields ca. 15% (w/w) of oil, with 9% (w/w) of PUFAs and 4% (w/w) of DHA in particular, as triglycerides (Linko & Hayakawa, 1996). Mackerel flesh content of PUFA is in order of 1810 mg per 100 g, followed by salmon with 1800 mg per 100 g, tuna with 1500 mg per 100 g, herring with 1200 mg per 100 g), salmon trout with 1060 mg per 100 g and cod with 240 mg per 100 g (Fedacko et al., 2007).
Microcapsules containing ω-3 PUFA concentrates are a useful form of PUFA supply to the human body, as they convey an extended stability and allow for the release of the active compound in the intestine only (Kantor et al., 1990). Microencapsulation also eliminates the well-known unpleasant taste and smell of fish oil, as well as its aftertaste (particularly when ingested in relatively large quantities), and effectively prevents oxidation of PUFA. When microencapsulation is not applied, lipid peroxidation is normally difficult to avoid and addition of antioxidants to PUFA is required. For preventing oxidation several combinations have been tested: the most successful result has been achieved with a ternary antioxidant system containing α-, γ- and δ- tocopherol concentrates (in the range of 0.2-2.0 %), ascorbic acid (or ascorbyl palmitate), soy lecithin, quercetin, morin or catechin (Kamal-Eldin & Yanishlieva, 2002). Other alternative solutions have also been proposed: histidine, for instance, shows a pronounced effect towards preservation of herring oil, whereas catechin, morin and quercetin show strong antioxidant effects upon sardine oil up to 60 °C (Kamal-Eldin & Yanishlieva, 2002).
Numerous methods are currently employed for ω-3 PUFA concentration; however, only few are suitable for large-scale production. A single separation/purification method is not often feasible, because the raw material is usually too heterogeneous with relatively high contents of undesirable compounds. Nowadays, PUFA are mainly recovered as free fatty acids, after chemical or enzymatic hydrolysis of marine oil, followed by purification. Depending on the desired yield, available methods include distillation (Shahidi & Wanasundara, 1998b; Chang et al. 1989), enzymatic splitting (Halldorsson et al. 2004; Camacho-Páez et al., 2002), low-temperature crystallization (Harris et al.,
2007; Shahidi & Wanasundara, 1998b), supercritical fluid extraction (Catchpole et al., 2000) coupled or not with nanofiltration (Sarrade et al., 1998), urea complexation (Chakraborty & Raj, 2007; Gámez-Meza et al., 2003), and argentation chromatography (Chakraborty & Raj, 2007; Mondello et al.,2006). Each technique has its own advantages and drawbacks and leads to ω-3 PUFA concentrates in different forms. Chromatography, crystallization and urea complexation are useful techniques for collecting PUFA as free fatty acids (Chakraborty & Raj, 2007; Gámez-Meza et al., 2003) whereas supercritical fluid extraction, distillation and also urea complexation, are suitable techniques for the recovery of PUFA as fatty acids esters (Perretti et al., 2007; Shahidi & Wanasundara, 1998b). PUFA as acylglycerols can be obtained by enzymatic methods (Halldorsson et al., 2004; Shimada et al. 2001).
Distillation has been mentioned (Shahidi & Wanasundara, 1998b; Chang et al., 1989) to produce odorless and flavorless oils, with improved flavor and oxidative stability, which contain only insignificant amounts of undesirable minor constituents, such as thermal and oxidative polymers of unsaturated glycerides, trans-isomers, conjugated dienes and trienes, cholesterols, pesticides and heavy metals. Two distillation methods currently in use are: vacuum steam distillation followed by silica gel treatment, and short-path molecular distillation. The former cannot improve significantly the ω-3 PUFA concentration, however the resulting oil is highly pure and can already be subjected to specific techniques such as microencapsulation (Chang et al., 1989). Short-path molecular distillation has been used for partial separation of fatty acid esters; it is a rather old technique, performed at very high temperatures (250 ºC) and for very short heating intervals, in the order of seconds. This method leads to increases in EPA and DHA concentrations up to the ranges of 16-28.4% and 9-43% respectively, in the case of menhaden oil (Shahidi & Wanasundara, 1998b). However, the -3 PUFA alkyl esters form cannot be directly used for food or pharmaceutical purposes, so a further step of conversion to fatty acids or acylglycerols is required (Shahidi & Wanasundara, 1998b). To recover concentrated PUFA as acylglycerols, subcritical and supercritical fluid extraction has been performed with carbon dioxide as solvent and at various conditions depending on the fish oil initial composition. The most interesting result was obtained at 28 ºC and 7.8 MPa, with EPA showing the greatest resistance to fractionation (Perretti et al., 2007). Note that in fish oils, EPA and DHA are preferentially located in the