Integrated Master in Chemical Engineering
Development and Application of Coatings on PET
Master Thesis
ofTatiana Paula Vilela
Developed in the curricular unit Dissertation in
GOVI NV
Supervisor at FEUP: Prof. Fernão Magalhães Supervisor at GOVI NV: An Creyns
CONFIDENTIALITY NOTICE – IMPORTANT – PLEASE READ FIRST
This document may contain confidential information proprietary to GOVI NV. It is therefore strictly forbidden to publish, cite or make public in any way this document or any part thereof without the express written permission by GOVI NV. Under no circumstance this document may be communicated to or put at the disposal of third parties; photocopying or duplicating it in any other way is strictly prohibited.
Disregarding the confidential nature of this document may cause irremediable damage to GOVI NV.
NOTA CONFIDENCIAL – IMPORTANTE – POR FAVOR LER PRIMEIRO
Este documento pode conter informação confidencial propriedade da GOVI NV. Portanto é estritamente proibido publicar, citar ou tornar público este documento ou qualquer parte dele sem a expressa permissão escrita pela GOVI NV. Sob nenhuma circunstância este documento pode ser comunicado ou posto à disposição de uma terceira parte, e fotocopiar ou duplicar este de qualquer forma é estritamente proibido.
Desconsiderar a natureza confidencial deste documento pode causar irremediáveis danos à GOVI NV.
Acknowledgements
At the end of this incredible journey that was my dissertation, there are a few people that have earned my deepest gratitude.
To Professor Luís Miguel Madeira, ERASMUS coordinator at FEUP for the Chemical Engineering degree, and Jan Cocquyt, from GOVI, for making this partnership possible and granting me the great opportunity that was working at GOVI.
To my official supervisor at GOVI, An Creyns, for always being available for me and my questions, and for always wanting the best for this work. I would also like to give a special acknowledgment to my unofficial supervisors, Dirk and Tom, for always believing in this project and for giving me the best guidance possible.
To my supervisor at FEUP, Professor Fernão Magalhães, for all the notes and remarks and for all the doubts that were solved.
To my family, my mom and dad, my sister, Mariana, my grandparents, my aunt and uncle, and my cousins, Tó, Daniela, Miguel, Graça, Bi, Sofia, Lu and Sandrina for all the love and support I received while in Belgium, and for never letting me give up on my dreams.
To my childhood friends: Rita, Becas, Joca and Sara; to my college companions: Diana, Joana, Andreia, Ana, Teresa, Tiago, Catarina, Francisca, Souto, Margarida and Alexandra; and to my Belgium buddies: Adriana and Maria. Thank you for making this semester go by so fast and for always listening to me and supporting me when I needed you.
To all of you the best of luck and success in the future. Thank you.
Resumo
O PET, ou polietileno tereftalato, é um polímero termoplástico utilizado globalmente como material para embalagens alimentares. Este polímero é um dos mais usados devido a uma série de propriedades que o caracterizam, tais como o facto de ser inquebrável, leve, transparente e de possuir boas propriedades barreira, apesar de estas não serem tão boas como as presentes no vidro.
Assim, o principal objetivo deste trabalho é encontrar e formular revestimentos para o PET que sejam economicamente viáveis, de fácil aplicação e que tenham uma boa adesão e propriedades barreira, de modo a melhorar e otimizar as propriedades do PET. Para este efeito, foram testados em garrafas de PET e em aparelhos de pressão de PET, revestimentos sintéticos e biológicos. Estes revestimentos foram testados tendo em conta vários parâmetros como a adesão ao substrato e as propriedades barreira referentes ao oxigénio, dióxido de carbono e vapor de água.
Normalmente, se o revestimento não possuir uma boa adesão ao PET, sendo este um dos fatores mais importantes, este não poderá ser utilizado no polímero em questão, a não ser que seja implementado um sistema de multicamadas.
Em relação à barreira contra a entrada oxigénio, a variação da concentração deste gás foi medida com recurso a um sensor, utilizando garrafas cheias de água ou garrafas vazias; em relação à barreira contra a saída de dióxido de carbono a variação da concentração foi medida num equipamento especializado, usando garrafas cheias de água.
Já no caso da barreira contra a saída de vapor de água, o decréscimo do peso foi medido em garrafas colocadas num forno a 40ºC.
O VAC foi o material que melhor adesão teve no PET, sendo portanto utilizado como primer. Os revestimentos seguintes, PVDC 2, VAC+PVDC 2, PEC 2, EVOH, PEC 4, PVOH 4 e PSC, obtiveram os melhores resultados em termos de melhoramento da barreira gasosa; e o revestimento VAC+PVDC 2 obteve o melhor resultado em termos de melhoramento da barreira de vapor de água.
Abstract
PET, or polyethylene terephthalate, is a thermoplastic polymer used as a packaging material worldwide. It is one of the top choices because it has a series of properties like its unbreakability, low weight, high clarity and good gas and moisture barrier properties, however not as good as the glass barrier properties.
Therefore, the main goal of this work is to find and formulate coatings for PET which are economically viable, easy to apply and that have good adhesion and gas barrier against oxygen and carbon dioxide, as well as a good moisture barrier, in order to improve and optimize the packaging properties of PET. For that, both synthetic and bio-based coatings were tested on PET bottles and PET pressure devices. That way the coatings were tested for several parameters like adhesion, oxygen and carbon dioxide barrier and water vapour barrier.
Normally, if the coating does not provide a good adhesion to the PET, which is the most important factor, it cannot be used in that material, unless a multilayer system is created. Regarding the oxygen barrier, the concentration variation was measured with a sensor, using bottles filled with water and empty bottles; as for the carbon dioxide barrier the concentration variation was measured using a proper equipment using bottles filled with water.
In the water vapour barrier test the water weight decrease was measured on the bottles placed in an oven at 40ºC.
VAC showed good adhesion on PET and was therefore used as a primer. PVDC 2, VAC+PVDC 2, PEC 2, EVOH, PEC 4, PVOH 4 and PSC showed the best results in terms of improving the gas barrier; and VAC+PVDC 2 showed the best results in terms of improving the moisture barrier.
Declaração
Declaro, sob compromisso de honra, que este trabalho é original e que todas as contribuições não originais foram devidamente referenciadas com identificação da fonte.
Tatiana Paula Vilela
Index
1
Introduction ... 1
1.1
Background and Project Presentation ... 1
1.2
GOVI – Company Presentation ... 5
1.3
Work Contributions ... 6
1.4
Thesis Outline ... 7
2
State of Art ... 8
2.1
Barrier Properties ... 8
2.1.1
Factors Affecting Permeability, Diffusivity and Solubility ... 8
2.2
Barrier Coatings ... 15
2.2.1
Synthetic Polymers ... 17
2.2.2
Natural Polymers ... 20
3
Technical Description and Results Discussion ... 24
3.1
Experimental Work ... 24
3.1.1
Adhesion Test ... 24
3.1.2
Gas Barrier Test ... 25
3.1.3
Water Vapour Test ... 30
3.2
Results and Discussion ... 30
3.2.1
Adhesion Test ... 30
3.2.2
Gas Barrier Test ... 32
3.2.3
Water Vapour Test ... 42
4
Conclusion and Future Work ... 45
References ... 47
List of Figures
Figure 1 – Representation of the two-step reaction that originates PET. ... 2
Figure 2 – Representation of the PET preform manufacturing process. ... 3
Figure 3 – Stretch blow molding process scheme. ... 4
Figure 4 – Map showing the several locations of GOVI in Europe, represented by the countries in green. ... 6
Figure 5 – Permeation mechanism for gas and water vapour molecules through a plastic film. 9 Figure 6 – Effect of temperature on oxygen permeability at 75% relative humidity. ... 10
Figure 7 – Effect of CED on oxygen permeability for six barrier polymers: polyethylene (PE), polystyrene (PS), poly(vinyl acetate) (PVA), poly(vinyl chloride) (PVC), polyacrylonitrile (PAN) and poly(vinyl alcohol) (PVOH). ... 12
Figure 8 – Effect of relative humidity on oxygen permeability of hydrophilic barrier polymers. AmNY is amorphous nylon, BON is biaxially oriented nylon 6, MXD-6 is oriented poly(metaxylylenediamine-adipic acid), and EVOH 44 and 32 are ethylene vinyl alcohol copolymers containing 32 and 44 mol% ethylene. ... 14
Figure 9 – Polyvinyl alcohol chemical structure. ... 17
Figure 10 – Ethylene Vinyl alcohol chemical structure. ... 18
Figure 11 – Oxygen permeability and water vapour transmission rate (WVTR) as a function of ethylene content for EVOH copolymers. ... 19
Figure 12 – Oxygen permeability of some selected polymers at 23°C and 0% relative humidity. ... 19
Figure 13 – Polyvinylidene chloride chemical structure. ... 20
Figure 14 – Pectin chemical structure. ... 21
Figure 15 – Chitosan chemical structure. ... 22
Figure 16 – Pullulan chemical structure. ... 23
Figure 17 – Bottle closed with the special cap, for posterior measurement of the oxygen variation. ... 25
Figure 18 – Drying of the bottles at room temperature. ... 26 Figure 19 – Empty bottle being flushed with nitrogen. ... 27 Figure 20 – Filled bottle being filled with nitrogen. ... 28 Figure 21 – Oxygen barrier test results for PEC 4 and EVOH coatings, performed in empty bottles. ... 33 Figure 22 – Oxygen barrier test results for a pectine, PEC 2, performed in empty bottles. ... 34 Figure 23 – Oxygen barrier test results for PSC and PVOH 4 coatings, performed in empty bottles. ... 36 Figure 24 – Oxygen barrier test results for PVDC coatings, performed in filled bottles. ... 37 Figure 25 – Oxygen barrier test results for PVDC coatings, performed in empty bottles, in different drying conditions. ... 39 Figure 26 – Oxygen barrier test results for PVDC coatings, performed in filled blown preforms. ... 40 Figure 27 – Carbon dioxide barrier test results for the PVDC 2 and VAC+PVDC 2 coatings. .... 41 Figure 28 – Water vapour barrier test results for the coatings tested. ... 43 Figure 29 – Oxygen barrier test results for pectines with 3 and 5 layers, namely PEC 1, PEC 3 PEC 5 and talc, performed in empty bottles. ... 49 Figure 30 – Oxygen barrier test results for pullulan with 3 and 5 layers, performed in empty bottles. ... 49 Figure 31 – Oxygen barrier test results for PVOH’s with 3 and 5 layers, namely PVOH 1, PVOH 2 and PVOH 3, performed in empty bottles. ... 50 Figure 32 – Oxygen barrier test results for PVDC 1 coating, performed in filled bottles. ... 50 Figure 33 – Oxygen barrier test results for PVDC 3 coating, performed in filled bottles. ... 51 Figure 34 – Water vapour barrier test results for a PVB based coating and some hydrocarbon solvents. ... 53
List of Tables
Table 1 – Values of OTR and WVTR for some selected polymers. ... 16 Table 2 – Results obtained for several coatings on the adhesion test. ... 31 Table 3 – Calculated slopes for the PEC 4 and EVOH coatings analyzed in the oxygen barrier test. ... 33 Table 4 – Calculated slopes for the PEC 2 coatings analyzed in the oxygen barrier test. ... 35 Table 5 – Calculated slopes for the PSC and PVOH 4 coatings analyzed in the oxygen barrier test. ... 36 Table 6 – Calculated slopes for the PVDC 2 based coatings analyzed in the oxygen barrier test. ... 38 Table 7 – Calculated slopes for the coatings analyzed in the oxygen barrier test and the
current solution used by the company. ... 40 Table 8 – Calculated slopes for the coatings analyzed in the water vapour test. ... 44 Table 9 – Evolution of the weight overtime for the coatings presented in section 3.2.3. ... 52 Table 10 – Evolution of the weight overtime for the PVB based coating and some hydrocarbon solvents. ... 53
Glossary
List of units
Area m2
Cohesive Energy Density cal.cm-3
Diffusivity cm2.s-1
Pre-exponential factor s-1
Penetrant diffusion coefficient on the amorphous phase cm2.s-1
Activation energy for diffusivity J.mol-1
Activation energy for permeability J.mol-1
Heat of adsorption of penetrant in the polymer J.mol-1
Initial mass of the bottle g
Mass of the bottle over time g
Oxygen Transmission Rate nmol.m-1.s-1
Permeability cm3.cm-1.s-1.bar-1
Pre-exponential factor s-1
Constant of ideal gases J.mol-1.K-1
RH Relative Humidity %
Solubility cm-3.cm-2.bar-1
Pre-exponential factor s-1
Solubility coefficient in the amorphous regions cm-3.cm-2.bar-1
Temperature K
Glass transition temperature K
Melting point K
Water Vapour Transmission Rate nmol.m-1.s.1
Chain immobilization factor Tortuosity
A
CEDD
D
0D
aE
dE
pH
sm
im
t OTRP
P
0R
SS
0S
aT
T
gT
m WVTRβ
List of Abbreviations
AN Acrylonitrile AmNY Amorphous Nylon BON Biaxially oriented nylon DMT Dimethyl terephthalate EVOH Ethylene vinyl alcohol HDPE High density polyethylene LDPE Low density polyethylene MXD-6 Nylon
PAN Polyacrylonitrile PE Polyethylene PEC Pectine
PET Poly(ethylene terephthalate) PP Polypropylene
PS Polystyrene PSC Polysaccharide PU Polyurethane PV Pressure Valve PVA Polyvinyl acetate PVB Polyvinyl butyral PVC Polyvinyl chloride PVDC Polyvinylidene chloride PVOH Polyvinyl alcohol RT Room temperature TA Terephthalic acid VAC Vinyl copolymer
1 Introduction
1.1 Background and Project Presentation
PET – Polyethylene terephthalate: an introduction
PET, the common name for polyethylene terephthalate when used in packaging applications, is a thermoplastic polymer from the polyester family. It is considered the world’s packaging choice for several types of food and beverages, because of some characteristics associated with this polymer, like the fact that it is hygienic, strong, shatterproof, an inert material, resistant to microorganism attacks and it retains freshness. [1]
The melting point, Tm, of this polymer is 270°C, and the glass transition temperature, Tg, is 61°C. Because of its high crystalline melting temperature and stiff polymer chains, PET has good mechanical strength, toughness, and fatigue resistance up to 150–175°C as well as good chemical, hydrolytic, and solvent resistance. [2]
This polymer is also recyclable and highly sustainable, in spite of the fact that the feedstocks for PET are petroleum based. PET allows more product to be delivered with less packaging weight and less fuel than most other container materials. [1]
PET is the most favorable packaging material worldwide for beverages, because it presents excellent material properties, especially its unbreakability, which provides easier transportation and extra safety, both for the manufacturer and the consumer; and very low weight of the bottles, when compared to glass bottles of the same filling volume. PET has also a high clarity as well as good barrier properties towards moisture and oxygen, however not as good as glass for instances. [3]
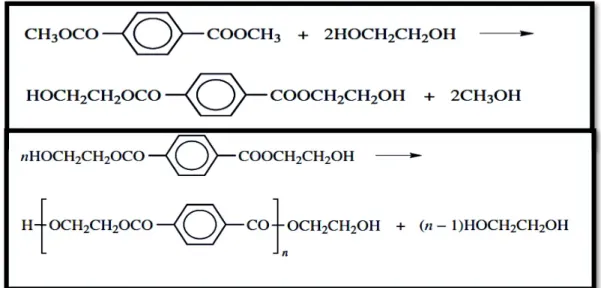
Two processes are used for the synthesis of PET, one based on dimethyl terephthalate, DMT, and the other on terephthalic acid, TA. The DMT process was the first to be commercialized because DMT was available in the required purity, but TA was not. That is no longer the case, pure TA is available, and both processes are used. The DMT process is a two-stage ester interchange process between DMT and ethylene glycol. The first stage is an ester interchange to produce bis(2- hydroxyethyl)terephthalate along with small amounts of larger-sized oligomers. The reactants are heated at temperatures increasing from 150 to 210°C and the methanol is continuously distilled off. In the second stage the temperature is raised to 270– 280°C and polymerization proceeds with the removal of ethylene glycol. [2]
In figure 1, the two steps of the reaction that originate PET are represented.
Figure 1 – Representation of the two-step reaction that originates PET.
Image adapted from [2].
When the time comes to reheat the pellets into a molten liquid stage, the polymer chains can be stretched in two different ways: for fibers they are stretched in one direction; and for bottles and films they are stretched in two directions. Once set in stretched form the material is very tough, however if the polymer is held in stretched form at very high temperatures it slowly crystallizes, and becomes more rigid and less flexible. This last form of PET is used, for example, for trays to be reheated in the microwave or in the oven. [4]
The American company DuPont first synthesized PET in the mid 1940s. The objective was to find a polymer that could be used to make new textile fibers. In the 1950s a way to create PET film from the stretch of a thin extruded sheet of PET was discovered. Nowadays PET films are used as video, photography and x-ray film and also packaging films. [4]
Finally in the 1970s the technology of the blow-stretch molding of PET into bottles was discovered. [1]
Production of PET
PET preforms
PET preforms are the origin of PET bottles, therefore it’s important to know their production technology. Figure 2 represents a scheme of the process of manufacturing PET preforms discussed below.
Figure 2 – Representation of the PET preform manufacturing process.
Image adapted from [5].
Legend
Firstly the PET resin granules are dried until a residual water content below 200 ppm is achieved. Then the resin is melted at temperatures between 275°C and 285°C, which is important not to exceed, in order to limit the production of decomposition products. This melting occurs in a sleeve provided with a particular plasticizing screw. The resin is then transferred to a hot runner distributor provided with at least one nozzle and at least one heating plug, which are heated to a temperature between 260°C and 275°C, in order to inject the resin into the preform mold. Finally in the cooling stage, the preforms are ejected from the mold and cooled to a temperature between 0°C and 10°C. During this stage the injection of additional plastic at constant pressure is made, in order to compensate the shrinkage of plastic material. [6]
PET bottles
Being the objective of this work the finding of a suitable coating for the application on PET bottles, it is crucial to know their production technology.
PET bottles are obtained through the stretch blow molding process. For that, the preforms have to be heated in a blow-molding or biaxial drawing to a temperature where the chain mobility of the polymer can be achieved. Then the preforms are blown and stretched into a bottle, using compressed air. In order to obtain the maximum orientation of the chains the cooling stage has to happen fast, and the PET molecules will be biaxially oriented, which improves barrier properties, transparency and solvent resistance. Finally the PET bottles are ejected from the mold. [6]
In figure 3, a scheme of the stretch blow molding process is represented.
Figure 3 – Stretch blow molding process scheme.
PET bottles with a pressure dispenser
These PET bottles combine a unique strength and integrity not achievable with the normal blow molding process. They have a separate bottom piece, a pressure dispenser, in which is located the lower pressure valve (lower PV), discussed below.
Lower Pressure Valves (PV’s)
The current issue with the bottles mentioned above is the fact that, with time, pressure is lost in the lower PV’s, which means that air is lost. Therefore it was also pertinent to develop a coating for this part with an excellent gas barrier, so that this problem would be addressed.
Considering all that’s been said above one of the main goals of this work is to find and formulate coatings for PET which are economically viable, easy to apply and that have good adhesion and gas barrier against oxygen and carbon dioxide, as well as a good moisture barrier.
A second objective to be accomplished in this work is finding a suitable coating for the lower PV parts of the PET bottles with a pressure dispenser. The coating must have characteristics similar to the one applied in PET bottles, however, for the lower PV’s a good gas barrier is more important than a good moisture barrier.
The final objective of this work is the testing of bio-based coatings, which means coatings that are non-dependent on petroleum.
1.2 GOVI – Company Presentation
GOVI Engineered Chemicals is a company who’s headquartered in Belgium. It was incorporated in 1910 and it’s a manufacturer of engineered, tailor made process-chemicals, which are supplied to a variety of industries.
GOVI’s chemicals are developed for several industries such as dust binding, insulation, paper, printing, rope & netting, textiles and wood.
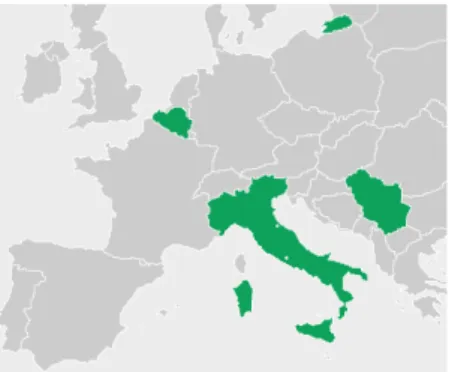
GOVI has an R&D center, as well as a production unit in its headquarters in Drongen, Belgium. However GOVI is located in other spots as well. As can be seen in figure 4, this company is also placed in Italy and Serbia. [8]
Figure 4 – Map showing the several locations of GOVI in Europe, represented by the countries in green.
Image adapted from [8].
1.3 Work Contributions
Nowadays, adding value to a certain product is a way of differentiating a company. The PET industry is no exception and when it comes to PET preforms and bottles with good gas and moisture barriers the market is still wide open. Therefore, this project intends to make the whole process more environmentally friendly and also make the application of these coatings easier.
Regarding the application of bio-based coatings, this is a very important part of this work because of the increasing demand of the consumers to have recyclable, non-petroleum based materials used in the food industry. Also, for products with a short shelf life it’s important to find more economic ways for packaging, as well as a way to create less pollution and environmental problems.
1.4 Thesis Outline
This thesis has four main chapters.
In the first chapter an introduction to the company and the project and its goals is made, as well as to the PET manufacturing, history and production.
In the second chapter is presented the state of art, which consists in a literature review concerning some aspects of this project, mainly the presentation of some barrier coatings and polymers.
In the third chapter the technical description of the experimental methods used, as well as the results discussion for each method is presented.
In the fourth and final chapter some conclusions about the results obtained are presented, as well as some considerations regarding the future work that has to be done.
2 State of Art
The barrier properties of polymers, more specifically gas and moisture barriers are currently a subject of high commercial importance, due to their importance in increasing the final product quality and its shelf life.
2.1 Barrier
Properties
The term high barrier is usually applied in cases of low to very low permeability of a material to low molecular weight chemical species such as gases and organic compounds. [9] So it can be said that some polymeric materials, such as PET have good gas and moisture barriers, however these can be highly improved by the application of barrier coatings, that will achieve high barrier properties in the material, which is particularly useful in food packaging.
2.1.1 Factors Affecting Permeability, Diffusivity and Solubility
Certain factors, as described below, have the ability of improving barrier properties of polymers, by affecting the mechanical properties of the molecule.
A basic understanding of the permeation process can help clarify the barrier characteristics of polymers [10], because contrary to glass or metal packaging materials, plastics are permeable at different degrees to small molecules like gases, water vapour, and organic vapour and to other low molecular weight components. [11]
As it can be observed in figure 5, the permeation process starts with the molecules being adsorbed and dissolved into the polymer mass by colliding with the polymer surface; then the molecules diffuse through the polymer; and finally, after crossing the barrier polymer, the molecules move to the polymer surface, desorb, and move away. [10]
Figure 5 – Permeation mechanism for gas and water vapour molecules through a plastic film.
Image adapted from [10].
The permeation process is affected by several factors, as explained below.
Temperature
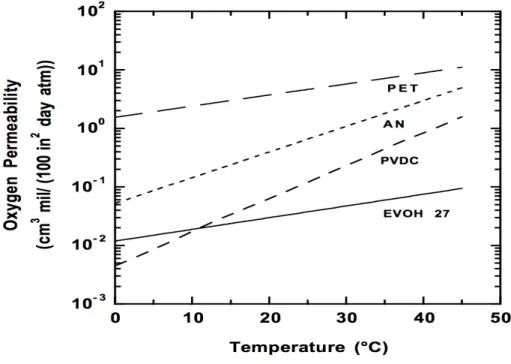
Permeability, diffusivity and solubility increase with increasing temperature for all known cases [10], due to the increased energy level of the permeating molecules and the increased free volume in the polymer matrix. [11] In order to illustrate this behavior, figure 6 shows the effect of temperature on oxygen permeability for some barrier polymers. [12]
Figure 6 – Effect of temperature on oxygen permeability at 75% relative humidity.
Image adapted from [12].
The dependence between temperature (T) and permeability (P), solubility (S) and diffusion (D), is described by the Arrhenius equation, and Van’t Hoff relationship, respectively, in the following forms: 𝑃 = 𝑃!exp − 𝐸! 𝑅𝑇 𝐷 = 𝐷!exp −𝐸! 𝑅𝑇 𝑆 = 𝑆!exp − 𝐻! 𝑅𝑇 (1) (2) (3)
Where P0, D0 and S0 are pre-exponential factors; Ep and Ed are the activation energies for permeation and diffusion, respectively; T is the temperature; R is the gas constant; and Hs is the heat of sorption. [11]
It’s important to state that the equations represented above can only predict the effect of temperature above the glass transition temperature (Tg), because below this temperature the polymer conformation is set, therefore the rotational movements, responsible for diffusional properties, are blocked. [11] Also, the temperature sensitivity is greater for larger permeant molecules. [10]
If a plot of P vs. 1/T is represented, it will yield a straight line, with a slope proportional to Ep. [10]
Crystallinity
The sorption and diffusion phenomena take place exclusively in the amorphous phase of a semicrystalline polymer, therefore the crystalline portion increases the effective path length of gas diffusion and reduces the polymer chains mobility in the amorphous phase. [11]
Also increasing crystallinity generally decreases gas permeability, and this factor influences both solubility and diffusion coefficients. The crystalline regions, being much more dense and well ordered than the amorphous regions, will reduce the penetrant solubility, due to the decreased free volume in the polymer molecule. [12]
The model used to predict the effect of crystallinity on steady-state permeability is represented in the following equation:
Where Sa is the solubility coefficient in the amorphous regions; Φa is the volume fraction in the amorphous phase; Da is the penetrant diffusion coefficient in the amorphous phase; τ is the tortuosity factor; and β is the chain immobilization factor. [12]
Chemical Structure
One thing that can increase the glass transition temperature and packaging density, and improve mechanical properties is the presence of polar groups in polymer chains, since these groups increase the chain rigidity. [12]
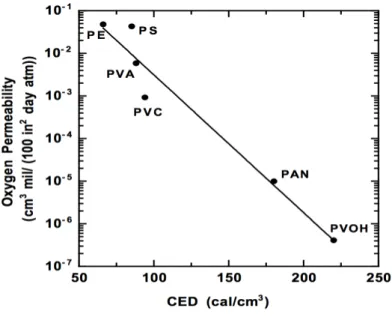
Polymer chain interactions can be quantified in terms of cohesive energy density (CED), which is the square of its solubility parameter and characterizes the strength of attraction between polymer chains. In order to illustrate this behavior, figure 7 shows the effect of CED on oxygen permeability for some barrier polymers. [12]
Figure 7 – Effect of CED on oxygen permeability for six barrier polymers: polyethylene (PE), polystyrene (PS),
poly(vinyl acetate) (PVA), poly(vinyl chloride) (PVC), polyacrylonitrile (PAN) and poly(vinyl alcohol) (PVOH). Image adapted from [12].
As shown in the figure above the logarithm of penetrant diffusion coefficients decreases linearly with increasing CED, for the barrier polymers considered. [12]
Adding some substituents to the polymer chain can also reduce the chain flexibility, which consequently decreases penetrant diffusivity and permeability. These substituents can be, for example, aromatic groups, which are rigid and bulky. On the contrary, flexible linkages, like methylene groups, produce the opposite effect. [12]
Net effects are difficult to predict, because although adding bulky side groups can stiffen the polymer chains, the same modification can also decrease chain packing in the amorphous phase and reduce the level of crystallinity, which can increase the diffusion coefficients. [12]
Humidity
When a polymer equilibrates with a humid environment, it absorbs water. The humidity in the environment is often above 50%RH, and as far as barrier polymers are concerned, their permeability can decrease, increase or have no change what so ever, with increasing humidity. PET and amorphous nylon show a slight decrease in the oxygen permeability at moderate humidity, which means an improved gas barrier; vinylidene chloride copolymers, acrylonitrile copolymers and polyolefin permeabilities are not affected by absorbed water. [10]
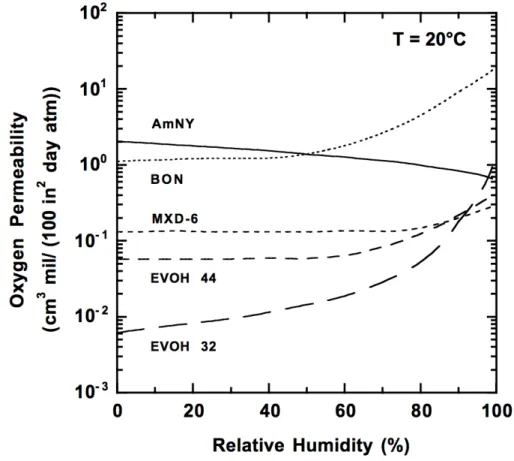
In order to illustrate this behavior, figure 8 shows the effect of relative humidity on oxygen permeability for some barrier polymers. [12]
Figure 8 – Effect of relative humidity on oxygen permeability of hydrophilic barrier polymers. AmNY is amorphous
nylon, BON is biaxially oriented nylon 6, MXD-6 is oriented poly(metaxylylenediamine-adipic acid), and EVOH 44 and 32 are ethylene vinyl alcohol copolymers containing 32 and 44 mol% ethylene.
Image adapted from [12].
In the figure above it can be seen that some hydrophilic barrier polymers, with the exception of certain amorphous polyamides, lose their barrier properties with increasing relative humidity. This happens because water acts as a plasticizer and increases the free volume of the polymer, however this does not happen on PET, as referred above, because the water molecules actually occupy free volume sites in the polymer, rather than swelling it, resulting in reduction in permeability of other gases. [12]
2.2 Barrier Coatings
Coatings are applied to the surfaces of plastic films, or to rigid plastics, to improve heat-sealing and barrier properties, especially oxygen and moisture barriers. [13]
Regarding the methods of application, there are several, being the most common the etched roll and the water-based coating systems. [13]
The definition of a barrier polymer depends upon the end use requirements, and a material that provides sufficient barrier for a particular application can be considered to be a barrier polymer for that purpose. [12] However the key attributes that will be considered in the present work are the resistance to transport of gases, more specifically oxygen and carbon dioxide; and the resistance to transport of water vapour. These attributes are of most importance in order to protect the package contents, in the food industry, because it ensures that the product properties are kept and that the shelf life is fulfilled.
In table 1, represented below, some values of OTR’s (oxygen transmission rate) and WVTR’s (water vapour transmission rate) are shown, for some selected polymers.
Table 1 – Values of OTR and WVTR for some selected polymers. [10]
a At 23°C and 0% RH b At 38°C and 90% RH c At 40°C and 90% RH d At 24°C
Below two types of barrier polymers will be described: the synthetic polymers and the natural polymers.
Polymer OTR,
nmol/(m.s) a
WVTR,
nmol/(m.s) b
Vinylidene chloride copolymers
(PVDC) 0,02-0,30 0,005-0,05
Polypropylene 300-500 0,16
Ethylene-vinyl alcohol (EVOH)
32%mol ethylene 0,03 0,96 c 44%mol ethylene 0,12 0,36 c Polyethylene Low density 500-700 0,35 High density 200-400 0,095
Polyethylene terephthalate (PET) 6-8 0,45
2.2.1 Synthetic Polymers
Modern synthetic polymers have been used for over 50 years as barriers to mass transport of liquids and gases. [10] These polymers are derived from petroleum oil based materials.
Some synthetic polymers that are known to provide a good barrier to oxygen are described below.
Polyvinyl Alcohol
Polyvinyl alcohol, PVOH, whose chemical structure is represented in figure 9, is produced by the polymerization of vinyl acetate monomer followed by partial hydrolysis, usually by a continuous process. [14]
PVOH is an odorless and tasteless, translucent, white or cream-colored granular powder, soluble in hot water, used as a moisture barrier film for food supplement tablets and for foods that contain inclusions or dry food with inclusions that need to be protected from moisture uptake. [14]
Figure 9 – Polyvinyl alcohol chemical structure.
Image adapted from(http://en.wikipedia.org/wiki/Polyvinyl_alcohol)
used, copolymerizing PVOH with EVOH or even combining the PVOH with a primer like VAC, that can be used as first and final layer in the coating process.
Ethylene Vinyl Alcohol
Ethylene vinyl alcohol, EVOH, whose chemical structure is represented in figure 10, is a semi-crystalline copolymer of ethylene and vinyl alcohol made by the hydrolysis of ethylene vinyl acetate copolymers. It is one of the best-known flexible thermoplastic oxygen barrier materials in use today. [15]
Figure 10 – Ethylene Vinyl alcohol chemical structure.
Image adapted from(http://www.5layer.com/)
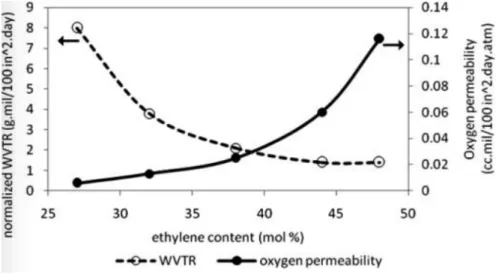
Generally, copolymers of higher vinyl alcohol content have properties resembling those of PVOH (more rigid and with better gas barrier). Similarly, those with higher ethylene contents resemble properties of PE (more flexible, less sensitive to moisture, but with a decreased gas barrier). In figure 11 the oxygen permeability and water vapour transmission is shown as a function of ethylene content for EVOH copolymers, illustrating the previous explanation. [15]
Figure 11 – Oxygen permeability and water vapour transmission rate (WVTR) as a function of ethylene content for
EVOH copolymers. Image adapted from [15].
At low to moderate relative humidity, EVOH provides an excellent barrier to gases, as seen in figure 12 [15], due to the OH groups that contribute strongly to increasing chain cohesive energy density. As the relativity humidity increase, the barrier properties of EVOH decrease, because this OH groups are also responsible for the hydrophilic nature of the polymer. EVOH is, therefore very sensitive to moisture, fact that can be improved by achieving higher proportions of ethylene units, or by biaxial orientation. [12]
EVOH is used commercially as part of a multilayer structure with moisture barrier and structural layers on each side. [12]
Polyvinylidene Chloride Copolymer
Polyvinylidene chloride (PVDC), whose chemical structure is represented in figure 13, copolymers were synthesized to overcome the difficulties in the processing of the homopolymer, due to the proximity of its melting point with its decomposition temperature. By adding comonomers, the melting point can be decreased, making melt processing practicable. [12]
Figure 13 – Polyvinylidene chloride chemical structure.
Image adapted from(http://pslc.ws/macrog/kidsmac/saran.htm)
PVDC copolymers are semi-crystalline, chemically resistant, and have very low permeabilities to gases and water vapour. Unfortunately, PVDC has problems in recycling, and the chloride group is an environmental issue, therefore this copolymer is not the most used, despite its outstanding barrier properties. [12]
2.2.2 Natural Polymers
Natural polymers occur in nature, are developed from renewable resources, and can provide good oxygen barrier, therefore its applicability in food packaging. However, their moisture barrier is usually very weak, which troubles the processing of these materials. Non-the less, consumers are demanding that food packages be more natural, disposable, biodegradable and recyclable. [16]
Pectines
Pectines, whose chemical structure is represented in figure 14, are structural heteropolysaccharides present in the primary cell walls and middle lamella of many plants. They are used as coatings and stabilizers in the food industry; thickening agents and gelling agents; and in capsules and medicines. [17]
Figure 14 – Pectin chemical structure.
Image adapted from (http://sci-toys.com/ingredients/pectin.html)
Pectines are extracted from citrus fruits, like apples or citrus peel, and are recyclable, however are very sensitive to moisture, therefore the presence of a sealant coating is mandatory, when this material is used as an edible coating.
Chitosan
Chitosan, whose chemical structure is represented in figure 15, is a natural polymer obtained by deacetylation of chitin, which is found in the exoskeleton of crustaceans such as crabs, krill and shrimps. [18]
Figure 15 – Chitosan chemical structure.
Image adapted from (http://www.jnanobiotechnology.com/content/9/1/55/figure/F6?highres=y)
Chitin is the second most abundant polysaccharide found, next to cellulose, however chitosan have so far only been found in the cell walls of certain fungi. Chitosan can be applied in the food industry as an antimicrobial agent, in edible films and coatings and as an additive. [17]
Chitosan has been found to be non-toxic, biodegradable, biofunctional, biocompatible and has strong antimicrobial and antifungal activities. This biopolymer has excellent oxygen and carbon dioxide permeability properties and a low cost, and it’s been proved that the incorporation of nanoparticles in the films of chitosan highly improved its mechanical and barrier properties, as well as its thermal stability. However chitosan is also very moisture sensitive and it’s only soluble in solutions with a pH lower than 6. [19]
Pure chitosan films are cohesive, compact and the film surface has a smooth contour without pores or cracks. [20]
Pullulan
Pullulan, whose chemical structure is represented in figure 16, is a linear, non-toxic, soluble in water, neutral glucan produced by fermentation from a food grade hydrolysed starch using a non-toxic producing strain of Aureobasidium pullulans. [21]
Figure 16 – Pullulan chemical structure.
Image adapted from (http://www.chihonbio.com/english/products/pullulan.html)
This biopolymer is used as a glazing agent, a film-forming agent and a thickener, and the aqueous solutions formed are stable and show a relatively low viscosity. Pullulan forms thermo-stable, transparent, elastic, antistatic films, with extremely low oxygen permeability. It is a good adhesive, moldable and spinnable. [21]
3 Technical Description and Results Discussion
3.1 Experimental Work
3.1.1 Adhesion Test
Adhesion is the mutual attraction between different molecules without the presence of a chemical bond, and it is a very important parameter to consider when it comes to choosing the coating. The adhesion of the coatings was tested using the cross cut (or tape method) described below.
Adhesion Test (Cross Cut)
1. Cut the top and bottom of a PET bottle and cut the middle part open, in order to obtain a rectangle.
2. With a 50 µm coater, apply the coating on the PET rectangle (flat, between two 5L bottles), and let it dry at RT (Room Temperature).
3. Using a cutter, make a square with 6 horizontal and 6 vertical lines with an intermediate space of about 2 mm, in order to get 25 little squares.
4. Place a tape on the squares, press it well and then rip it off.
5. Count the squares that didn’t come off with the tape and multiply by 4 to get a percentage of adhesion.
3.1.2 Gas Barrier Test
The gas barrier, more specifically, the oxygen and carbon dioxide concentrations were measured in filled and empty bottles using a sensor.
The special cap used in the bottles for the oxygen barrier test contains a sensor, whose signal is read by the equipment.
Figure 17 illustrates the bottles closed with the special cap.
Figure 17 – Bottle closed with the special cap, for posterior measurement of the oxygen variation.
The methods of preparation of the filled and empty bottles are described below.
Oxygen gas barrier test performed in empty bottles
1. Take the initial weight of the bottle, without coating.
2. Coat the bottle of PET by dipping it until the neck and let it dry at RT until it’s touch dry.
Figure 18 illustrates the drying of the bottle at room temperature.
Figure 18 – Drying of the bottles at room temperature.
3. Put the bottle in the oven at 40°C and let it dry there for about 40 min.
4. Follow up the drying by measuring the change in weight on an analytical balance. 5. When the bottle is dried, which means the weight is constant, apply a new thin layer,
and follow this method until the number of layers wanted is reached.
6. Put the bottle and a special cap in a polyethylene bag and flush it with nitrogen for about 30 seconds, letting the bag inflate and deflate, in order to pull out the oxygen from the bottle.
Figure 19 illustrates the flushing of an empty bottle with nitrogen.
Figure 19 – Empty bottle being flushed with nitrogen.
7. Put the special cap on the bottle, while they are still both in the PE bag.
8. Put the bottle in an oven at 30°C and measure de O2 variation using the sensor. The first measurement can be taken about 15 minutes after the bottle is placed in the oven.
9. Measure de O2 variation at least 2 times a week for about 2 months.
Oxygen gas barrier test performed in bottles filled with water
1. Take the initial weight of the bottle, without coating.
2. Coat the bottle of PET by dipping it until the neck and let it dry at RT until it’s touch dry.
5. When the bottle is dried, which means the weight is constant, apply a new thin layer, and follow this method until the number of layers wanted is reached.
6. Fill the bottles with demineralized water and flush it with nitrogen for about 40 min to take out the oxygen from the water.
Figure 20 illustrates a filled bottle being flushed with nitrogen.
Figure 20 – Filled bottle being filled with nitrogen.
7. Remove the flushing equipment from the bottle, and quickly put the special cap on it. 8. Put the bottle in an oven, leaving it there overnight.
9. The next day start taking the measurements of the O2 variation. Do this at least 2 times a week for about 2 months.
Carbon dioxide gas barrier test performed in bottles filled with water
1. Take the initial weight of the bottle, without coating.
2. Coat the bottle of PET by dipping it until the neck and let it dry at RT until it’s touch dry.
3. Put the bottle in the oven at 40°C and let it dry there for about 40 min.
4. Follow up the drying by measuring the change in weight on an analytical balance. 5. When the bottle is dried, which means the weight is constant, apply a new thin layer,
and follow this method until the number of layers wanted is reached.
6. Fill the bottle with approximately 480 g of demineralized water and close it tightly with a normal cap.
7. Put the bottle in the refrigerator overnight, so that more CO2 can be dissolved into the water posteriorly.
8. The next day take the bottle out of the refrigerator and remove the cap.
9. Set the CO2 bottle to 5 bar pressure to be applied into the bottle, by opening the pressure valve.
10. Place the tap on top of the bottle (it will fit in where the cap used to be). Make sure that the valve of the cap is closed.
11. Connect the pressure cable to the tap and open the valve, so that the carbon dioxide comes in.
12. Turn the bottle upside down and shake it for about 1 minute, until the water is saturated with CO2.
13. Close the valve, remove the pressure cable and the tap from the bottle and put the cap back in.
14. Shake the bottle for 20 seconds before measuring the CO2 content, in order to improve the equilibrium.
15. Put the bottle on the support and measure the CO2 content. Make sure that the temperature sensor is in the middle of the bottle.
3.1.3 Water Vapour Test
The method used to measure the loss of water in the coated bottles of PET is described below.
Water vapour test
1. Take the initial weight of the bottle, without coating.
2. Coat the bottle of PET by dipping it until the neck and let it dry at RT until it’s touch dry.
3. Put the bottle in the oven at 40°C and let it dry there for about 40 min.
4. Follow up the drying by measuring the change in weight on an analytical balance. 5. When the bottle is dried, which means the weight is constant, apply a new thin layer,
and follow this method until the number of layers wanted is reached. 6. Fill the bottle with 150 g of water and close it tightly.
7. Measure the total weight of the bottle. 8. Put the bottle in a ventilated oven at 40°C.
9. Measure the water loss 2 days after the bottle is placed in the oven. 10. Keep measuring the water loss each week for about 3 weeks.
3.2 Results and Discussion
3.2.1 Adhesion Test
Being the adhesion to PET, the substrate, one of the most important parameters in the selection of a certain coating, several adhesion tests were performed in some of the coatings used, namely the PVDC ones and the VAC.
Table 2 – Results obtained for several coatings on the adhesion test.
2 days 4 days 1 week 2 weeks
VAC + PVDC 1 100% 100% 100% 100% PVDC 1 100% 100% 100% 100% VAC + PVDC 2 100% 100% 84% 100% PVDC 2 52% 44% 44% 40% VAC + PVDC 3 92% 88% 92% 40% PVDC 3 0% 0% 0% 0% VAC 100% 100% 100% 92% PU - primer 0% 0% 0% 0%
On the table above it can be seen that for the PVDC 1 adding VAC as a primer or not does not make a difference, because the adhesion on PET is very good, however its barrier properties are not so good.
Regarding the PVDC 2, the adhesion is much more improved with the VAC as a primer, as it is in the case of the PVDC 3, however the latter does not have good barrier properties.
The reason why PVDC 1 has a better adhesion by itself than the other PVDC’s is probably due to the fact that this coating has a higher viscosity than the others, which facilitates retention on the PET surface during dipping. Both PVDC 2 and PVDC 3 have lower viscosities, therefore the flow of these materials is higher and they need a primer to improve retention at the surface. Another possibility for this difference could be the fact that, being the PVDC’s copolymers, they can have different chemical structures or molecular weights, therefore in this case PVDC 1 probably has structure that more prone to interaction with PET.
The primer used by the company is the VAC, but in order to test its efficiency another primer was tested. This PU - primer was sent to the company and it was stated to improve the barrier properties of the PVDC’s, however its adhesion on PET was inexistent, which proves that, so far, the VAC is the best material to use as a primer on PET.
Adhesion tests were not performed on the bio-coatings because it is known from previous tests that these coatings do not have a good adhesion on PET. They always require the presence of a primer, in this case the VAC.
3.2.2 Gas Barrier Test
All of the gas barrier tests made were passive barrier tests, therefore the variation of oxygen and carbon dioxide, when put into a chart, should result in a line with a certain slope. Based on the slope obtained for each line it was possible to calculate the improvement that each coating has on this barrier property, when comparing them to the corresponding reference bottle. This calculation is only possible if the slope of the reference is higher than the slope of the coating, otherwise the coating is worse than the reference, which is an uncoated bottle.
All of the bottles containing bio-coatings (pectines, pullullan and chitosan), PVOH or EVOH were flushed empty. For this method of flushing, the unit used to measure the increase of oxygen was percentage of air saturated, %as. This unit measures the percentage of oxygen dissolved in the air present in the empty bottle, and its maximum value is 21%.
In figure 21 the oxygen variation can be seen of a pectine, PEC4, EVOH and a reference bottle, which were previously coated by another student, however the bottles had not been tested yet. These two-coated bottles have a first layer of VAC, followed by 5 layers of the respective coating, followed by a final layer of VAC.
Figure 21 – Oxygen barrier test results for PEC 4 and EVOH coatings, performed in empty bottles.
In table 3 the slopes computed for of each coating are shown.
Table 3 – Calculated slopes for the PEC 4 and EVOH coatings analyzed in the oxygen barrier test.
Slope (%as/day)
Reference 0,043
EVOH 0,0266
PEC 4 0,0092
In the table above, and analyzing figure 21, it can be deducted that the pectine coating leads to a 4,5 times lower rate of oxygen concentration increase than the reference bottle. With EVOH the rate is about 1,5 times lower than the reference.
0 0,2 0,4 0,6 0,8 1 1,2 1,4 1,6 1,8 2 2,2 2,4 2,6 2,8 3 0 5 10 15 20 25 30 35 40 45 50 55 60 65 O xy ge n in cr ea se ( % a s) Time (days) Reference PEC 4 EVOH
In order to see the effect of the multilayer in bio-coatings and PVOH’s, bottles were coated with 3 and 5 layers of coating, always having the first and final layer of VAC. The best results are presented below, however other coatings were used, not giving such good results, and the corresponding results are presented in the Appendix 1 section.
In figure 22 the results are presented for a pectine coating, PEC 2, for both bottles with 3 and 5 layers of this coating. Also these bottles have a first and a last layer of VAC applied to them.
Figure 22 – Oxygen barrier test results for a pectine, PEC 2, performed in empty bottles.
In table 4 the slopes computed for each coating are shown.
0 0,5 1 1,5 2 2,5 3 3,5 4 0 10 20 30 40 50 60 O xy ge n in cr ea se ( % as) Time (days) Reference PEC 2 3x PEC 2 5x
Table 4 – Calculated slopes for the PEC 2 coatings analyzed in the oxygen barrier test.
In figure 22 and in the table above it is possible to see that this pectine shows a considerable improvement of the oxygen barrier properties when compared to the reference bottle. In fact, it can be deducted that the pectine coating in the bottle with three layers leads to a 3,5 times lower rate of oxygen concentration increase when compared to the reference bottle; and with the bottle with 5 layers, the rate is about 7 times lower than the reference.
This shows that the number of layers of coating applied on the bottle has an influence on the final result, that means that the bottles with 5 layers of coating tend to show better results, probably due to the bigger amount, or a better adhesion of the coating, than the bottles coated with only 3 layers.
However it is important to consider that 5 layers of coating is the maximum that can be applied due to the high viscosity of some pectines and PVOH’s, and in the case of PSC, showed below in figure 23, an extremely viscous coating, only 3 layers were applied because it was impossible to coat the fourth layer on the bottle, as it would not dry.
In figure 23 the results are presented for a PSC and a PVOH coating. In the case of the PSC the bottle was coated with 3 layers of PSC, a first and a last layer of VAC. The bottles with the PVOH coating, PVOH 4, were coated with 3 and 5 layers of coating, also with a first and a last layer of VAC.
Slope (%as/day)
Reference 0,0614
PEC2 3x 0,0182
Figure 23 – Oxygen barrier test results for PSC and PVOH 4 coatings, performed in empty bottles.
In table 5 the slopes computed for each coating are shown.
Table 5 – Calculated slopes for the PSC and PVOH 4 coatings analyzed in the oxygen barrier test.
In figure 23 and in the table above it is possible to deduct that the coating PVOH 4, in the bottle with three layers, leads to a 2,5 times lower rate of oxygen concentration increase when compared to the reference bottle; and with the bottle with 5 layers, the rate is about 4
Slope (%as/day) Reference 0,0649 PSC 0,0407 PVOH 4 3x 0,0245 PVOH 4 5x 0,0156 0,000 0,500 1,000 1,500 2,000 2,500 0,00 5,00 10,00 15,00 20,00 25,00 30,00 35,00 O xy ge n in cr ea se ( %as ) Time (days) Reference PSC PVOH 4 3x PVOH 4 5x
times lower than the reference. It is once again shown that the bottles coated with more layers present best results. As for the PSC coating, its bottle leads to 1,5 times lower rate of oxygen concentration increase when compared to the reference bottle.
Filled bottles of various types of PVDC coating were also tested. For these bottles the increase of oxygen was measured in parts per million, ppm. Regarding the calculations, they were made based on the slope, just like it was made for the empty bottles, as explained above. Again the best results are presented below, and the remaining PVDC coatings that were tested but didn’t provide as good results can be found in the Appendix 1 section.
In figure 24 the results for the oxygen barrier are presented for the PVDC 2 coating. There were two types of bottles: bottles coated with only one layer of PVDC 2; and bottles coated with one layer of VAC followed by a layer of PVDC 2.
Figure 24 – Oxygen barrier test results for PVDC coatings, performed in filled bottles.
In table 6 the slopes computed for each coating are shown.
0 0,2 0,4 0,6 0,8 1 1,2 1,4 1,6 0 10 20 30 40 50 60 70 O xy ge n in cr ea se ( p p m ) Time (days) PVDC 2 VAC + PVDC 2 Reference
Table 6 – Calculated slopes for the PVDC 2 based coatings analyzed in the oxygen barrier test.
Slope (ppm/day)
Reference 0,0769
PVDC 2 0,0319
VAC + PVDC 2 0,0357
Analyzing the table above and figure 24, it can be seen that the oxygen rate of the bottle coated with VAC and PVDC 2 is about 2 times lower than the reference bottle. As for the bottle coated with only PVDC 2, the rate is about 2,5 times lower than the reference.
Although the results for the bottle coated with only PVDC 2 are slightly better in the oxygen barrier, the adhesion of this coating on PET is much more improved with the addition of VAC, as seen in the previous section.
To see if the drying method made a difference, some bottles were dried for 2 days at 40ºC, and the results were compared with the ones that were dried at room temperature and then at 40ºC for about 40 minutes. The results are presented in figure 25.
Figure 25 – Oxygen barrier test results for PVDC coatings, performed in empty bottles, in different drying
conditions.
As can be seen in the figure above the difference between the bottles dried for 2 days in the oven at 40ºC and the bottles dried at room temperature and then in the oven for 40 minutes is very small, therefore all the bottles were dried according to the method described in section 3.1.2.
After the tests on the bottles were made, some preforms were also coated the same way, being then blown into bottles and tested for oxygen and moisture barrier. Since the bottles average weight was 27g, and the blown bottles average weight was 25g, the data of the reference bottle used is different in both cases.
In figure 26 are presented the results for the coated preforms. There is a line that corresponds to the current solution used by the company, current, in order to see the difference in the performance of the coatings.
0 0,1 0,2 0,3 0,4 0,5 0,6 0,7 0 5 10 15 20 25 30 O xy ge n in cr ea se ( p p m ) Time (days) PVDC 2 VAC + PVDC 2 Reference PVDC2 2 days VAC + PVCD 2 2 days
Figure 26 – Oxygen barrier test results for PVDC coatings, performed in filled blown preforms.
In table 7 the slopes computed for each coating are shown.
Table 7 – Calculated slopes for the coatings analyzed in the oxygen barrier test and the current solution used by
the company. Slope (ppm/day) Reference 0,0707 VAC + PVDC 2 0,0192 current 0,00830 PVDC 2 0,0203
On the table above, as well as in figure 26, it can be observed that the performance of the preform coated exclusively with PVDC 2 has a similar performance with the preform coated with VAC and PVDC 2, being the rate about 3,5 times lower than the reference.
0 0,5 1 1,5 2 2,5 0 10 20 30 40 50 O xy ge n in cr ea se ( p p m ) Time (days) PVDC 2 Reference current VAC + PVDC 2
The current solution used by the company has an oxygen rate that it’s 8,5 times lower than the reference bottle, however this solution contains a layer of polyamide in the formulation, which increases the costs, mainly those associated with the recycling of this material, which has proven to be difficult, hence the willing to find new coatings with similar or better properties.
As for the carbon dioxide barrier test, the PVDC2 and VAC+PVDC2 coatings were evaluated. In figure 27 the results for this test are presented, in g/L, as well as the temperature variation, in ºC.
Figure 27 – Carbon dioxide barrier test results for the PVDC 2 and VAC+PVDC 2 coatings.
As it can be seen in the figure above, the temperature variation throughout the measurements caused some deviations on the measurement of the concentration of carbon
22,5 23 23,5 24 24,5 25 25,5 -‐0,50 0,00 0,50 1,00 1,50 2,00 0 10 20 30 40 50 60 70 80 T (°C) Ca rb on D io xi d e va ri at io n ( g/ L) Time (days) PVDC 2 VAC+PVDC 2 Reference T (ºC)
and therefore a larger amount of this gas is detected. This happened mainly because the bottles were not stored in a temperature-controlled room.
The VAC+PVDC 2 coating did not show any improvement, when compared to the blank bottle. That fact was due to the destruction of coating, due to the pressure of carbon dioxide put into the bottle. This pressure caused the coating to form small bubbles, that later burst, leaving many parts of the bottle uncoated, fact that suggests a poor adhesion of this coating, despite the adhesion test results, that don’t take pressure into consideration.
The PVDC 2 coating showed a smaller variation of carbon dioxide after 70 days, 0,61 g/L, which corresponds to a loss of approximately 9% of this gas. As for the reference, the loss of carbon dioxide was about 19%, with a variation of 1,45 g/L after 70 days.
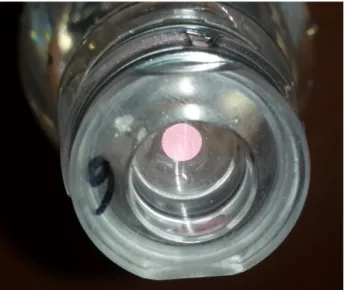
As for the gas barrier results on the lower pressure valves (PV’s), they had to be sent to a special facility to be tested. The results showed that the coating applied did not work, as it did not improve the gas barrier of these parts. Also the spraying system proved inefficient to coat the lower PV’s due to problems with the system itself and due to the viscosity of the coating, therefore until a new coating or a new spraying system is found the application of coating in these parts was left on stand by.
3.2.3 Water Vapour Test
The water vapour, or moisture barrier test results are presented in ppm. This calculation is explained in the Appendix 2 section.
Again, it is known that the bio-coatings, PVOH’s and EVOH’s have a poor moisture resistance, due to the hydroxyl groups present on this polymers, as it is mentioned in section 2, and also due to previous tests made with these coatings. The exception on the bio-coating field is talc, being the only one that had shown some good results in the past.
The main results of the water vapour test are shown in figure 28 and other results obtained with other coatings, namely PVB, are presented in the Appendix 2 section.
A line correspondent to a polypropylene bottle, PP, was added, in figure 28, as a mean of comparison with the coatings tested, because this material is known for its excellent moisture barrier properties.
Figure 28 – Water vapour barrier test results for the coatings tested.
On the following table, table 8, the slopes computed for each coating are shown. For this case in particular the slope was obtained using only the last three points of each graph, therefore the trend lines are not represented.
0,00 20,00 40,00 60,00 80,00 100,00 120,00 140,00 160,00 180,00 200,00 0 5 10 15 20 25 Co n ce n tr at io n d ec re ase ( p p m ) Time (days) PVDC 2 VAC + PVDC 2 VAC + PVDC 1 PVDC 1 Reference talc PVDC3 VAC + PVDC 3 PP
Table 8 – Calculated slopes for the coatings analyzed in the water vapour test. Slope (ppm/day) Reference 6,12 Talc 4,28 PVDC 1 4,82 VAC + PVDC 1 5,16 PVDC 2 3,18 VAC + PVDC 2 2,34 PP 0,38 PVDC3 2,86 VAC + PVDC 3 2,50
Analyzing figure 28 and the table above it can be seen that the coating that shows the most improvement is the VAC with PVDC 2, being about 3 times better than the reference. The PVDC 2 coating alone is only 2 times better than the reference. This can be explained by the fact that the VAC layer, acting as a primer, allows a bigger amount of PVDC 2 coating to remain on the bottle, thus improving the moisture barrier properties. In addition, PVDC 2 by itself does not have a very good adhesion on PET, so the probability of existing holes in the coated surface is very high.
Also there is almost no difference between bottles coated with only PVDC 3 and VAC and PVDC 3, being about 2 times better than the reference.
Regarding talc, this coating is about 1,5 times better than the reference.


![Table 1 – Values of OTR and WVTR for some selected polymers. [10]](https://thumb-eu.123doks.com/thumbv2/123dok_br/15703339.1067631/29.892.114.838.176.671/table-values-otr-wvtr-selected-polymers.webp)