Dos Algarves: A Multidisciplinary e-Journal, 32 – 2018.
ISBN 2182-5580 © ESGHT - University of the Algarve, Portugal.
To cite this article: Pacheco, L. (2018). An analysis of online reviews of upscale Iberian restaurants. Dos Algarves: A Multidisciplinary e-Journal, 32, 38-53. doi: 10.18089/DAMeJ.2018.32.3
An analysis of online reviews of upscale Iberian restaurants
Análise das opiniões online acerca dos restaurants Ibéricos de luxo
Luís Pacheco
Universidade Portucalense, Infante D. Henrique, Porto, Portugal [email protected]
Abstract
Electronic word-of-mouth (eWOM) has gained importance with the emergence of new online tools and the hospitality sector is at the core of this phenomenon. In this study, we use a data set of client reviews for Michelin starred restaurants located in Portugal and Spain to analyze the reviews in terms of overall satisfaction and four specific attributes. By employing statistical tests and regression analysis we find that the “food” and “service” attributes show a greater correlation with overall satisfaction than other criteria, and those attributes are common across restaurant segments and countries. These results have implications for the restaurant industry, highlighting the most important determinants of overall satisfaction. Some areas would benefit from small improvements and investments, which could make a difference in terms of rating and might bring a competitive advantage.
Keywords: Restaurants; electronic word-of-mouth; online review platforms; Michelin Guide.
Resumo
O boca-em-boca eletrónico (eWOM) ganhou importância com o surgimento de novas ferramentas online e o setor hoteleiro encontra-se no centro desse fenómeno. O presente artigo utiliza um conjunto de dados secundários de avaliações de clientes de restaurantes com estrelas Michelin localizados em Portugal e em Espanha. São analisadas as avaliações em termos de satisfação geral e quatro atributos específicos. Utilizando testes estatísticos e análise de regressão, evidencia-se que os atributos "comida" e "serviço" mostram uma maior correlação com a satisfação geral do que outros critérios, sendo esses atributos comuns em diferentes segmentos de restaurantes e países. Estes resultados têm implicações para o setor de restauração, pois destacam os determinantes mais importantes da satisfação geral. Algumas áreas são identificadas onde pequenas melhorias e investimentos podem fazer diferença em termos de classificação e trazer uma vantagem competitiva.
Palavras-chave: Restaurantes; boca-em-boca eletrónico; plataformas de avaliação online; guia
Michelin.
1. Introduction
Online reviews, ratings or opinions, as part of the electronic word-of-mouth (eWOM) phenomenon, have gained increased importance with the emergence of new technology and tools. Hennig-Thurau, Gwinner, Walsh and Gremler (2004: 39) defined eWOM as “any positive or negative statement made by potential, actual, or former customers about a product or company, which is made available to a multitude of people and institutes via the Internet”. Later, Litvin, Goldsmith and Pan (2008: 461) defined eWOM as “all informal communications directed at consumers through Internet-based technology related to the usage or characteristics of particular goods and services, or their sellers”. As stated by Cantallops and Salvi (2014), the main differences between WOM and eWOM can be identified in the reach of
[39]
the reviews’ impact (number of people who can be influenced) and the speed of interaction (Litvin et al., 2008; Cox, Burgess, Sellito & Buultjens, 2009).
Online product reviews are now available for many types of products, including restaurants. Following on the phenomenon observed in hotels, restaurants also begun to adopt diverse tools such as social media websites, customer-generated content or online reviews in order to assist in decision making and marketing (Leung, Law, Van Hoof & Buhalis, 2013; Mhlanga & Tichaawa, 2017). Online restaurant review websites connect potential diners with many other diners, democratizing access and helping clients to narrow their choices and find an adequate place corresponding to their preferences (Zhang, Ye, Law & Li, 2010). Reviewing content on social media also helps them to understand customers’ satisfaction and dissatisfaction (Jeong & Jeon, 2008; Li, Ye & Law, 2013; Berezina, Bilgihan, Cobanoglu & Okumus, 2016).
Given the variety of choices, with diverse food types, service quality and prices, a new sort of books, the “restaurant guide”, appeared in the early 20th century. With its first edition
in 1900, the Michelin Guide presents nowadays two quantitative assessments: a rating from one to three stars, representing the quality of the food, and a five-point (“fork and spoon”) rating representing the level of comfort and reception (Mellet, Beauvisage, Beuscart & Trespeuch, 2014). The Michelin Guide established an elitist paradigm, contributing to a dualistic structure of the restaurant industry: on the one hand, the upscale gastronomic segment, on the other hand, an extensive group of restaurants not eligible for evaluation. This paper is focused on the first group of restaurants, awarded with Michelin stars, where due to price reasons access is limited to a restricted pool of consumers.
The objective of this paper is to study the impact of specific satisfaction attributes on overall satisfaction. Namely, the relationship between overall satisfaction and four attributes: food, service, value (cost-benefit) and atmosphere. The assumption is that guest ratings on different specific attributes largely determine their overall satisfaction. The paper also aims to test the presence of some specific differences between the attributes’ relevance in terms of restaurant segment or country. With that purpose, clients’ average rating of 202 Michelin starred restaurants located in Portugal and Spain are analyzed. The data was obtained from one of the largest online travel platforms (TripAdvisor: www.tripadvisor.com). The study focuses on the quantitative ratings of each attribute, disregarding the guest’s subjective judgments in written comments (Jeong & Jeon, 2008; Limberger, Anjos, Meira & Anjos, 2014; Balagué, Martin-Fuentes & Goméz, 2016; Pacheco, 2016; Pacheco, 2017).
In the last years Portugal and Spain experienced a remarkable growth and international visibility regarding their gastronomy, a fact also reflected in an increased presence in the Michelin Guide. The analysis and comparison of reviews for a large sample of restaurants is completely new in the Portuguese and Spanish context and we expect that our results highlight some differences between countries and type of restaurants, providing insights for managers’ efforts in terms of customer satisfaction. Results of this paper could be useful to restaurant managers in resource allocation by identifying which factors have greater impact on clients’ overall satisfaction. The next section presents the literature review and the subsequent sections present the data and methodology and the results. The fifth section is a discussion of the results and the paper ends with concluding remarks.
[40]
2. Literature review
2.1. eWOM in the tourism and hospitality industry
Web 2.0 technologies have changed the ways users search and share information, offering new ways of communication that enable users to share their opinions with others in an efficient, instantaneous platform and no time or geographical limitations. From the perspective of cost-effectiveness, the use of social media tools is one of the best means of enhancing service quality and facility improvements since it avoids the additional marketing costs of traditional methods used to obtain and understand customer assessment.
The influence of eWOM is directly applicable to tourism and hospitality, since user-generated reviews are an important source of information for individuals searching for independent evaluations. Indeed, its influence is particularly high for intangible or “experience” goods such as in the hospitality and tourism context, because quality is only perceived after consumption (Ye, Law & Gu, 2009; Jeong & Jang, 2011). Unlike tangible products such as books or electronic gadgets, in which the product does not change until the new version of the model becomes available for sale, a restaurant meal is a product in which there could be variations in service quality and delivery from hour to hour. Hence, consumers have a greater need for fresh and current reviews (Ong, 2012).
People tend to trust information more when it comes directly from other consumers, supposedly helping them to avoid inadequate choices (Stringam, Gerdes & Vanleeuwen, 2010; Ye, Law, Gu & Chen, 2011). Research by Lu and Stepchenkova (2012) indicates that almost all respondents read online comments while planning their trips and they believe these online comments are more likely to contain updated, detailed and trustworthy information (Gretzel & Yoo, 2008; Vermeulen & Seegers, 2009; Xiang & Gretzel, 2010). However, due to the increasing use of social media, online review platforms and other user-generated content, there is the danger of consumers feeling flooded with information, in an eWOM overload (Park & Lee, 2008). Regarding the fear that user-generated contents can be jeopardized by fake comments made under the cover of anonymity, O’Connor (2010) argues that such fear is baseless since research has found little evidence of fake reviews, only residual cases. Also, a high number of reviews are a sign of credibility, since it diminishes the manipulative impact of any fake reviews (Ong, 2012; Balagué et al., 2016). For this reason, many online intermediaries – including TripAdvisor – require reviewers to register and provide some additional personal information including name, residence, nationality or gender (Jeong & Jeon, 2008; Xie, Miao, Kuo & Lee, 2011). The motives for users to post reviews have been researched by several authors (Zheng, Youn & Kincaid, 2009; Huang, Basu & Hsu, 2010; Wilson, Murphy & Fierro, 2012). For instance, Zheng et al. (2009) suggest that negative experiences are more likely to motivate dissatisfied consumers to post reviews. Some research argues that there is an inverted-U relationship between customer satisfaction and quantity of WOM or eWOM, with customers who are neither extremely satisfied nor unsatisfied sharing their experiences less (Bansal & Voyer, 2000; Litvin et al., 2008). Cantallops and Salvi (2014) present a complete survey, reviewing papers on eWOM published in the period 2007-2011 and end their paper with some suggestions for future avenues of research on the subject. These authors conclude that previous research could be grouped into two general lines of work: factors related to the generation of comments and the impact those comments have on consumers and on company perspectives.
[41]
2.2. Analysis of online reviews in the hospitality industry
A large group of papers, albeit mainly focused on hotels, used TripAdvisor or other sites as a source of data, collecting the data either manually or automatically (e.g., Gerdes & Stringam, 2008; Jeong & Jeon, 2008; Ye et al., 2009; Melián-González, Bulchand-Gidumal & López-Valcárcel, 2013; Limberger et al., 2014, Balagué et al., 2016; Pacheco, 2017, among others). For instance, Ye et al. (2009) empirically investigated the impact of online consumer-generated reviews on hotel room sales, by tallying the number of reviews received on a travel website which they consider to be a proxy of room sales. Their results indicated a significant relationship between online consumer reviews and business performance of hotels, with an increase of the variance in ratings given by customers diminishing hotel room ratings.
Pacheco (2017) analyzed hotel reviews in terms of overall satisfaction and for six specific attributes, finding that “rooms”, “service” and “cost-benefit” attributes show a greater correlation with overall satisfaction than other criteria, and those attributes are common across hotel segments and regions. The “location” and “cleanliness” attributes only appear as significant for some regions and hotel segments. For instance, the significance of “cleanliness” in lower segment hotels should merit the attention of hotel managers to allocate more resources to this. In relation to “rooms”, personal preferences and expectations may make it difficult to optimally up-grade rooms in order to satisfy a diverse clientele, whereas in regard to “service” hotel managers across all hotel segments should prioritize staff training and service-quality assessment tools in order to guarantee consistent levels of service. Considering both the content of reviews and the volume of eWOM in a broad sample of 16,680 hotels, Melián-González et al. (2013) found a relationship between valence (positive vs. negative posts) and volume, in the sense that initial hotel reviews tend to be disproportionately negative. As hotels receive more reviews, their average ratings improve and the standard deviation declines, which means there is a greater agreement in ratings and the negative effects are mitigated. One implication of their study is that managers should try to increase the number of reviews they receive to balance the positive and negative opinions about their property. Later we will return to this issue.
Finally, a recent paper by Jiang, Gretzel and Law (2014) analyzed reviews posted on TripAdvisor by English-speaking travelers about hotels in Mainland China. The authors compared brand image across hotel types and star rating levels, finding that brand image varied based on specific hotel characteristics, emphasizing different areas of service. For instance, the authors found that a certain star level does not necessarily mean a predetermined type of review, a feature that highlights the importance of distinguishing ratings between star levels.
2.3. The specific case of the restaurant industry
An “experience good” is a product or service in which product characteristics such as quality are difficult to observe prior to its consumption, being a restaurant meal a typical example of this kind of product. In this context, eWOM can play an important role providing the necessary information to potential clients (Zhang et al., 2010; Jeong & Jang, 2011). Litvin, Blose and Laird (2004) suggest that restaurants’ choices made by clients are predominantly influenced by the recommendations of friends or relatives, with few decisions being
[42]
influenced by more formal means. In the specific case of Michelin starred restaurants, customers expect higher standards of foodservice, in which a meal transforms itself on a kind of unique “experience”. As a result, the level of customers’ prior restaurant experiences and expectations can substantially affect both customer satisfaction and dissatisfaction in different restaurant classes (in terms of the number of stars). Thus, it seems plausible to expect that prospective clients will search and read more attentively reviews for these restaurants than they would read for other kind of restaurants, like budget or daily restaurants. So, online reviews assume here an increased importance and visibility (Ong, 2012). Also, Michelin restaurants are more associated with “fine-dining” than regular restaurants. Since “fine-dining” represents a more hedonic rather than utilitarian consumption, thus, possibly, readers/consumers would tend to gravitate more towards positive than negative reviews (Sen & Lerman, 2007).
The literature offers yet an insufficient number of studies trying to understand restaurant customers’ satisfactory and unsatisfactory experiences by direct analysis of online reviews (Pantelidis, 2010; Zhang et al., 2010; Jeong & Jang, 2011). Nevertheless, research has revealed four commonly accepted categories for measuring restaurant experience: food quality, service quality, atmosphere and price fairness (e.g., Namkung & Jang, 2007; Ryu & Jang, 2008; Liu & Jang, 2009). Notice that, besides “overall satisfaction”, these four specific attributes are the ones available in TripAdvisor reviews.
In the restaurant context, Pantelidis (2010) examines the salient factors determining customers’ experience in restaurants listed on a comprehensive online guide. The author argues that positive and negative comments should be regarded as equally important because a positive evaluation can help attract customers, while negative comments can harm the business. Zhang et al. (2010) evidence that favorable consumer reviews and a large volume of reviews are more likely to attract the interest of online consumers. Specifically, the attributes “taste of food” and “service” are identified as being of great importance in attracting online consumers. Jeong and Jang (2011) examine which restaurant experiences trigger customers to engage in positive eWOM. Their results suggest that, on the one hand, food quality and superior service and atmosphere triggered positive reviews, since clients are motivated to help the restaurant and future clients but, on the other hand, price fairness did not trigger reviews.
2.4. Questions to be addressed in this paper
Most of the previous studies are only based on a few restaurants and a few hundred respondents obtained through questionnaires whereas our study uses secondary data obtained from a large set of reviews for all the Michelin star-rated restaurants in Portugal and Spain.
There is a growing competition among similar products to draw the attention of web surfers and restaurants are not an exception. For instance, TripAdvisor presents reviews for 8769 restaurants in the Madrid area alone, and 3539 in Lisbon. Given the huge number of alternatives available online and the tendency of consumers to have low degrees of patience, the key question that motivates our study is exactly to find in which way consumers’ reviews of Michelin starred restaurants differ and correlate with specific attributes of the restaurants.
[43]
The restaurant industry needs to persistently monitor customer-reported online reviews in order to calibrate customers’ positive and negative experiences so that they can learn and improve aspects that have received negative comments and provide an adequate response (O’Connor, 2010; Levy, Duan & Boo, 2013). Xie, Zhang, Zhang, Singh and Lee (2016) find that hotel management responses leads to an increase in TripAdvisor ratings since it is highly effective in manipulating review behavior of subsequent clients. For this reason, we test whether restaurants that systematically respond to clients’ reviews present different results.
So, in this paper the following questions are addressed:
i) Is the number and dispersion of consumers’ reviews related to the number of stars/overall rate?
ii) Are there significant differences in reviews posted for different restaurant segments or countries?
iii) What attributes of a restaurant (e.g., consumer reviews of its food, service, value and atmosphere) posted on opinion websites are the most important for overall satisfaction?
iv) Does manager response have an impact on reviews?
3. Data and methodology
The data used in this study were retrieved manually from TripAdvisor, one of the most popular travel websites. TripAdvisor has a mechanism that enables users to input reviews by posting classifications from 1 (very unsatisfied/terrible) to 5 (very satisfied/excellent). The rating is a reliable assessment outcome for this study because customers can evaluate their restaurant experience and write comments on one of the five-point scores. These scores represent eWOM in a straightforward manner since clients evaluate restaurants in terms of overall satisfaction and four specific attributes: food, service, value and atmosphere.
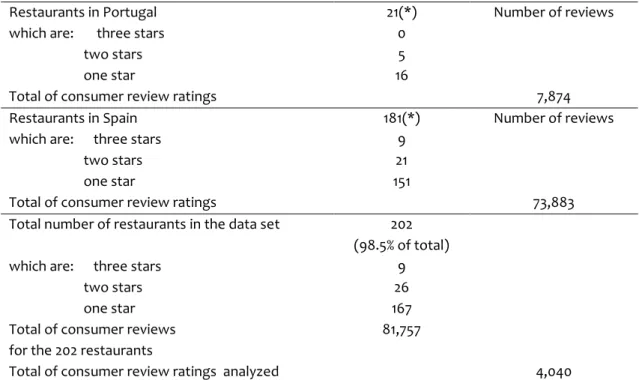
Table 1 presents the number and distribution of Michelin starred restaurants in the Iberian Peninsula (Portugal and Spain, including islands), together with the number of reviews for those restaurants available in TripAdvisor. Due to the frequency with which the TripAdvisor site is updated, the time frame for collecting the data was set from January 24 to 26, 2017. The complete list of starred restaurants was obtained from the Michelin website and subsequently the sample was chosen based on the following criteria: i) the restaurant must have at least 25 reviews; and ii) all the analyzed reviews must be less than three months old. After applying these criteria, we obtained a sample of 202 restaurants, distributed by different number of stars and comprising a total of 81 757 review ratings. We limited the number of analyzed reviews to 20 per restaurant due to data availability, thus we analyzed a total of 4040 reviews. Previous studies suggest that customers rarely read online comments beyond the first or second page, giving therefore preference to recent reviews (Pavlou & Dimoka, 2006; Sparks & Browning, 2011).
In the most recent Michelin Guide 29 restaurants entered the list or benefited from a star upgrade, with 15 restaurants in Spain and 5 in Portugal gaining their first star. Yet it is noteworthy that these restaurants normally present a lower average number of reviews (250) when compared to the global sample (433). Also, only 16 restaurants (less than 8%) systematically respond to clients’ reviews, with a small number of restaurants preferring to
[44]
respond only occasionally, particularly to extremely negative reviews. It is important to notice that, clients cannot edit or change their reviews after submission.
Table 1. Data set
Restaurants in Portugal 21(*) Number of reviews
which are: three stars 0
two stars 5 one star 16
Total of consumer review ratings 7,874
Restaurants in Spain 181(*) Number of reviews
which are: three stars 9
two stars 21 one star 151
Total of consumer review ratings 73,883
Total number of restaurants in the data set 202 (98.5% of total)
which are: three stars 9
two stars 26 one star 167 Total of consumer reviews
for the 202 restaurants
81,757
Total of consumer review ratings analyzed 4,040
Note: (*) Restaurants ranked from three to one star based on Michelin Guide 2017. Data retrieved in January 24 to 26, 2017. Three Spanish one-starred restaurants were excluded because did not fulfil the data selection criteria.
This paper analyzes the overall satisfaction as well the four specific ratings (food, service, value and atmosphere). Regression analysis is used to understand key predicting attributes of clients’ overall satisfaction. Prior to the regressions, some descriptive statistics are computed (means, standard deviations and correlations), and the presence of differences in mean ratings across countries and restaurant segments is also analysed.
We also test the Melián-González et al. (2013) hypothesis that average ratings depend positively on the number of customers who submit reviews. A confirmation of that hypothesis would highlight the importance for restaurants to promote greater participation of customers in online review platforms.
4. Results
Our research focuses on four points: i) whether the average rating that restaurants receive depends positively on the number of reviews (and its variance); ii) whether there are differences in reviews posted for the two countries; iii) whether those differences are related to the restaurant number of stars; and iv) whether different attributes have different impacts on overall satisfaction. It is also tested the presence of differences derived from the fact of the restaurant being new in the Michelin Guide, had suffered a star upgrade and usually respond to reviews. Table 2 presents the means and standard deviations of the different reviews, both in global terms and in terms of restaurant ranking.
[45]
Table 2. Means and standard deviations
Overall
satisfaction Food Service Value Atmosphere
Overall satisfaction (considering the 20
most recent reviews) Mean (Standard dev.)
Total 4.44 (0.24) 4.53 (0.25) 4.45 (0.28) 4.05 (0.33) 4.33 (0.29) 4.41 (0.85) 3 stars 4.61 (0.22) 4.72 (0.26) 4.61 (0.22) 4.22 (0.26) 4.44 (0.17) 4.32 (0.51) 2 stars 4.44 (0.22) 4.55 (0.26) 4.50 (0.28) 4.00 (0.24) 4.44 (0.16) 4.52 (0.81) 1 star 4.43 (0.24) 4.51 (0.25) 4.44 (0.28) 4.04 (0.34) 4.31 (0.30) 4.43 (0.88) Portugal 4.50 (0.16) 4.55 (0.22) 4.55 (0.31) 4.02 (0.29) 4.45 (0.27) 4.58 (0.72) Spain 4.43 (0.24) 4.53 (0.26) 4.44 (0.27) 4.05 (0.33) 4.31 (0.28) 4.44 (0.87)
Note: n = 202 (total) and according to Table 1.
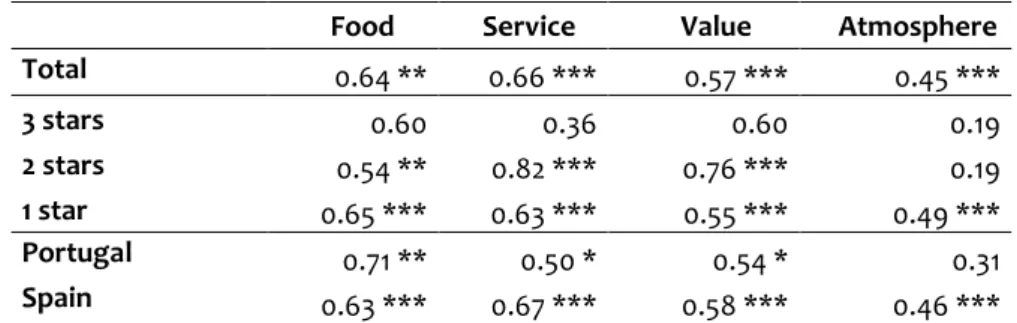
Table 3 presents the Spearman’s rank correlation coefficients between general satisfaction and the different attributes for different restaurant segments and countries.
Table 3. Correlations between overall satisfaction and attributes
Food Service Value Atmosphere
Total 0.64 ** 0.66 *** 0.57 *** 0.45 *** 3 stars 0.60 0.36 0.60 0.19 2 stars 0.54 ** 0.82 *** 0.76 *** 0.19 1 star 0.65 *** 0.63 *** 0.55 *** 0.49 *** Portugal 0.71 ** 0.50 * 0.54 * 0.31 Spain 0.63 *** 0.67 *** 0.58 *** 0.46 ***
Note: n = 202 (total) and according to Table 1. * p<0.05; ** p<0.01 and *** p<0.001.
To test the first question we performed a simple OLS regression for the 202 restaurants, assuming a linear relation between the restaurant overall score (overall satisfaction) and the number of reviews and its variance:
Yi = constant + β1 X1i + β2 X2i + εi (1)
where: Yi – dependent variable (overall score for the i-th restaurant)
β – coefficients to estimate
Xi – independent variables for the i-th restaurant
(X1: number of reviews; X2: variance of review ratings)
εi – error term.
Table 4 presents the results obtained for the regression. Besides the above regression (Panel A), we included two dummy variables: one for testing if there are differences when
[46]
the restaurant is new and the other if there are any differences for restaurants that usually respond to reviews (Panel B).
Table 4. Regression results (number and variance of reviews)
Panel A Panel B
Coefficient Sig Coefficient Sig
Constant 4.851 *** 4.830 *** Number of reviews 0.000010 0.000021 Variance of reviews -0.491 *** -0.481 *** New 0.043 Respond 0.023 R2 0.54 0.55 R2 adjusted 0.54 0.54 F 67.41 *** 34.99 ***
Note: Dependent variable = overall score.
Robust standard errors (HC1). * p<0.05; ** p<0.01 and *** p<0.001.
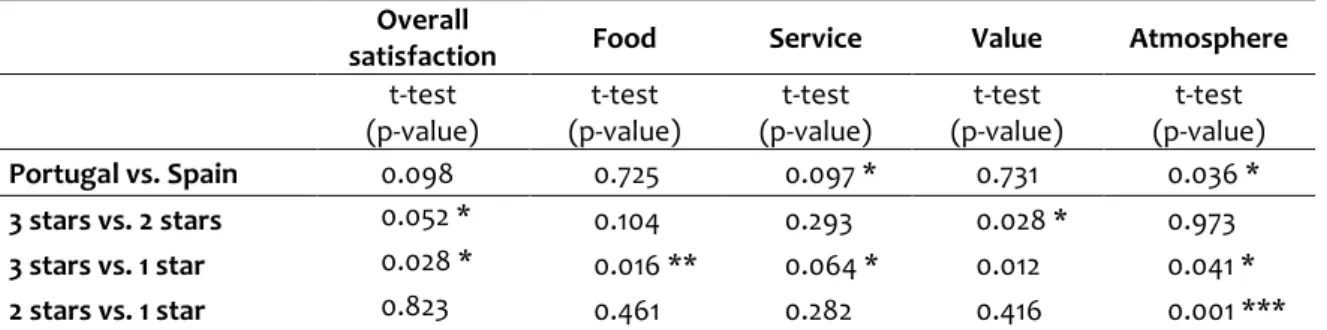
To test the following two questions we ran t-tests in order to determine whether there are significant differences in means for the different attributes across countries (Portugal vs. Spain) and for different restaurant segments. Since the t-test needs to consider an assumption regarding the equality of variances or not, before this test we tested whether the different pairs presented equal variances in order to perform the appropriate test for differences in means. Since after computing the Doornik-Hansen test we found that except for “value” all the data series followed a normal distribution, we decided to apply a parametric test. Table 5 presents these results.
Table 5. T-Test for differences in review rating between countries and restaurant segments
Overall
satisfaction Food Service Value Atmosphere
t-test (p-value) t-test (p-value) t-test (p-value) t-test (p-value) t-test (p-value) Portugal vs. Spain 0.098 0.725 0.097 * 0.731 0.036 * 3 stars vs. 2 stars 0.052 * 0.104 0.293 0.028 * 0.973 3 stars vs. 1 star 0.028 * 0.016 ** 0.064 * 0.012 0.041 * 2 stars vs. 1 star 0.823 0.461 0.282 0.416 0.001 *** Note: * p<0.05; ** p<0.01 and *** p<0.001.
Finally, in order to find the most important attributes for overall satisfaction, and for differentiating across countries and restaurant segments, an OLS regression was performed (with some exceptions due to small samples). To perform this, we assumed a linear relation between the dependent variable and a set of explanatory variables:
Yi = β0 + β1 X1i + β2 X 2i + β3 X3i + β4 X4i + εi (2) (i = 1, …, n)
Yi – dependent variable (overall satisfaction for the i-th restaurant) β – coefficients to estimate
Xi – independent variables for the i-th restaurant (food, service, value and atmosphere) εi – error term
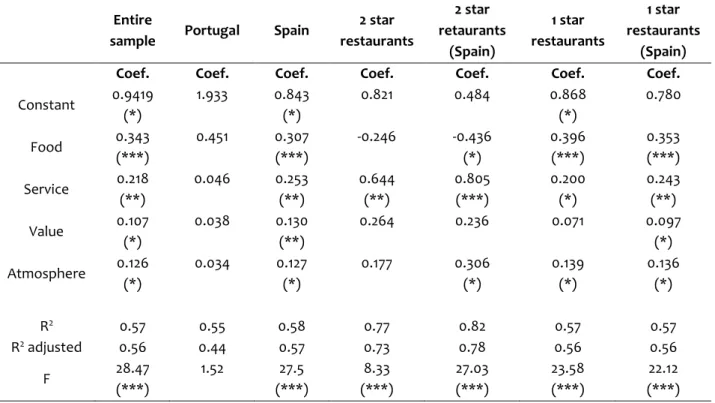
[47] Table 6 presents the results.
Table 6. Regression results (impact of different attributes on overall satisfaction)
Entire
sample Portugal Spain
2 star restaurants 2 star retaurants (Spain) 1 star restaurants 1 star restaurants (Spain)
Coef. Coef. Coef. Coef. Coef. Coef. Coef.
Constant 0.9419 (*) 1.933 0.843 (*) 0.821 0.484 0.868 (*) 0.780 Food 0.343 (***) 0.451 0.307 (***) -0.246 -0.436 (*) 0.396 (***) 0.353 (***) Service 0.218 (**) 0.046 0.253 (**) 0.644 (**) 0.805 (***) 0.200 (*) 0.243 (**) Value 0.107 (*) 0.038 0.130 (**) 0.264 0.236 0.071 0.097 (*) Atmosphere 0.126 (*) 0.034 0.127 (*) 0.177 0.306 (*) 0.139 (*) 0.136 (*) R2 0.57 0.55 0.58 0.77 0.82 0.57 0.57 R2 adjusted 0.56 0.44 0.57 0.73 0.78 0.56 0.56 F 28.47 (***) 1.52 27.5 (***) 8.33 (***) 27.03 (***) 23.58 (***) 22.12 (***)
Note: Robust standard errors (HC1). VIFs consistent with the absence of multicollinearity. * p<0.05; ** p<0.01 and *** p<0.001.
As discussed below, the results show overall satisfaction consistent with the four explanatory variables, in particular the attributes “food” and “service”.
5. Discussion
As Table 2 demonstrates, mean values tend to decrease with lower restaurant rankings as expected, indicating that the popularity index coincides with the restaurant star segment. However, if we only consider the 20 most recent reviews, the scenario is different, mostly due to the presence of some outlier reviews that are clearly different from the average. Although not presented in Table 2, mean values decrease with star segment in the two countries, excep for “service” and “atmosphere” in Portuguese restaurants. Also, restaurants located in Spain tend to present lower ratings in terms of all attributes with the exception of “value”. Globally, all the ratings increase from lower to superior restaurant segments and this suggests, as expected, that three-star restaurant guests enjoy higher satisfaction levels, with satisfaction decreasing in lower segment restaurants (one and two stars). Interestingly, this decreasing rate is higher in Spain. Additionally, and confirming the results from other authors (e.g., Schuckert, Liu & Law, 2015; Pacheco, 2017), Table 2 shows that, in general, a smaller number of stars leads to a greater dispersion in ratings. Although not presented, that behavior is present particularly in Portugal and for the attribute “value”. In terms of correlations between overall satisfaction and the different attributes, Table 3 evidences that most of them are significant and are all positive, presenting values around the
[48]
0.2-0.8 range. The attributes “food” and “service” tend to present higher correlations whereas “atmosphere” is generally less correlated with “overall satisfaction”. Lack of significant correlations for three-star restaurants may be a result of the small sample size.
The results from the regression (Table 4) do not confirm the hypothesis of Melián-González et al. (2013), showing that an increase in the number of reviews has not a significant impact on the average rating (e.g., the non-significant coefficient would imply that 100 more reviews increases the average rating by 0.001-0.002). More interestingly, as the variance of review ratings decreases, the average rating tends to be higher, reflecting the higher variance observed in less starred restaurants. This result implies that if a restaurant gets a lot of mixed reviews its average rating is substantially lower. So, in order to counteract that effect, restaurant managers need to encourage loyal customers to write reviews and should, at least, respond to strongly negative reviews. Panel B of Table 4 includes two dummy variables to test, first, whether restaurants that entered the Michelin list or benefited from an upgrade in 2016 and, secondly, if restaurants where the management usually responds to reviews, tend to present any differences. With only one exception for new restaurants, these dummy variables do not seem significant.
Testing for differences in total review ratings (Table 5) answers the first research question evidencing that there are no significant differences in means, except for “overall satisfaction” and the attribute “atmosphere”, with some noticeable differences between Portuguese and Spanish guests’ reviews. The differences in the attribute “atmosphere” are expected since the number of stars is surely correlated with luxurious and selective facilities. Additionally, the country differences in some attributes could be explained by cultural and taste differences. The fact that “service” has a lower mean value in Spain, which is significantly different from Portugal, calls for an increased attention to that attribute by Spanish restaurant managers. As expected, there are significant differences between restaurant segments, both in terms of overall satisfaction and in terms of all four specific attributes. As ratings are clearly different between restaurant segments it is evident that higher star-rated restaurants had more favorable guest perceptions than their lower counterparts.
As evident in Table 6, the great majority of explanatory variables are significant and the R2 is always between 55 and 82%, which means that a large part of overall satisfaction variance
is explained by the considered set of attributes, thus answering the second research question and also confirming the results for hotel samples from Limberger et al. (2014), Stringam et al. (2010) and Pacheco (2017). It is noteworthy that the results do not appear to present multicollinearity problems, since the different Variance Inflation Factors (VIF) are always in the 1.2-5.3 range, with an average value of 2.2 (Gujarati, 2003). If we observe the entire sample, all attributes are significant, albeit with higher coefficients for “food” and “service”, thus confirming Zhang et al. (2010) results. For instance, a one-point upgrade in the “food” rating has an impact of 0.34 in the global rating. The attributes “atmosphere” and “value” present lower coefficients, which confirm the results from Iglesias and Guillen (2004). Price fairness was not identified as a key motivator for overall satisfaction possibly because Michelin-starred restaurants are positioned on a higher level in terms of client segmentation and affluence. For the two-star restaurants there is only one significant attribute – “service”. This attribute seems to be of greater relevance since it is also significant for the other samples. For instance, for two-star restaurants a one-point upgrade in the “service” rating
[49]
has an impact of 0.64 in overall satisfaction, meaning that these restaurants must maintain their high standards in terms of service in order to preserve their positioning advantage. Interestingly, “service” seems to be more relevant for higher segment restaurants, whereas the inverse happens for “value”. One-star restaurant clients seem to give more importance to “value-for-money”, in comparison to upper-scale restaurant clients, which is possibly explained by the higher proportion of “one-time” clients in such restaurants. Although the review content was not analyzed in this paper, when collecting the data it was evident that “value” is a recurrent issue, with some extremely negative opinions regarding the evaluation of price unfairness. As stated by Jeong and Jang (2011), a customer’s perception of price fairness is influenced by the quality of the food, service and atmosphere, and vice-versa.
The smaller sub-samples associated with Portuguese restaurants and Spanish three-star restaurants (samples with less than 20 restaurants) did not allow identification of significant attributes across some restaurant segments. Finally, and once again none of the dummy variables for “new” restaurants or restaurants that respond to reviews, were deemed significant.
These results have implications for hospitality management, since they highlight the most important determinants of overall satisfaction ratings. The “food” and “service” attributes show a greater correlation with overall satisfaction than other criteria, corroborating the results from previous literature. Thus, the “service” attribute contributes to restaurant differentiation and rating. Also the “food” attribute is almost always present, showing that it is independent of the number of stars, which is not surprising since we have a sample of Michelin starred restaurants, where “food” is the main element considered when awarding a star.
6. Conclusion
This study contributes to the hospitality literature by identifying the most significant attributes determining overall satisfaction for a large sample of restaurants, distributed in three quality segments and two countries. We selected only Portuguese and Spanish restaurants awarded with Michelin stars and with a sufficient number of reviews, therefore the results present some limitations in terms of generalization for other countries. This study attempts to identify how consistent clients’ perceptions of restaurant performance are consistently related with restaurant segment and country through their reviews on TripAdvisor.
This paper is of an exploratory nature, presenting some limitations that should be surpassed in future research, namely: (i) since this study evaluates secondary data from TripAdvisor, issues related to the integrity of clients’ reviews and the lack of control in data collection could compromise its conclusions. Some reviews are possibly biased – written by the restaurant itself, by competitors or simply by a “virtual” client. Future research should identify the impact of biased comments; (ii) this study is quantitative – it only considers the general classifications posted by different users without analyzing the words used in each post (semantic content analysis), which could provide additional relevant information. In their written posts clients may show significant differences in satisfaction concerning the attributes, since each review normally has descriptions that are likely to include valuable information that can give further explanations for a particular rating. An in-depth analysis
[50]
would also provide information on why some restaurants have more reviews than others; (iii) the different importance of attributes may depend on the type of clients, their gender, age, cultural background and other variables. For instance, business and leisure clients may show differences in ratings since their expectations regarding food presentation, value-for-money or service are probably different. The same applies for clients of different ages, so it is important to study this issue in greater depth and characterize the review writers; (iv) this paper only analyzes Portuguese and Spanish restaurants awarded with Michelin stars, so the results do not represent the total starred restaurants (or restaurants pertaining to other segments of the industry) and generalization of the study findings is not warranted; (v) finally, only reviews from TripAdvisor were used. It would be of great interest to conduct a comparative study among different restaurant review sites in order to cross-validate restaurant performance from clients’ perspectives. This issue is especially relevant since different nationalities are likely to use different services, as it is usually the case with nearly every service on the internet.
In terms of practical implications, this study contributes to improve restaurant management, identifying which evaluation criteria used by clients are more strongly correlated with (and explain) overall satisfaction. It confirms the results from previous literature applied to hotels, showing that the high correlation between attributes and overall satisfaction supports previous research in service quality management, which argues that the perceptions of parts of the service delivery are closely related to overall perception. Thus, restaurant managers should not ignore any of the attributes. These findings provide restaurant managers with an understanding of guests’ perceptions of restaurant performance by restaurant segment and country and in relation to TripAdvisor’s popularity index, showing which performance attributes contribute most to guest satisfaction. Small improvements and investments could make a difference in some areas in terms of rating and in bringing a competitive advantage. On the one hand, the greatest gains to overall satisfaction seem to be explained by the “food” and “service” attributes. As such, personal preferences and expectations may make it difficult to optimally up-grade food served in order to satisfy a diverse clientele. As for “service”, restaurant managers across all restaurant segments should prioritize staff training, service-quality assessment tools and incentive programs for employees in order to guarantee consistent levels of service. Low segment restaurants are more likely to have differences in customer satisfaction, whereas an upgrade from a one to a three-star restaurant seems to yield a boost in ratings.
Our results suggest that restaurant managers should use reviews to learn about their clients’ experiences and reactions, as well as for providing the necessary feedback, in particular to the more dissatisfied. In sum, restaurant managers should regularly visit review sites such as TripAdvisor to glean industry-wide trends from clients’ own voices. In fact, reviews from clients or user-generated feedback can help restaurant managers to improve service quality from the wealth of data provided, which will impact on higher ratings and visibility and, potentially, higher revenues.
[51]
References
Balagué, C, Martin-Fuentes, E. & Goméz, M. (2016). Fiabilidad de las críticas hoteleras autenticadas y no autenticadas: El caso de TripAdvisor y Booking.com. Cuadernos de Turismo, 38, 63-82. doi: 10.6018/turismo.38.271351
Bansal, H. & Voyer, P. (2000). Word-of-mouth processes within services purchase decision context.
Journal of Service Research, 3(2), 166-177. doi: 10.1177/109467050032005
Berezina, K., Bilgihan, A., Cobanoglu, C. & Okumus, F. (2016). Understanding satisfied and dissatisfied hotel customers: Text mining of online hotel reviews. Journal of Hospitality Marketing &
Management, 25(1), 1-24. doi: 10.1080/19368623.2015.983631
Cantallops, A. & Salvi, F. (2014). New consumer behavior: A review of research on eWOM and hotels.
International Journal of Hospitality Management, 36, 41-51. doi: 10.1016/j.ijhm.2013.08.007
Cox, C., Burgess, S., Sellito, C. & Buultjens, J. (2009). The role of user-generated content in tourist’ travel planning behavior. Journal of Hospitality Marketing and Management, 18(8), 743-764. doi: 10.1080/19368620903235753
Gerdes, J. & Stringam, B. (2008). Addressing researchers’ quest for hospitality data: Mechanism for collecting data from web resources. Tourism Analysis, 13(3), 309-315. doi: 10.3727/108354208786094906
Gretzel, U. & Yoo, K.-H. (2008). Use and impact of online travel reviews. In P. O’Connor, W. Hopken & U. Gretzel (eds.). Information and Communication Technologies in Tourism 2008 (pp. 35-46). Vienna, Austria: Springer Verlag.
Gujarati, D. (2003). Basic econometrics (4th ed.). Boston: McGraw-Hill.
Hennig-Thurau, T., Gwinner, K.P., Walsh, G. & Gremler, D. (2004). Electronic word-of-mouth via consumer-opinion platforms: What motivates consumers to articulate themselves on the internet? Journal of Interactive Marketing, 18(1), 38-52. doi: 10.1002/dir.10073.
Huang, Y., Basu, C. & Hsu, M. (2010). Exploring motivations of travel knowledge sharing on social network sites: An empirical investigation of U.S. college students. Journal of Hospitality
Marketing & Management, 19(7), 717-734. doi: 10.1080/19368623.2010.508002
Iglesias, M. & Guillen, M. (2004). Perceived quality and price: Their impact on the satisfaction of restaurant customers. International Journal of Contemporary Hospitality Management, 16(6), 373-379. doi: 10.1108/09596110410550824
Jeong, E. & Jang, S. (2011). Restaurant experiences triggering positive electronic word-of-mouth (eWOM) motivations. International Journal of Hospitality Management, 30, 356-366. doi: 10.1016/j.ijhm.2010.08.005
Jeong, M. & Jeon, M. (2008). Customer reviews of hotel experiences through consumer generated media (CGM). Journal of Hospitality & Leisure Marketing, 17(1-2), 121-138. doi: 10.1080/10507050801978265
Jiang, J., Gretzel, U. & Law, R. (2014). Influence of star rating and ownership structure on brand image of mainland China hotels. Journal of China Tourism Research, 10(1), 69-94. doi: 10.1080/19388160.2013.870506
Leung, D., Law, R., Van Hoof, H. & Buhalis, D. (2013). Social media in tourism and hospitality: A literature review. Journal of Travel & Tourism Marketing, 30(1-2), 3-22. doi: 10.1080/10548408.2013.750919 Levy, S., Duan, W. & Boo, S. (2013). An analysis of one-star online reviews and responses in the Washington, DC., lodging market. Cornell Hospitality Quarterly, 54(1), 49-63. doi: 10.1177/1938965512464513
Li, H., Ye, Q. & Law, R. (2013). Determinants of customer satisfaction in the hotel industry: An application of online review analysis. Asia Pacific Journal of Tourism Research, 18(7), 784-802. doi: 10.1080/10941665.2012.708351
Limberger, P., Anjos, F., Meira, J. & Anjos, S. (2014). Satisfaction in hospitality on TripAdvisor.com: An analysis of the correlation between evaluation criteria and overall satisfaction. Tourism &
Management Studies, 10(1), 59-65.
Litvin, S., Blose, J. & Laird, S. (2004). Tourists’ use of restaurant webpages: Is the internet a critical marketing tool. Journal of Vacation Marketing, 11(2), 155-161. doi: 10.1177/1356766705052572 Litvin, S., Goldsmith, R. & Pan, B. (2008). Electronic word-of-mouth in hospitality and tourism
[52]
Liu, Y. & Jang, S. (2009). Perceptions of Chinese restaurants in the US: What affects customer satisfaction and behavioral intentions? International Journal of Hospitality Management, 28(3), 338-348. doi: 10.1016/j.ijhm.2008.10.008
Lu, W. & Stepchenkova, S. (2012). Ecotourism experiences reported online: Classification of satisfaction attributes. Tourism Management, 33(3), 702-712. doi: 10.1016/j.tourman.2011.08.003
Melián-González, S., Bulchan-Gidumal, J. & López-Valcárcel, B. (2013). Online customer reviews of hotels: As participation increases, better evaluation is obtained. Cornell Hospitality Quarterly,
54(3), 274-283. doi: 10.1177/1938965513481498
Mellet, K., Beauvisage, T., Beuscart, J. S. & Trespeuch, M. (2014). A “democratization” of markets?
Online consumer reviews in the restaurant industry. Valuation Studies, 2(1), 5-41. doi: 10.3384/vs.2001-5992.14215
Mhlanga, O. & Tichaawa, T. (2017). Influence of social media on customer experiences in restaurants: A South African study. Tourism, 65(1), 45-60.
Namkung, Y. & Jang, S. (2007). Does food quality really matter in restaurants? Its impact on customer satisfaction and behavioral intentions. Journal of Hospitality & Tourism Research, 31(3), 387-409. doi: 10.1177/1096348007299924
O’Connor, P. (2010). Managing a hotel’s image on TripAdvisor. Journal of Hospitality Marketing &
Management, 19(7), 754-772. doi: 10.1080/19368623.2010.508007
Ong, B. S. (2012). The perceived influence of user reviews in the hospitality industry. Journal of
Hospitality Marketing & Management, 21, 463-485. doi: 10.1080/19368623.2012.626743
Pacheco, L. (2016). An analysis of online reviews by language groups: The case of hotels in Porto, Portugal. European Journal of Tourism Research, 14, 66-74.
Pacheco, L. (2017). Customer satisfaction in Portuguese hotels: Evidence for different regions and hotel segments. Tourism Analysis, 22(3), 337-347. doi: 10.3727/108354217X14955605216087 Pantelidis, I. (2010). Electronic meal experience: A content analysis of online restaurant
comments. Cornell Hospitality Quarterly, 51(4), 483-491. doi: 10.1177/1938965510378574 Park, D. & Lee, J. (2008). eWOM overload and its effect on consumer behavioral intention depending
on consumer involvement. Electronic Commerce Research and Applications, 7(4), 386-398. doi: 10.1016/j.elerap.2007.11.004
Pavlou, P. & Dimoka, A. (2006). The nature and role of feedback text comments in online marketplaces: Implications for trust building, price premiums, and seller differentiation. Information Systems
Research, 17(4), 392-414. doi: 10.1287/isre.1060.0106
Ryu, K. & Jang, S. (2008). DINESCAPE: A scale for customers' perception of dining environments. Journal of Foodservice Business Research, 11(1), 2-22. doi: 10.1080/15378020801926551
Schuckert, M., Liu, X. & Law, R. (2015). A segmentation of online reviews by language groups: How English and non-English speakers rate hotels differently. International Journal of Hospitality
Management, 48, 143-149. doi: 10.1016/j.ijhm.2014.12.007
Sen, S. & Lerman, D. (2007). Why are you telling me this? An examination into negative consumer reviews on the web. Journal of Interactive Marketing, 21(4), 76-94. doi: 10.1002/dir.20090 Sparks, B. & Browning, V. (2011). The impact of online reviews on hotel booking intentions and
perception of trust. Tourism Management, 32(6), 1310-1323. doi: 10.1016/j.tourman.2010.12.011 Stringam, B., Gerdes, J. & Vanleeuwen, D. (2010). Assessing the importance and relationships of ratings
on user-generated traveler reviews. Journal of Quality Assurance in Hospitality & Tourism, 11(2), 73-92. doi: 10.1080/1528008X.2010.482000
Vermeulen, I. & Seegers, D. (2009). Tried and tested: The impact of online hotel reviews on consumer consideration. Tourism Management, 30, 123-127. doi: 10.1016/j.tourman.2008.04.008
Wilson, A., Murphy, H. & Fierro, J. (2012). Hospitality and travel: The nature and implications of user-generated content. Cornell Hospitality Quarterly, 53(3), 220-228. doi: 10.1177/1938965512449317 Xiang, Z. & Gretzel, U. (2010). Role of social media in online travel information search. Tourism
Management, 31(2), 179-188. doi: 10.1016/j.tourman.2009.02.016
Xie, H., Miao, L., Kuo, P. J. & Lee, B. Y. (2011). Consumers’ responses to ambivalent online hotel reviews: The role of perceived source credibility and pre-decisional disposition. International Journal of
[53]
Xie, K., Zhang, Z., Zhang, Z., Singh, A. & Lee, S. (2016). Effects of managerial response on consumer eWOM and hotel performance: Evidence from TripAdvisor. International Journal of
Contemporary Hospitality Management, 28(9), 2013-2034. doi: 10.1108/IJCHM-06-2015-0290
Ye, Q., Law, R. & Gu, B. (2009). The impact of online user reviews on hotel room sales. International
Journal of Hospitality Management, 28(1), 180-182. doi: 10.1016/j.ijhm.2008.06.011
Ye, Q., Law, R., Gu, B. & Chen, W. (2011). The influence of user-generated content on traveler behavior: An empirical investigation on the effects of e-word-of-mouth to hotel online bookings.
Computers in Human Behavior, 27(2), 634-639. doi: 10.1016/j.chb.2010.04.014
Zhang, Z., Ye, Q., Law, R. & Li, Y. (2010). The impact of e-word-of-mouth on the online popularity of restaurants: A comparison of consumer reviews and editor reviews. International Journal of
Hospitality Management, 29(4), 694-700. doi: 10.1016/j.ijhm.2010.02.002
Zheng, T., Youn, H. & Kincaid, C. (2009). An analysis of customers’ e-complaints for luxury resort properties. Journal of Hospitality Marketing & Management, 18(7), 718-729. doi: 10.1080/19368620903170240
LUÍS PACHECO, doutorado em Economia, investigador no REMIT – Research on Economics,
Management and Information Technologies, Professor Associado do Departamento de Economia e Gestão da Universidade Portucalense. Endereço institucional: Departamento de Economia e Gestão da Universidade Portucalense - Infante D. Henrique, Rua Dr. António Bernardino de Almeida, 541, 4200-072 Porto, Portugal.
Submetido em 2 novembro 2017 Aceite em 7 março 2018