University of Évora
ARCHMAT
(ERASMUS MUNDUS MASTER IN ARCHaeological MATerials Science)
Mestrado em Arqueologia e Ambiente (Erasmus Mundus–ARCHMAT)
Phoenician-Punic amphorae from Castro Marim, Portugal:
provenance and contents of Pellicer amphora types B/C and D
Adam Gašpar, m40770
Prof. José Antonio Paulo Mirão (Supervisor - University of Évora)
Prof. Cristina Maria Barrocas Dias (Supervisor - University of Évora)
Prof. Ana Margarida Arruda
(Supervisor – University of Lisbon)
Panel of Jury
President: Prof. Nicola Schiavon, University of Évora;
Examiner: Dr. Elisa de Sousa, Uniarq – University of Lisbon;
Supervisor: Prof. José Antonio Paulo Mirão, University of Évora;
Resumo
Ânforas fenício-púnicas de Castro Marim, Portugal: origem e conteúdos dos tipos B/C e D de Pellicer
O sítio arqueológico de Castelo de Castro Marim fica na parte mais elevada da Vila com o mesmo nome na costa sul de Portugal, perto da fronteira com Espanha. O local está situado no topo de uma colina 30 metros acima do nível do mar erguido numa área pantanosa entre a costa sudeste do Algarve e a foz do rio Guadiana. Várias campanhas de escavações arqueológicas revelaram ocupação durante a Idade do Ferro, período romano e Idade Média. O objetivo do estudo é avaliar a presença de dois tipos específicos de ânforas pré-romanas no sítio de Castro Marim em termos de proveniência e conteúdo. A produção e distribuição de ânforas Pellicer tipo B/C e D podem ser datadas do 5° ao 1° séculos a.C e estão relacionadas com a ocupação fenício-púnica da baía de Cadis e do vale do Baixo Guadalquivir. A análise petrográfica do material cerâmico com base na abordagem multi-analítica (principalmente XRD, XRF, petrografia e SEM-EDS) será focada em identificar as diferentes proveniências de amostras selecionadas de ânforas. Em casos relevantes, os resíduos extraídos dos materiais cerâmicos são estudados recorrendo a GC-MS para identificar o bem armazenado nas ânforas. Este trabalho discute a origem das ânforas analisadas e contextualiza-as no meio de produção e comércio de alimentos.
Palavras-chave: Ânforas Pellicer B/C; Ânforas Pellicer D; proveniência das ânforas; ânforas conteúdo; comércio
Abstract
Phoenician-Punic amphorae from Castro Marim, Portugal: provenance and contents of Pellicer amphora types B/C and D
The castle of Castro Marim archaeological site is located at the highest point of the town with the same name on the southern margin of Portugal close to the border with Spain. The site is placed in the hilltop 30 meters above sea level, elevated along a swampy area between the south eastern coast of the Algarve and the mouth of the Guadiana river. Several archaeological campaigns revealed occupation during the Iron Age, Roman period and the Middle Ages. The objective of this research is to evaluate the presence of two specific types of Pre-Roman amphorae in Castro Marim site in terms of provenance and content. Production and distribution of Pellicer type B/C and D can be dated from the 5th to the 1st centuries B.C
and are related with Phoenician-Punic occupation of the Cadiz bay area and the Lower Guadalquivir valley. The Petrographic analyses of the ceramic material, based on a multianalytical approach (mainly XRD, XRF, petrography and SEM-EDS) is focused on identifying the different provenance of selected amphorae. In relevant cases, the residues extracted from the ceramic materials are studied by GS-MS, in order to identify possible past content of the amphorae. This thesis discusses the origin of the analysed amphorae, contextualizing them in their production, commerce and content.
Key words: Pellicer B/C amphorae; Pellicer D amphorae; amphorae provenance; amphorae contents; commerce
Acknowledgements
Firstly, I would like to express great gratitude to my supervisors, namely prof. Ana Margarida Arruda from The Uniarq – Centre for Archaeology at the University of Lisbon, who provided archaeological material (post-shards) and valuable information. She led several seasons of field works at the Castelo de Castro Marim, and has been systematically working on evaluating and publishing the results. Great appreciation to my supervisors from the Hercules laboratory – University of Évora, namely prof. Cristina Dias and prof. José Mirão. They were close to me during the entirety of the process, from laboratory work, analysis and thesis writing, to having always been ready to provide me with support, advice and further knowledge. Without my supervisors the master thesis could have come to fruition.
I would like also to thank the whole of Hercules laboratory, to each and every one of my colleagues. The working atmosphere in the laboratory was at all times propitious and fruitful. Especial thanks to my colleagues and friends Massimo Beltrame, Anna Tsoupra and Ana Manhita, who gave me greatly needed information and showed me skills associated with sample preparations, their analysis and interpretation. Here I would like to thank Jan Petřík, from the Department of Geological Sciences of Masaryk University in Brno. For his endless friend support and for providing information crucial in the making of this thesis. I would also like to devote my thanks to Elisa de Sousa from The Uniarq for her help, and drawings documentation of shards. I am again very thanks full to Anna Tsoupra for advices and corrections during the text writing. Great appreciation to Tiago Alexandre Carpelho Martins da Silva, he is from a good family. I would like to thank the ARCHMAT EMMC International Selection Committee for the amazing opportunity to study this master in archaeometry. This adventure and cultural nourishment forever changed my perspective and archaeological thinking. It did not come without grand support. Here, I would like to thank also our coordinator prof. Nick Schiavon, and all professionals and persons related with the program. Thank you, my dear classmates around world, for everything that I had the pleasure of learning with you.
Finally, I must thank my family, especially to my brother, father, grandfather, and closer friends for their constant moralsupport. The biggest, and final thanks I send to my mother
Outline
Scope
101. Introduction
111.1. Phoenician colonisation of the Western Mediterranean 11 1.2. The “Castelo de Castro Marim” – typical hilltop site in the delta 13 1.3. The Lower Guadalquivir valley, Pellicer B/C and D amphorae commerce 15
1.4. The geology of Castro Marim 19
1.5. The geology of Lower Guadalquivir valley 20
1.6. Archaeometry of ceramic materials – raw material, modelling and firing 21 1.7. Workshops of amphorae, amphorae distribution, use and discard 24
2. Analytical techniques
272.1. Petrography of thin sections 27
2.2. X-ray fluorescence (XRF) 28
2.3. X-ray diffraction (XRD) 29
2.4. Electron microscopy (SEM-EDS) 30
2.5. Organic content analysis (GC-MS) 32
3. Materials and methods
353.1. Petrography 37 3.2. ED-XRF 38 3.3. Powder XRD 39 3.4. SEM-EDS 39 3.5. GC-MS 40
4. Results
42 4.1. Petrography 42 4.2. XRD 47 4.3. ED-XRF 49 4.4. SEM-EDS 54 4.5. GC-MS 615. Discussion
635.1. Ceramic materials study 63
5.2. Content of vessels 70
Conclusion
74Literature
77List of figures
Fig. 1.1 – A: Phoenician merchant ship with various traded goods; B: The Phoenician-Punic sphere of influence
and main sites in the 6th century BC.
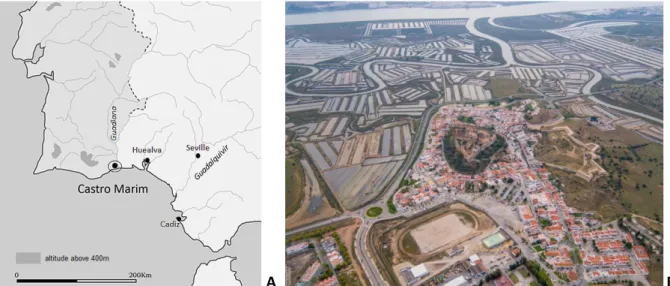
Fig. 1.2 – A: The Castro Marim in the Iberian Peninsula (after Arruda et al. 2014, Fig. 1); B: The Guadiana river,
the area of salt production and the archaeological site with the Medieval castle.
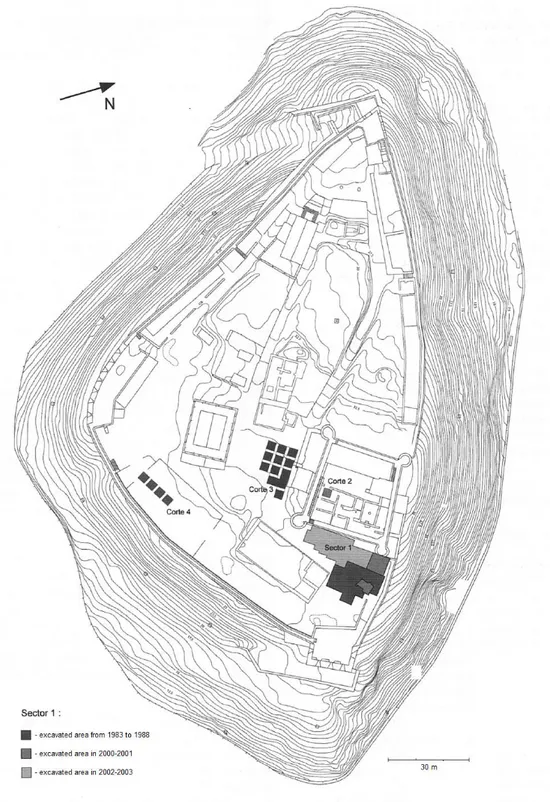
Fig. 1.3 – The topographic plan of the castle and excavated areas (after Arruda et al. 2006, Fig. 2).
Fig. 1.4 – Lower Guadalquivir and surroundings of the ancient Lacus Ligustinus – the marshy area of the
Guadalquivir delta with main surrounding Iron Age settlements (after Garcia-Fernandez 2015, Fig. 1).
Fig. 1.5 – A: Amphorae Pellicer B, C and D (after Pellicer Catalán 1978, Fig. 13); B: The selected bottoms of
Turdetani amphorae founded in Cerro Macareno, Sevilla (after Pellicer Catalán 1978, Fig. 12).
Fig. 1.6 – A: Amphorae Pellicer D and example the variability of rims (after Vargas 2016); B: Local amphorae of
the Turdetani region: I - Pellicer C (Cerro Macareno), II - Pellicer B (Cerro Macareno), III - Pellicer D (Las Cumbres); Amphorae with Punic-Gadiz origins: IV - T-12.1.1.1 and T-12.1.1.1/2 (Cádiz), V - T-8.2.1.1 (Sevilla), VI - T-9.1.1.1 (prototype from Cádiz), VII- T-8.1.1.2 (Cerro Naranja; after Garcia-Fernandez 2015, Fig. 2).
Fig. 1.7 – Cross sections of Pelicer B/C and D amphorae sorted to the material groups (after Megías 2017). Fig. 1.8 – Geological map of the lower Guadalquivir basin (map adapted from IGME's 1:50.000 geological maps,
after Salvany et al. 2011).
Fig. 1.9 – Sediment grain size and sorting; A: The grain size dimensions in millimetres (mm) from pebbles to silt
and clay; B: the degree of uniformity of grain size: sorting (Moura et al. 2017, Annex III - credits: S. Oliveira).
Fig. 1.10 – Support of the grate: A: Central pillar; B: Radial support; C: Axial support (after Cuomo di Caprio 2007). Fig. 1.11 – Technological choices, material properties and schema of ceramic life cycle (after Sillar, Tite 2000). Fig. 2.1 – Petrographic (polarized light) microscope configuration.
Fig. 2.2 – Principle of X ray fluorescence spectroscopy.
Fig. 2.3 – Reflection of an X-ray beam by the planes of a crystal with interplanar spacing (after Bannert 2017). Fig. 2.4 – Scanning electron microscope.
Fig. 2.5 – Schematic plot of the main components of standard GC–MS instruments (Emwas et al. 2015, Fig. 1). Fig. 3.1 – A: Pellicer B/C amphora with the smaller, pointed protrusion and concave wall (sample 4, 12356); B:
Pellicer B/C amphora with the smaller oval protrusion (sample 10, 12655), C: Pellicer B/C amphorae with the bigger and oval protrusion (sample 12, 3698), D:The bottom similar to Pellicer B/C amphora without significant protrusion (sample 15, 12658), E: The bottom similar to MPA4 amphora with probable Cadiz origin (sample 16, 11078), F: The concave bottom of local common ware (sample 19, 12047).
Fig. 4.1 – Stereo-images of cross sections: number of sample and petrographic group represented by letter;
more images and details about petrography is possible to see in the catalogue of samples (Annex I).
Fig. 4.2 – Thin section image with significant intrusion in selected sample. 10 – A: amphibole, 16 – A: fossil, 9 –
Fig. 4.3 – Selected diffractograms and main mineral phases (x - 2θ, y - Intensity (a.u.)) with the numbers of
samples and the letter of fabric group. Q – quartz, F – feldspar, Dio – diopside/pyroxene, Geh – gehlenite, M – mica/illite, A – amphibole, Hor – hornblende, Ca – calcite.
Fig. 4.4. – Box plots of main oxides and LOI with marked outliers as circles.
Fig. 4.5 – The ED-XRF data in the bi-axial graphs. A: CaO-Fe2O3, B: Na2O- CaO, C: Na2O-K2O (dot – Pellicer B/C,
cross – amphorae without protrusion, square – local common wares, X – Pellicer D).
Fig. 4.6 – The ED-XRF data in the bi-axial graphs. A: Al2O3-Zr, B: Rb-Sr, C: Rb-Zr (dot – Pellicer B/C, cross –
amphorae without protrusion, square – local common wares, X – Pellicer D).
Fig. 4.7 – Selected surface electron images (SE) with the numbers of samples and the letter of fabric group. Fig. 4.8 – SEM EDS: sample 1 – A; A: Backscattering image, B: elemental mapping, C: spectra of the mapping, D:
table with point EDS analysis in the atomic % (the number of points correspond with the numbers in mapping).
Fig. 4.9 – SEM EDS: sample 10 – A; A: Backscattering image, B: elemental mapping, C: spectra of the mapping, D: table with point EDS analysis in the atomic % (the number of points correspond with the numbers in mapping). Fig. 4.10 – SEM EDS: sample 6 – A4; A: Backscattering image, B: elemental mapping, C: spectra of the mapping, D: table with point EDS analysis in the atomic % (the number of points correspond with the numbers in mapping). Fig. 4.11 – SEM EDS: sample 16 – A2; A: Backscattering image, B: elemental mapping, C: spectra of the mapping, D: table with point EDS analysis in the atomic % (the number of points correspond with the numbers in mapping). Fig. 4.12 – SEM EDS: sample 24 – B; A: Backscattering image, B: elemental mapping, C: spectra of the mapping, D: table with point EDS analysis in the atomic % (the number of points correspond with the numbers in mapping). Fig. 4.13 – SEM EDS: sample 30 – C2; A: Backscattering image, B: elemental mapping, C: spectra of the mapping, D: table with point EDS analysis in the atomic % (the number of points correspond with the numbers in mapping). Fig. 4.14 – Detail of glassy vitrification; sample 21 – B. A: Backscattering image, B: Al mapping, C: Ca mapping, D:
Si mapping, E: Mg mapping, F: Fe mapping.
Fig. 4.15 – SEM-EDS data. Ternary diagram illustrating the composition of feldspars in selected samples (dots –
Pellicer B/C, triangles – amphorae without protrusion, squares – local common ware, diamonds – Pellicer D).
Fig. 5.1 - Bi-axial graph: MgO and CaO obtained by ED-XRF.
Fig. 5.2. – Calcareous rich clays – mineral forming during the firing (after Noll, Heimann 2016).
Fig. 5.3 – A: Simplified ternary phase diagram SiO2- Al2O3-(CaO+MgO) for calcareous-dolomitic clays (after Noll,
Heimann 2016), B: Top part of the simplified ternary diagram. Symbols reflect the main ceramic typology (dot – Pellicer B/C, cross – amphorae without protrusion, square – concave bottoms, X – Pellicer D).
Fig. 5.4 – Principal component analysis (PCA) of main oxides. The values of oxides were transformed into the
logarithmic scale (loading data: Annex III), the group of petrographic fabrics marked in circles (Table 2-5).
Fig. 5.5 – A: Chromatogram of GC-MS for sample 6 and B: sample 9, with compounds identified (FA- fatty
Scope
The amphorae were broadly used as containers for storage and export of various food product in the ancient time. There are various types of Phoenician-Punic amphorae related with the time scale and production centres (Garcia-Fernandez 2015, Fig. 2; Ramón Torres 1995). The main objective of this study is to evaluate the overall meaning of the presence of two specific types of pre-Roman amphorae, Pellicier B/C and D, in the archaeological site of the Castro Marim, Portugal. The production and distribution of these “Punic” amphorae are dated from the end of 6th to the 1st century BC, and it is associated with commercial food supply from the Lower
Guadalquivir valley or Cadiz area, in the Southwest Andalusia (Garcia-Fernandez 2019).
The shards of 14 bottoms of Pellicer B/C amphorae with protrusions (I), 2 bottoms of amphorae without significant protrusion (III), 4 concave bottoms identified as local common wares (III), and 10 rims of Pellicer D amphorae (IV) were selected with the aim to identify the provenance and the content of the vessels. A multianalytical protocol combining petrography of thin sections, chemical analysis of ceramic material in the form of fused beads, and determination of main mineralogical composition of the bulked powder by XRD was implemented. SEM-EDS analysis was applied on selected thin sections to obtain more details about the temper and microstructure. The primary goal of the study is the material characterisation of the composition of vessels, and to identify different fabric groups. The firing temperature and atmosphere, partially manufacturing process and used raw material are discussed. Based on the provenance results, the contents of selected bottoms were investigated by GC-MS. The research objective of content study is to determine the food products residues presented in the bottoms.
1. Introduction
1.1. Phoenician colonisation of the Western Mediterranean
The term Phoenicians derives from ancient Greek and it is a commonly accepted name for Semitic-speaking populations settled in city-states (e.g. Tyre, Sidon, Byblos) along the Eastern Levantine Mediterranean coast. The culturally developed population excelled at navigating. Phoenician traders and settlers began spreading to the southern coast of the Mediterranean in the early 1st millennium BC (Fig. 1.1: A). Cartage was established in the 9th century, as well
as other colonies, where Algeria and Morocco are located nowadays. Based on archaeological data, systematic Phoenician colonisation continued in the Balearic Islands, Iberian Peninsula and Western North Africa during the 9th and 8th century BC. The Phoenician settlers
established a network of trading posts aiming at commerce with indigenous populations and direct exploitation of local resources. The centres of trade attracted more and more natives, and soon grew into cities of their own. During the Orientalising period (9th/8th – 6th century
BC), in the Atlantic shoreline of Iberia, the most prominent centres of exchange were Cadiz and Huelva, due to metal trading (Dietler 2009).
Taking the 6th century as a starting point, the Carthage had been rising to the power and began
to incorporate former Phoenician cities in Sicily, Sardinia and Iberia. After the city of Tyro and the Levantine coast was conquered by the Babylonian empire in 573 BC, Carthage established itself as the dominant maritime power in the Mediterranean and created an autonomous “Punic” commercial sphere. Punic is the Latin equivalent for Phoenician, but the term Punic is more relevant for Carthaginians and Carthage´s sphere of influence in the Central and Western Mediterranean (Fig. 1.1: B; Dietler 2009). These circumstances in the 6th century, but
also environmental and societal factors leaded to the economic destabilization and changing of settlement patterns in mostly of the regions. In the Cadiz bay, the centres based on the mining and trading metals were affected, and the subsistence strategy had been changed to the local oriented economic based on agriculture. In the area of the Lower Guadalquivir valley, the long-distance trade related with the Tartessos ecumene collapsed (Aubet 1995). After a few decades of revitalisation and consolidation, commerce of different goods and food products started to flourish from the fertile region such as the Lower Guadalquivir valley again (Garcia-Fernandez 2015; Megías 2017).
A
B
Fig. 1.1 – A: Phoenician merchant ship with various traded goods1; B: The Phoenician-Punic sphere of influence
and main sites in the 6th century BC2.
1https://phoenicianresearch.weebly.com/uploads/1/7/3/5/17357749/8122590.jpg?875 (10.7.2019) 2https://phoenicia.org/imgs/phoeniciancolontradeposts.jpg (10.7.2019)
1.2. The “Castelo de Castro Marim” – typical hilltop site in the delta
The archaeological site is situated in the upper part of the small town, Castro Marim, in the south-east coast of the Algarve in Portugal. The town is placed in the delta of the Guadiana river which nowadays forms parts of the border with Spain (Fig. 1.2: A). The site with the medieval castle is situated at a hilltop (30-40 m a. s. l.) rising from a swampy area between the coast and the Guadiana river (Arruda 1996; 2000; Bargão, Arruda 2014). Nowadays the marshy area is modified artificially due to the industrial salt production. In the 16th century
the river was closer to the hilltop and the area was well protected (Arruda 1996). Hypothetically during the Iron Age, the hilltop might have been an island in the delta, and such might have been possible reaching the hilltop by ships either from the river or from the sea (Fig. 1.2: B; Arruda et al. 2006).
A B
Fig. 1.2 – A: The Castro Marim in the Iberian Peninsula (after Arruda et al. 2014, Fig. 1); B: The Guadiana river, the area of salt production and the archaeological site with the Medieval castle3.
The castle was occupied mainly during the Iron Age, Roman Age and Modern time, as the archaeological campaigns in the eighties and at the beginning of new millennium proved (Fig.
1.3). However, the evidence of first human activity at the site date to the Late Bronze Age
(Arruda 1996). The privileged location of the Castro Marim, crucial for the controlling of the
delta area, attracted the Phoenician colonists. Such, during the Orientalizing period (7th – 6th
century BC), the indigenous settlers of Castro Marim came to interact with Phoenicians, which were already installed in Southern Andalusia (Arruda et al. 2006).The Phoenicians made use of big rivers as trade routes with inland indigenous populations (Arruda 2009).
A lack of imports and a decrease in human activity on the hilltop is recorded at the end of the 6th and at the beginning of the 5th century as proved the radiocarbon dating. This phase did
not go beyond the second half of the 5th century BC, when the settlement at the hilltop
restructured (Arruda, Freitas 2008; Arruda et al. 2014). From the second half of 5th century
BC, Castro Marim started again to be fully integrated into trade network, including several distant settlements and sites associated with Phoenician-Punic tradition. In the Pre-Roman time, the Castro Marim population was exchanging various goods and especially food products with the Western Andalusian region (mainly the Lower Guadalquivir valley and Cadiz bay). In the same time the Castro Marim site was the centre of exchange in the Guadiana river region. After the Carthaginians were defeated by the Romans, the socio-economic sphere had been transforming, and the significant period of the hilltop occupancy is the second half of 1st
century BC, when the Roman trade based at the Italian production culminated (Arruda et al. 2006; Arruda, Freitas 2008; Arruda et al. 2014).
1.3. The Lower Guadalquivir valley, Pellicer B/C and D amphorae commerce
The presence of Pellicer B/C and Pellicer D amphora types in the Castro Marim site is related with their export from the Lower Guadalquivir river valley and the area of Cadiz in the second half of the first millennium BC (Fig. 1.4; Arruda et al. 2006;Vargas 2016). The boundaries of the Turdetani region were formed by The Guadalquivir river to the west, the Sierra Morena to the North, the foothills of the Baetic Cordillera to the East (Bastetania) and according to Strabo, it also comprised the coast from the Strait of Gibraltar to the mouth of the Guadiana river. The crisis of the Orientalising period during the 6th century BC causes the emergence of the Turdetani culture (from 5th to 2nd century BC) in the region. This culture was not a
homogenous ethnic group, but a melting pot containing mainly indigenous population affected by Phoenician-Punic influence. The production in this fertile region formed by the delta was supported by the distinctive eating habits. Due to the interaction of various communities in central sites, and vigorous trade, food consumption habits and cuisine were exchanged as well. On the list of favourite commodities was fish sauce, but a broad scale of other goods related with rural production were also traded (Garcia-Fernandez 2015).
Fig. 1.4 – Lower Guadalquivir and surroundings of the ancient Lacus Ligustinus – the marshy area of the
Guadalquivir delta with main surrounding Iron Age settlements (after Garcia-Fernandez 2015, Fig. 1).
A B
Fig. 1.5 – A: Amphorae Pellicer B, C and D (after Pellicer Catalán 1978, Fig. 13); B: The selected bottoms of Turdetani amphorae founded in Cerro Macareno, Sevilla (after Pellicer Catalán 1978, Fig. 12).
A B
Fig. 1.6 – A: Amphorae Pellicer D and example the variability of rims (after Vargas 2016); B: Local amphorae of the Turdetani region: I - Pellicer C (Cerro Macareno), II - Pellicer B (Cerro Macareno), III - Pellicer D (Las Cumbres); Amphorae with Punic-Gadiz origins: IV - T-12.1.1.1 and T-12.1.1.1/2 (Cádiz), V - T-8.2.1.1 (Sevilla), VI - T-9.1.1.1 (prototype from Cádiz), VII- T-8.1.1.2 (Cerro Naranja; after Garcia-Fernandez 2015, Fig. 2).
The amphorae of Phoenician-Punic tradition Pellicer B/C and D were used for the transport of various food products (Fernandes et al. 2017). The Pellicer B/C type is dated from the 6/5th
to 3rd century BC. The younger variant of similar shape Pellicer D occurred from the 4th to the
1st century BC. The overall features of these amphorae are the oval protrusion or pointed end
at the bottom of elongate body and concave throat with mouth about 10-12 cm wide. After the classification mainly based on sections of rims, various inner sub-types were described. The body shapes of amphorae vary from oval-saccate to cylindrical, especially in the case of Pellicer B/C, while Pellicer D amphorae have predominantly the cylindrical body with maximum weight about 100 cm (Fig. 1.5, 1.6). However, there are other defined types of amphorae with similar morphological features which could pose the problems in typological classification (Fig. 1.6; Arruda et al 2006; Garcia-Fernandez 2009; Megías 2017; Romero Sáez, Niveau de Villedary 2016; Vargas 2016).
Although the origin of Pellicer B/C amphorae has been agreed to be the Lower Guadalquivir valley, their contents are under debate (olives, olive oil, wine, fish sauce, etc.). The
provenance of younger, Pellicer D amphora, so called “Coastal type” is still not certain. The study based solely on the macroscopic observation of the ceramic paste, suggests two distinct geographical regions, the Lower Guadalquivir valley, or the area of Cadiz. The amphorae were being produced concurrently in more places in the Lower Guadalquivir. This demonstrates a different sub-classification based on the composition of ceramic (Fig. 1.7), and a few distinct sites with the kilns (Megías 2017). Primary commodities as well as secondary food products like wine, olive oil or fish sauce were transported and traded. The Pellicer amphorae B/C and D were probably used and re-used as common containers in a local scale trade too ( Garcia-Fernandez et al. 2017). Various food products and surplus were exported, and in this view, the Pellicer amphorae B/C and D are encountered in many sites of the Iberian Peninsula and North Africa. Punic Cadiz had in that time function as the commercial hub and distribution centre of these amphorae (Garcia-Fernandez 2019; Megías 2017; Sáez Romero, Niveau de Villedary 2016; Sáez Romero 2018; Vargas 2016).
1.4. The geology of Castro Marim
The Castro Marim site is situated in an area with a geological evolution that involves periods of marine transgression and regression, formation of mountains, erosion, volcanism and seismic activity. The oldest rocks in Castro Marim region are the slate and greywacke from Baixo Alentejo Flysh formation, created at about 320 million years ago, in the Carboniferous Period, due to the deposition at sea floor of terrigenous sediments coming from the erosion of an emerging continent. During Hercynian orogeny (from 290 to 260 million years ago) these strata were intensively folded. The foothill located north of Castro Marim is essentially made up of this geological formation (Oliveira et al. 1982).
During the Mesozoic period, in the Triassic, the intense erosion of the Hercynian reliefs originated the formation of sandstones, conglomerates and clay stones, of predominant red colour, commonly known as "Grés de Silves". Above this unit, a marl with evaporitic rocks geologic formation is identified.
Intense igneous activity affected the geology of Castro Marim region in the transition between the Triassic and the Jurassic periods. These basic volcanic and doleritic rocks are characterized by the presence of plagioclases and pyroxenes. The overlying dolomitic limestone related with the doleritic rocks is lower Jurassic dated (Oliveira et al. 1982; Romariz, Almeida, Oliveira 1979).
From the Lower Jurassic to the Miocene there are almost 200 million years, the geological history is unknown, since sediments from this time interval were not found. In the Upper Miocene (from 8 to 5 million years ago), in the deltas, were deposited sandy clays and silts, which form the main cliffs in the East Algarve (Moura et al. 2017).
Most of the landscape of the Castro Marim has origin in a recent geological period, the Quaternary, which began 2,5 million years ago. The alluvial formations of black clays have been deposited in the final section of the Guadiana for about 8000 years. They progression to the sea is blocked by large masses of sand. The alluvial plain, subject to flooding, was developed and furrowed by sinuous streams originating in the surrounding reliefs. The salty swampy area was developed during the last 5000 year. The sediment in the delta has 2 main sources: fluvial and marine. The top sediment in the riverbed is formed by mud, clay and silt
with sandy layers, while the riverbanks contain mainly substrate of carboniferous shale (Fletcher 2005; Morales 1997; Moura et al. 2017).
1.5. The geology of Lower Guadalquivir valley
Fig. 1.8 – Geological map of the lower Guadalquivir basin (map adapted from IGME's 1:50.000 geological maps
(after Salvany et al. 2011).
The depression of the Guadalquivir is a broad foreland basin between two orogenic units: the Iberian Massive (i.e. Sierra Morena) with the origin in Hercynian orogeny in the North, and much younger Betica Cordillera formed in Neogene in the South. The continental sedimentary basin was created in the Neogene and Quaternary (Villalobos, Pérez 2006). The southern half is formed by younger mesozoic materials from the Betica Cordillera, while the north-western
edge remained more stable, with compact sediments from the erosion of older Iberian massif. The geology here is more like in the area of Castro Marim site. In the Southeast edge of basin, the Paleogenic and Neogenic sediments are much diverse, because of a constant elevation of the Beatica mountains. In this area, the presence of volcanic and plutonic rocks is clear (Fig.
1.8; Montealegre, Barrios 1996; Fernandez et al. 1998).
From the stratigraphic point of view, the sedimentary fill of the basin can be divided into two large groups. The lower set, dated to the middle Miocene, includes the facies of "moronitas" or "albarizas", and white marls deposited in environments deep marine, rich in microfossils such as foraminifera, coccoliths, diatoms, radiolaries, silicoflagellates, spicules, etc.
The highest levels of the basin stretch were mainly formed during the Quarternary. The marls are the more abundant sediments and can be considered as calcareous clays with impregnations of iron oxides and sporadic more plastic intercalations.
1.6. Archaeometry of ceramic materials – raw material, modelling and firing
The routine archaeometric targets are the identification of ceramic groups and their origin, as well as aspects related to the manufacturing of ceramics. Production centres and workshops offer an ideal framework to recover ceramic manufacturing processes, with the necessary involvement for technical/technological choice, and fabric groups could function as localized references for provenance studies. On the contrary, consumption centres are ideal for discussing the interaction of artefacts with people. Archaeological classification is usually based on the morphological properties of ceramics, together with the compositional and structural properties determined or hypothesized by macroscopic and/or stereoscope observations. Portable analytical facilities and instruments may allow preliminary overview, which would improve the initial sampling frame for the archaeometric study. Archaeometric results allow us to infer the exact composition of post-excavated shards and creating a new classification of ceramics with similar morphological and macroscopic properties (Buxeda i Garrigós, Madrid Fernández 2017).
The objective of studying ancient ceramic material is to understand the ceramic life cycle in past societies: extracting, procuring, and processing of raw material; shaping and firing of the
vessel; use, exchange, trade; discarding of the ceramic (Heimann, Maggetti 2014; Tite 1999,
2008). To find a proper answer, material nature of ceramics must be also studied and evaluated from an archaeometric point of view, mainly on a chemical, mineralogical and petrographic level. The archaeometry of ceramics is an inverse problem and it must consider the weathering and post-depositional processes in the archaeological record. The archaeometric data can also be influenced by an archaeological post-excavational treatment (e. g. washing of shards, labelling with reference information, storage conditions, etc.). But, research questions are mainly related with states of ceramic in their life cycle – finished pottery, unfired pottery, the manufacture processes (preparation of material, shaping of vessels, etc.), raw ceramic materials and their provenance. To understand the complexity of these problems a multianalytical study is appropriate (Buxeda i Garrigós, Madrid Fernández 2017; Heimann, Maggetti 2014; Tite 1999, 2008).
The final properties of ceramic material are directly linked with the used raw materials and the process of manufacturing and firing (Quinn 2013; Noll, Heimann 2016). Information regarding ancient technology can be derived from the pottery itself, but also from the production places. In this view, it is important for the cryptanalysis of the ceramic elaboration, besides precise material studies, to collect historical, ethnographic or ethnoarchaeological information (Heimann, Maggetti 2014; Noll, Heimann 2016; Roux 2017).
First, the raw material with the required properties for ceramic production was extracted and transported to the site. As accessible fine clay sources are limited, there is a premise, that raw material has been extracted from the distinctive places for longer (Shephard 1985). The material in ceramic production should have had enough plasticity, and at the same time it couldn´t shrink too much during the drying and firing. To obtain the efficient properties of the material, the coarse particles were removed, and the clay was grinded. Then usually, some temper was added, either from an organic or inorganic material, such as plant remains, bones, shells or crushed rocks and sand. The identification of the temper is a particularly important factor in provenance studies. Different kind of temper affects differently the final quality of the pottery, thus the selection of the temper added is related to the ceramic tradition. The final step, in clay preparation, after of any kind of manipulation is its stay for few days in order to “mature” (Heimann, Maggetti 2014; Noll, Heimann 2016; Petřík 2017; Quinn 2013).
The sphericity and roundness of the temper grains depends on the distances of transportation in sedimentary environments. The rounder grains, the longer distances were transported. In this respect, the observation of these attributes could provide as information regarding the initial places of the raw materials and thus to associate to potential sources. For example, in a river, round temper grains indicate that their place of exploitation were on the downstream. However, in a case like the roundness of the grains could also be from various other processes, such as wind erosion or tidal regime (Fig. 1.9). The size of the temper grains depends on the sorting and/or sieving that underwent and its relative homogeneity (unimodal, bimodal) could be an attribute in ceramic studies (Grotzinger et al. 2006; Quinn 2013). Another characteristic of the temper is the orientation of the elongated grains, which can be linked to the use of pottery wheel. For instance, if the fast pottery wheel was used, the particles are oriented along the ceramic body (Quinn 2013).
Fig. 1.9 – Sediment grain size and sorting; A: The grain size dimensions in millimetres (mm) from pebbles to silt
During the firing of ceramic material, the minerals either from the clay and temper interact, transform, decompose or form new mineral-like phases. The final mineralogical composition of the ceramic from certain material depends on the temperature regime and the atmosphere in ceramic kiln (Noll, Heimann 2016; Quinn 2013; Riccardi, Messiga, Duminuco 1999). In the case of calcareous or dolomitic clays, so called marl, specific features appear in the pottery. Calcium and magnesium have function as a flux, and, if the clay contains enough iron or iron oxide, it allows to form hematite in relative low temperature. If the temperature reached 900°C, other minerals e.g. gehlenite and diopside could form (Nodari et al. 2007; Noll, Heimann 2016; Trindade et al. 2009). In the case of extremely rich calcite and dolomitic clays from the Algarve, if temperature goes over 900°C, the ceramics shows a vitrified microstructure and potassium–calcium sulphates are created (Trindade et al. 2009).
1.7. Workshops of amphorae, amphorae distribution, use and discard
Many archaeological sites are not yet found or have already been destroyed and will never be documented (Renfrew, Bahn 2012). Beside the lack of archaeological components from the Second Iron Age, in the Lower Guadalquivir region, four archaeological sites with ceramic workshops, as indicate by the kilns and other related structures were excavated. Based on these four sites, we might sum up that ceramic workshops of Turdetani-Punic culture within the region of the Lower Guadalquivir were located at strategic points, close to main distribution routes, urban centres and raw material sources. Three of them are in a district of Seville, here the high concentration of Turdetani-Punic sites does not only reflect the state of research, but also its importance as a settlement area in that time (Chic, García Vargas 2004;
Mégias 2017).
A B C
Fig. 1.11 – Technological choices, material properties and schema of ceramic life cycle (after Sillar, Tite 2000).
The potter's wheel and the vertical ceramic kiln are the technological innovations, introduced with the colonialism that took place during the First Iron Age, and spread fully in the Second Iron Age (García Fernández, García Vargas 2012). A feature that differentiates these kilns that were discovered in the southwest of the Iberian Peninsula from the Second Iron Age is the supporting grate (Fig. 1.10; Cuomo di Caprio 2007). In all cases the structure is circular, and the kiln is divided into two compartments by a grate made with clay. The above one is using to firing the ceramic, below it can be found the combustion chamber dug onto the ground bellow the structure (Chic García, García Vargas 2004). The opening for the combustion chamber is also used to control the temperature and firing atmosphere during the firing process. The heat was transferred to the firing chamber through the holes in the grade, without risking having the vessels exposed directly to fire. The upper chamber, which stood at ground level, was made by mud bricks with openings for the smoke to come out. In these ceramic kilns it was possible to have a stable firing atmosphere and to reach relatively higher temperature (Mégias 2017). The process of pottery making in workshops consist of clay
treatment, fuel collection, modelling and firing of the vessels, construction and repair of the kilns, etc. As the complexity of found sites indicates, the Turdetani pottery was made in crafting centres. According to the parallels that we know about the colonial Punic world, potters were specialists and the production was centralized (García Fernández, García Vargas 2012; Mégias 2017).
The Pellicer amphorae B/C and D were redistributed from the production centres to rural areas and used for in the transport of primary food products. The food goods were probably shipped from the fields to treatment structures or marketplace as raw materials. Many of the goods were processed as secondary food products (e. g. Garum), however, these treatment or shipping sites in and around the area of Seville had not yet been found. The amphorae could have been reused and were circulating in the trade network of the Lower Guadalquivir as common containers for transport of rural products or even secondary food products (Garcia-Fernandez et al. 2017; Mégias 2017). However, the Pellicer amphorae B/C and D filled with food products were exported by commercial ships from the Lower Guadalquivir or the commercial hub in Cadiz (where ceramic workshops were also found) to the broader area (e.g. Garcia-Fernandez 2019; Sáez Romero 2018). When the amphorae reached their destination, their content could have been redistributed, and the amphorae reused in a local scale there or even transported again. Ceramic objects as well as other artefacts after the time of usage in a living culture had been discarded and buried in the ground (Fig. 1.11). After the discard of the artefacts, depositional and post-depositional processes took place. These processes vary according to the local environment (Freestone 2001).
2.
Analytical techniques
2.1. Petrography of thin sections
Petrography of ceramics provides us basic information about the mineralogy and changes occurring in ceramic artefacts during long-term deposition in anthropogenic layers. Ceramic petrography is an analytical method based on optical mineralogy. It uses knowledge of optical properties minerals and rocks which can be identified by a petrographic (polarized light) microscope (Quinn 2013; Barker 2014).
Fig. 2.1 – Petrographic (polarized light) microscope configuration4.
The petrographic polarizing microscope allows us to study the sample in transmitted, reflected or combined light. To understand the optical properties of minerals it is necessary to know the basic facts about the symmetry of crystals and the properties of light. In the transmitted light of the microscope, the study is commonly performed on thin sections about 30 μm thick. Cleavage, relief (as a result of refractive index), shape and structure, colour and
pleochroism are monitored in linear polarized light (PPL). Birefringence and other properties are studied in XPL/CPL – cross polarized light (Fig. 2.1; Barker 2014; Hložek 2012).
In thin sections of ceramic artefacts, fragments of rocks and minerals in the temper can be identified, but also fragments from older ceramics (grog), bones, shells, fossils, etc. The size, shape and spatial orientation of the temper (and pores) are observed as well. From mineral fragments and rocks, we can deduce the degree of thermal transformation, changes in colour and optical properties, enamel formation, etc. Secondary mineralization and changes often reflect the effects of several thousand years in the anthropogenic layers and moving of groundwater. Based on changes of physical and optical properties of selected minerals, firing temperature can be determined as well as it is atmosphere (oxidative, reducing) or multiple lines responsible for an unstable condition. Using the petrographic microscope, we can objectively classify the microstructures of ceramics and characterize the binder. A detailed observation of pottery wares allows us to cluster the samples and recognize fabric and their provenance (Quinn 2013; Hložek 2012).
2.2. X-ray fluorescence (XRF)
X-ray fluorescence (XRF) is the most widely used method of atomic spectroscopy, and it is broadly used for the analysis of solid samples. A great advantage of XRF is the multi-elemental analysis of samples. The XRF technique has been widely used for provenance and technological studies of archaeological ceramics. The analysis can be performed non-destructively, commonly by portable equipment or in the form of powder in pressed-pellets or fused beads by a benchtop instrument (Artioli 2010; Beckhoff et al. 2006).
The principle of the method is the ionization of the sample atoms by primary X-ray radiation. X-ray spectrometry involves the following processes: generation of primary radiation in the anode of the X-ray tube, transfer of primary radiation to the sample, interaction of the radiation with the sample, secondary X-ray emission from the sample, and its measurement by the detector. In the analysed sample, electrons are ejected from the inner shells of atoms (K, L, M, N) and electrons from higher levels jump to the vacant spots of these released electrons. The energy of the fluorescent X-ray radiation corresponds to the difference of the energies of the two shells (Fig. 2.2). Secondary X-ray is emitted and is characteristic of a specific
element. The intensity is proportional to the amount of the element in the sample Artioli 2010; Beckhoff et al. 2006; Pollard et al. 2007).
Fig. 2.2 – Principle of X ray fluorescence spectroscopy 5.
2.3. X-ray diffraction (XRD)
X-ray diffraction (XRD) is a very powerful technique for identifying the arrangement of atoms in solid samples. It is a widely applied method for the study of ceramic artefacts. It is possible to work in micro or macro mode, while micro mode allows us to analyse small spots in the samples. For formalized analysis of ceramic body phase composition, samples should be ground into a fine powder (about 1 g of sample is needed). The study of mineral phases by XRD is fundamental for the understanding of thermal transformations occurring during the firing of ceramic. The mineralogical phases also allow identifying the origin of the raw materials used for the manufacture of ceramics. Using this method can be estimated qualitative, and semi-quantitative or quantitative phase composition of the ceramic body commonly after the Rietveld method (Artioli 2010; Stuart 2007).
Fig. 2.3 – Reflection of an X-ray beam by the planes of a crystal with interplanar spacing (after Bannert 2017).
The geometrical conditions for X-ray diffraction depend on the difference path taken by the monochromatic X-rays in crystal planes with the same orientation. This condition is expressed by Bragg's Law (𝑛𝜆 = 2𝑑 𝑠𝑒𝑛𝜃), where λ corresponds to the wavelength of the incident radiation, “n” represents the diffraction order, “d” corresponds to the interplanar distance for the set of planes of the crystal structure and θ to the X-ray incidence angle – measured between the incident beam and the crystalline planes (Fig. 2.3). (Bannert 2017; Pollard et al. 2007; Stuart 2007).
2.4. Electron microscopy (SEM-EDS)
The scanning electron microscope (SEM) has been used in a broad scale for analysis of samples related with Cultural Heritage and in plenty of studies about archaeological ceramics. SEM provides detailed images at a magnification range up to 100,000 times, and it is commonly associated with the X-ray Dispersive Spectroscopy (EDS) technique, which allows a quantitative point or area analysis of the chemical elements on the surface of the samples (Fig. 2.4). SEM analysis is based on the incidence of an accelerated electron beam on the sample surface and the subsequent collection of the electronic signals emitted by it. The sample’s surface is scanned sequentially by the electron beam. A respective image of the scanning is plotted as a raster image. The brightness of each point is determined by the intensity of the surface radiation emitted. Higher atomic number elements (heavy elements) backscatter electrons stronger than lower atomic number elements (Stuart 2007; Artioli 2010).
Fig. 2.4 – Scanning electron microscope6.
Samples analysed by electron microscopy must have certain characteristics: surface electrical conductivity; withstand the vacuum; and being physically and chemically stable under the conditions of observation – interaction with the electromagnetic beam. When the samples do not have electrical conductivity, they should either be metallized by applying an ultra-thin gold or carbon coating, or the SEM should be performed on a variable pressure mode. If the sample is small, it can be used non-destructively, however, there can be a problem with a morphology of the sample. To get representative structural information, common is analysis of samples in cross sections or thin sections which are also flat (Pollard et al. 2007).
The interaction of the electron beam with the sample results in the emission of radiation and electrons, including secondary electrons (SE) used in the formulation of the sample image. Secondary electrons are electrons in the sample that excite and “escape” from the surface.
6 https://163602-560839-raikfcquaxqncofqfm.stackpathdns.com/wp-content/uploads/2018/10/The-scanning-electron-microscope-SEM.jpg (25.8.2019).
Observation of images obtained through SE detection has strong topographic contrast. Retrodifused electrons, whose intensity is increasing with the atomic number (chemical composition of the sample), are electrons that hit the surface of the sample with high energy and are dispersed.
The interaction of the electron beam results in the emission of X-rays, which are used to identify the elements present in a “point” or a large “area” of the sample surface by EDS. The elements are identified by database in the computer system associated with the spectrometer. The results are plotted in a spectra, tables or elementary mapping distribution with only qualitative analysis (Pollard et al. 2007).
2.5. Organic content analysis (GC-MS)
Chromatography is based on the separation of compounds using two immiscible phases - mobile (eluent) and immobile (stationary). Considering the mobile, chromatography can be divided into a liquid and gas chromatography. The gas chromatography coupled with mass spectrometer (GC-MS) has been widely used for the separation, identification and quantification of organic residues preserved in archaeological ceramics (Fig. 2.5; Dune et al. 2018; Roffer-Salque et al. 2017). The ceramic material is porous and can retain the chemical signature of the organic material stored inside it. Among the classes of organic compounds preserved in archaeological materials, lipids are prominent. The presence of lipids, particularly saturated compounds, is due to their resistance to degradation by chemical and microbial processes. Saturated carbon chains give them a hydrophobic character. According to patterns of saturated molecules or biomarkers, distinct matter can be identified. The study of archaeological organic residues is hampered by the frequent complexity of the recovered extracts (Barnard, Eerkens 2017; Evershed 2008).
Fig. 2.5 – Schematic plot of the main components of standard GC–MS instruments (Emwas et al. 2015, Fig. 1).
Before a possible organic residue of ceramic is analysed, it must be extracted from the ceramic material. The conventional extraction method uses a mixture of solvents (CHCl3 / MeOH, 2:1
v/v) added to a test tube with grounded ceramic powder. The lipid classes that are usually recovered using this method include fatty acids, acyl glycerols, long chain ketones, wax esters, n-alkanols and n-alkanes, which are derived from animal fats and/or oils, vegetables and waxes. For specific questions and samples can be used other organic solvent (Evershed, 2008).
Samples analysed by GC-MS must be also sufficiently volatile and thermally stable. Gas chromatography is applied for the separation and identification of all components which can be converted into the gas phase without decomposition. Thermolabile compounds can only be analysed after their chemical derivatization. In general, derivatization reactions have the advantage of increasing volatility and stability of the compounds. One of the most frequent reaction is silylation. The mechanism involves the replacement of active hydrogen atoms (in -OH, -COOH, -NH, -NH2, -SH) by a trimethylsilyl group (TMS). The most versatile and common derivatizing reagent is N,O-Bis- (trimethylsilyl) trifluoroacetamide with 1% trimethylchlorosilane (BSTFA-TMCS), which produces trimethylsilyl ether derivatives, allowing this reagent to derivatize a wide range of polar organic compounds. Reaction products are more volatile and thermally stable than the original compounds (Moldoveanu, David 2018).
After the extraction and derivatization, the sample is injected into the GC equipment. The injection can be in the split (if the sample is very concentrated) or splitless mode. Then the sample is vaporized and dragged onto a chromatographic column with the aid of a gas. The
carrier gas must be inert and pure as it must not react with the sample, stationary phase or instrument. The flow of this gas (mobile phase) passes through the chromatographic column, which separates the substances based on their lower or higher affinity with the stationary phase. The capillary columns are nowadays widely used: they are efficient due to their small diameter, quite large length, and requirement of a small amount of sample. There is wide range of columns with different polarity (Rahman 2015). Apart from the polarity of the column, a temperature program is an essential factor in the separation of the compounds. Increasing column temperature results in decreased retention times which may lead to the loss of resolution. Therefore, a heating ramp is used to shorten the analysis time of complex samples and improve the chromatographic separation (Pollard et al. 2007).
As the compounds elute from the column, they are detected on the mass spectrometer (MS), which count them according to the mass/charge ratio (m/z). The mass spectrometer consists of an ionization source, analyser and detector in a vacuum system connected to a data processing system. Among the various types of MS, the quadrupole is the most common mass analyser. Regarding ionization sources, the most used is electron ionization (EI). In ionisation source, gas phase with sample is bombarded by high-energy electrons. This leads to the production of a cation molecular ion (represented by mass M+.). In a mass spectrum, the
resulting signal of each ion is observed. This information is used to identify compounds of interest and to elucidate the structure of components of unknown mixtures. EI is suitable for volatile, low molar mass and thermostable compounds (Hoffmann, Stroobant 2007).
3. Materials and methods
For the purpose of study, 30 ceramic shards were elected (20 bottoms and 10 rims). The shards were previously processed by archaeologists and labelled by a varnish sticker. The samples of bottoms contain: 14 bottoms of Pellicer B/C amphorae – type I, 2 bottoms of amphorae without a distinctive protrusion – type II, and 4 local common wares with probable local provenance – type III. All 10 rims are defined as the Pellicer D amphorae - type IV.7 The bottoms of amphorae are possible to divide after the oval protrusion (Fig. 3.1). The samples of bottoms are mainly dated from the second half of 5th century BC to the beginning of 4th
century. The rims of Pellicer D are mostly associated with the second half of 1st century BC
(Table 1). Commonly, the shards have on the surface, red areas related with the oxidation of iron in the ground. One shard of the bottom of Pellicer B/C amphora (13167) has 3 holes in the sides as probable reminiscence of the vessel repairing (South 1968; Annex I).
Fig. 3.1 – A: Pellicer B/C amphora with the smaller, pointed protrusion and concave wall (sample 4, 12356); B:
Pellicer B/C amphora with the smaller oval protrusion (sample 10, 12655), C: Pellicer B/C amphorae with the bigger and oval protrusion (sample 12, 3698), D:The bottom similar to Pellicer B/C amphora without significant protrusion (sample 15, 12658), E: The bottom similar to MPA4 amphora with probable Cadiz origin (sample 16, 11078), F: The concave bottom of probable local common ware (sample 19, 12047).
Table 1 – List of samples with primary information about ceramic typology, dating and shard characteristic; additional information is referenced in the Annex I.
Sample
number General type of vessel
Type notation
Probable
provenance Contextual dating Outside colour Inside colour
Fragment size Part of the vessel Shape (Fig. 3.1)
1 Pellicer B/C amphora I Guadalquivir ? beige red medium bottom A
2 Pellicer B/C amphora I Guadalquivir 5th-4th c. BC beige orange big bottom A
3 Pellicer B/C amphora I Guadalquivir 2nd half of 5th c. BC pale yellow orange small bottom A
4 Pellicer B/C amphora I Guadalquivir 2nd half of 5th c. BC pale yellow pale pink, orange big bottom A
5 Pellicer B/C amphora I Guadalquivir 2nd half, 5th c. BC pinkish beige orange small bottom A
6 Pellicer B/C amphora I Guadalquivir 2nd half, 5th c. BC greyish beige greyish beige small bottom B
7 Pellicer B/C amphora I Guadalquivir ? beige orange medium bottom B
8 Pellicer B/C amphora I Guadalquivir ? pale yellow pinkish orange small bottom B
9 Pellicer B/C amphora I G. - Queimada 2nd half of 5th c. BC orange, grey greyish beige small bottom B
10 Pellicer B/C amphora I Guadalquivir 2nd half of 5th c. BC pale yellow pale pink, orange medium bottom B
11 Pellicer B/C amphora I G. - Gatada 1st half of 5th c. BC pale yellow pale orange medium bottom B
12 Pellicer B/C amphora I Guadalquivir 2nd half, 5th c. BC beige pale pink small bottom C
13 Pellicer B/C amphora I Guadalquivir 4th c. BC beige orange big bottom C
14 Pellicer B/C amphora I Guadalquivir 5th-4th c. BC beige beige-orange small bottom C
15 Amphora without protrusion II Guadalquivir 2nd half of 5th c. BC brownish beige pinkish orange medium bottom D
16 Amphora without protrusion II Cadiz 5th-4th c. BC pale orange, olive brown olive grey medium bottom E
17 local common ware III Castro Marim 5th-4th c. BC pale pink pale pink medium bottom F
18 local common ware III Castro Marim 4th c. BC orange brownish red big bottom F
19 local common ware III Castro Marim 5th-4th c. BC reddish orange reddish orange big bottom F
20 local common ware III Castro Marim 5th-4th c. BC pale pink pale pink big bottom F
21 Pellicer D amphora IV Cadiz area 1st c. BC pale yellow pale yellow big rim
22 Pellicer D amphora IV Guadalquivir 1st c. BC orange orange medium rim
23 Pellicer D amphora IV Cadiz area 1st c. BC pale yellow pale yellow medium rim
24 Pellicer D amphora IV Guadalquivir 1st c. BC pale yellow pale yellow big rim
25 Pellicer D amphora IV Cadiz area 1st c. BC pale yellow pale yellow medium rim
26 Pellicer D amphora IV Cadiz area 1st c. BC pale yellow pale yellow medium rim
27 Pellicer D amphora IV Cadiz area 1st c. BC pale yellow pale yellow medium rim
28 Pellicer D amphora IV Cadiz area 1st c. BC pale yellow pale yellow medium rim
29 Pellicer D amphora IV Guadalquivir ? pale orange pale yellow medium rim
Before any additional work, the samples of shards were documented with a scale by a digital camera (Nikon D3100 equipped with 18-55mm objective) placed at a stand desk. Information from the label at the surface of shards are written in the catalogue of samples (Annex I).
The ceramic itself has specific nature according to the used raw material, manufacturing process and firing. For identifying provenance and understanding the ancient technology, the proper description and scientific analysis is necessary. For formalized characterization of ceramic material, multianalytical protocol containing petrography of thin-sections, X-ray fluorescence (ED-XRF), powder X-ray diffraction (powder XRD) and scanning electron microscope coupled with X-ray Dispersive Spectroscopy (SEM-EDS) was implemented.
To discover possible past content of ceramic, gas chromatography coupled with mass spectrometer (GC-MS) was carried out to the selected bottoms after the provenance.
3.1. Petrography
To complete each thin section, a piece of shard from the sample was cut along ceramic body to have representative section and fine size for a standard glass slide (7x5 cm) by a saw (Discoplan TS Struers). Then the samples were washed and dried. The cut pieces were embedded in an epoxy resin (Epofix Fix, Struers A/S, Ballerup, Denmark; resin / hardener; 7:1) and kept 24 hours to get hard. The shards in resin were polished by sandpapers from bigger grain size to fine one (Struers, SiC, FEPA P # 320, 500, 800, 1200, 2000 and 4000). Cleaned and dried cross sections were glued on the pre-polished glass slide (standard thickness 1,161 mm) with Araldite (1:1) and hardening few hours pressed at a hot plate. After 24 hours the cross sections were cut from the glass slide by the saw. The glass slides were ground smoothly by the saw until they were approximately 1,3 mm thick. Next, thin sections were polished by a silicon carbide grid powder (< 5 μm) and water until they reached a fine thickness about 30 μm of sample at the glass slide. The fine thickness was checked by the petrographic microscope. Quartz was used as thickness standard, respectively its first-order interference grey-white colour under cross polarized light. The final thin sections were not covered by a permanent glass for a possibility to do SEM-EDS analysis.
The petrographic analysis of thin sections was performed in all 30 samples using a Leica DM2500P polarized microscope. The images were captured with a Leica MC 170HD digital camera attachment to the equipment (Leica microsystems, Wetzlar, Germany). The thin sections and rock minerals or other intrusions were described and identified after the standard keys (Quinn 2013; Barker 2014). The cross sections were documented as well by a stereomicroscope (Leica DFC 295) to have representative images in smaller magnification.
3.2. ED-XRF
For purpose of XRD and XRF analysis, the parts of shards were cut and each one was completely cleaned by a Dremel multitool (DREMEL® 3000) with a diamond wheel point 4,4mm (7105) to avoid a contamination. Then, the samples were ground to the fine powder in the agate mortar by pestle. The grinding tools were always carefully washed and dried.
For ED-XRF analysis, beads were made in a Claisse Fluxer® LeNeoTM fusion instrument. A 1,2g of powdered sample was mixed with 12 g of lithium iodide in a crucible and fused in 1065°C. After the fusion, the instrument cast a fluid into a mould for the bead.
Since the calibration of XRF data require the exact value of total loss of ignition (LOI), a slightly modified standard protocol with porcelain crucibles was applied (Heiri, Lotter, Lemcke 2001). The crucibles with scrapped reference were firstly calcinated in a furnace. When the temperature reached 1065 °C, the crucibles were 90 minutes heated. After that, they were directly placed to a desiccator with a silica gel and closed. When the crucibles cooled down in the desiccator, they were weighted and 0,5g of sample powder was placed inside. After, all crucibles with samples were again heated to 1065°C for 90 minutes, placed to the desiccator, cooled and weighted. The loss of weight was calculated after the initial weight of crucible, sample and final weight of the calcinated crucible with the sample.
The chemical compositions of the ceramic materials were determined in a Bruker S2 Puma energy dispersive XRF (ED-XRF). Spectrometer is equipped with a silver anode X-ray tube. All 30 samples were analysed as the glass disks. The quantitative data were obtained after careful calibration using siliceous commercial standard beads. The results were evaluated in bi-axial
and ternary plots and by Principal component analysis (PCA) in software PAST-3.8 The values of main oxides (except P2O5 and SO3) were transformed into logarithmic scale (function – log;
Appendix III) and multivariate by PCA (Carlson 2017).
3.3. Powder XRD
To get mineral composition of samples powdered bulk samples, approximately 1g of sample was analysed by a Bruker D8 Discover X-Ray Diffractometer with Cu Kα source at 40 kV and 40 mA. The analysis was done for all 30 samples. The patterns were collected at a 2θ angular range of 3°-75°, with 0,05° step size and 1s measuring time by a point. The LYNXEYE linear detector provides an increased signal. Identification of minerals was performed using the DIFFRAC.SUITE EVA software and the ICDD PDF-2 database. The semi-quantitative determination of the mineral abundance in the bulk samples was obtained by the Reference Intensity Ratio (RIR) method (the reference standard was corundum). The intensities of distinct peaks were compared between the samples as well.
3.4. SEM-EDS
SEM-EDS analysis of 12 elected thin sections was performed with a HITACHI S-3700N SEM interfaced with a Quanta EDS microanalysis system to identify chemical composition of specific intrusions. The microanalysis system was equipped with a Bruker XFlash 5010 Silicon Drift Detector (SDD) with a resolution of 129 eV at Mn Ka and the EDS chemical data were acquired in the form of elemental distribution maps processes with Bruker ESPRIT 1.9 software. The EDS quantitative analysis was carried out by point micro-analyses. The EDS analysis were done in BSEM mode by accelerating voltage of 20 kV, 10 mm working distance, 120 μA emission current, and chamber pressure of 40 Pa. The detection limits for major elements (NNa) were in the order of 0.1 weight % (after Schiavon et al. 2015). The SEM images were captured in backscattering (BSE) and secondary electron (SE) modes.