Plasters of the Late Chalcolithic
3-4 (3800-3400 BCE) from the
site of Arslantepe. A
contribution to the analysis of
architectural techniques and
practices
supervisore
student
2
Plasters of the Late Chalcolithic 3-4
(3800-3400 BCE) from the site of Arslantepe. A
contribution to the analysis of architectural
techniques and practices
Facoltà di scienze matematiche,fisiche e naturali
ARCHMAT (ERASMUS MUNDUS MASTER IN ARCHaeological MATerials Science)
Corso di laurea inscience e tecnologie per la conservazione dei beni culturali
Samah Al-Khasoneh Matricola 1876076
Supervisore
GABRIELE FAVERO Co-supervisore
FRANCESCA RESTELLI BALOSSI Extra supervisore
3
ACKNOWLEDGEMENTS
I would like to thank Dr, Laura Medeghini for her continuous guidance, leading, and help during this research.
I would also like to thank Prof. Francesca Balossi for giving me the opportunity to study this very interesting material as my master’s degree research. and for her archeological guidance, suggestion and note for this research.
And for sure I would also thank Prof. Gabriele Favero for his scientific guidance, and his leading to the direction of this work from the beginning.
I would also thank Prof. Nick Schiavon for giving me such opportunity to be one of the great ARCHMAT family, and to have this great chance to get the knowledge and experience from all those great professors and teachers from three excellent universities (university of Evora, Aristotle University of Thessaloniki, and University of Rome La Sapienza).
Finally, my endless thanks go to some of the very special people in my life who have been with me throughout this experience and either practically and/or emotionally were right behind me. Starting with my family, my teachers in Jordan, and my friends for their support during this amazing ARCHMAT journey.
4
ABSTRACT
A multi-analytical approach focus on the archaeometric characterization of plaster from temple C, and two elite houses belong to the late chalcolithic 3-4 (3800-3400 B.C), period VII in Arslantepe – Turkey, a site located in the Malatya plain, 5 km away from the city center and 15 km away from the Euphrates right bank, is done using three different methods: optical microscopy (OM) in thin section under polarizing microscopy to define petrographic features in terms of plaster fabric texture and structure as well as the type, percentage, ratio grain size and distribution of the added aggregate and inclusions Micro-morphological analysis has been carried out by Scanning Electron Microscopy coupled with Energy Dispersive Spectroscopy (SEM-EDS) to define the fabric , inclusions and the secondary product in the pores . a mineralogical analysis by X-ray powder diffraction (XRPD) has been carried out also to identify the quantitative and qualitative mineralogical composition of the samples. In a result a marly limestone has been determine as a plaster raw material which probably came from two different source (local and other imported from different part of Malatya plain). Moreover, different aggregate selection, and diffirent technological levels were also detected in the samples, that are probably related to the level or the purpose (function) of the buildings. An evidence of a re-plastering process was also detected in the two elite houses, which probably refer to a routine maintenance process.
Key words: Arslantepe, plaster, re-plastering, technological level, fabric, aggregate, fourth millennium B.C., period VII, OM, SEM-EDS, XRPD, chemical composition, mineralogical composition.
5
TABLE OF CONTENT
1. INTRODUCTION……… 12 2. MORTARS ……… 13 2.1 HISTORICAL BACKGROUND ……… 13 2.2 DEFINITION ………... 21 2.2.1 LIME PLASTER……… 21 2.2.2 GYPSUM PLASTER ……… 22 2.2.3 MUD PLASTER ………... 22 3. ARCHAEOLOGICAL SETTING ……….... 233.1 ARSLANTEPE DURING THE 4TH MILLENNIUM B.C. ……… 26
3.1.1 LATE CHALCOLITHIC 3-4 (3800-3400 B.C.) PERIOD VII ……… 26
3.1.2 LATE CHALCOLITHIC 5 / LATE URUK (3350- 3100 B.C.) PERIOD VI A ……… 29
3.2 ARSLANTEPE BULDING MATERIAL AND TECHNIQUE DURING THE 4th MILLENNIUM B.C . …… 32
4. GEOGRAPHICAL AND GEOLOGICAL SETTING ……… 34
5. RESEARCH PURPOSE ……….. 35
6. MATERIALS AND METHODS ……… 36
6.1 MATERIALS ……… 36
6.2 METHODS ……… 41
6.2.1 OPTICAL MICROSCOPY (OM) ……… 41
6.2.2 X-RAY POWDER DIFFRACTION (XRD) ……… 41
5.2.3 SCANNING ELECTRON MICROSCOPY COUPLED WITH ENERGY DISPERSIVE SPECTROMETRIC ANALYSIS (SEM-EDS) ……… 42
6
7.1 OPTICAL MICROSCOPY RESULTS ……… 43
7.2 XRD RESULTS ……… 50
7.3 SEM-EDS RESULTS ……… 53
8. DISCUSSIONS ……… 64
8.1 DESCRIPTION OF MORTAR AND PLASTER ……… 64
8.2 COMPARISON BETWEEN TEMPLE AND HOUSE ……… 67
7
LIST OF FIGURES
Figure 1 view of a painting uncovered at Djade al-Mughara Neolihic site, northeast of the Syrian city of Aleppo, in this September 2007 handout photo. REUTERS/Handout. https://www.reuters.com/article/us-syria-painting/worlds-oldest-wall-painting-unearthed-in-syria-idUSOWE14539320071011 ... 14
Figure 2 Red painted wall plaster in Basta (Gebel et al. 2006, 269) ………15 Figure 3 Ostriches and crane painting in Bouqras, House 17. (Akkermans et al. 1982, 49) ……… 15 Figure 4 The famous “Hunting scene” B.V.1, South Area ( www.corbisimages.com/stock-photo/rights-managed/4225028825/neolithic-wall-mural-from-catal-hoyuk) ……… 16 Figure 5 Plastered skull (D112/J 5758) from Jericho with mandible. Courtesy of the Jordan Archaeological Museum, Mohammad Fayyez, photographer. (Bonogofsky, 2006) ……… 17 Figure 6 Plastered skull Ks¸k. 2006. No. 5. Frontal view. (Özbek, 2009) ……… 18 Figure 7 Restored plaster statue (left) and bust from the 1983 cache. The taller figure is approximately 90 cm high. (Photo: P. Dorrell and S. Laidlaw. (Rollefson et al.,1992) ……… 19 Figure 8 Arslantepe a sttalite view (Googl map) ………. 23 Figure 9 The mound of Arslantepe and the excavated areas (Frangipane, 2012) ………. 25 Figure 10 Arslantepe, period VII. The so-called “column building” viewed from the north (Frangipane, 2013) ……… 27 Figure 11 Arslantepe, period VII. Temple C. a.Plan of Temple C and its reconstructed layout; b.The niched north-eastern corner of the large central hall A900; c. Mass-produced bowls scattered on the floor of the central hall A900; d. Bowls piled up in the side room A932 (Frangipane, 2013) ……… 28 Figure 12 Arslantepe, period VI A (LC5). Wall paintings in the palatial complex (Frangipane, 2012) ……… 29 Figure 13 Arslantepe. Temple B and the eastern sectors of the palace complex viewed from the north (Frangipane, 2013) ……… 30 Figure 14 Arslantepe. Storeroom complex (Frangipane, 2013) ……… 31
8
Figure 15 Regional geological map of the Malatya-Elazığ region, showing the location of the site Arslantepe (slightly modified from Turkish Geology Map of MTA 2002, 1:500,000 scale) (Fragnoli, 2018) ……… 34 Figure 16 Sample A900 RM3 VII 2011 / 1135, sample A900 M2 VII 2007/102 come from a central room of a large tripartite ceremonial building called “Temple C” ……… 37 Figure 17 Sample A950 M1 VII 2017 came from A950, the lateral small storing room on the north eastern side of Temple C ……… 38 Figure 18 the plaster layer Sample A950 M1 VII 2017 ……… 38 Figure 19 Sample D7(3) A1469 M3 VII 2018/257 come from A1469 probably a rectangular elite residence ……….. 39 Figure 20 Sample D6(12) A1489 13a VII 2018/108 come from A1489 probably a rectangular elite
residence ……… 40 Figure 21 the crushed sample in an agate mortar ……… 41 Figure 22 two sample on FEI Quanta 400 SEM (EDS) ……… 42 Figure 23 XP AND PPL thin section showing the texture and the structure of sample A900 RM3 VII 2011/1135, with a magnification rang 10* / 0.30 (2.4 mm diameter) ……… 43 Figure 24 XP AND PPL thin section showing the texture, the structure and fissuring of sample A900 M2 VII 2007/102 with a magnification rang 2.5 * / 0.075 (8 mm diameter) ……… 44 Figure 25 XP AND PPL thin section showing the texture, the structure and aggregate of sample A950 M1 VII 2017. with a magnification rang 2.5 * / 0.075 (8 mm diameter) ……… 44 Figure 26 XP AND PPL thin section showing Remains of under burnt lime stone inclusion (Lumps) in sample A950 M1 VII 2017. with a magnification rang 10* / 0.30 (2.4 mm diameter) ……… 45 Figure 27 XP AND PPL thin section showing Remains of one of the charcoal pieces in sample A950 M1 VII 2017. with a magnification rang 10* / 0.30 (2.4 mm diameter) ..……… 45 Figure 28 XP AND PPL thin section showing the whit calcite re-crystallization inside the fissuring and the pores of sample A950 M1 VII 2017. with a magnification rang 2.5 * / 0.075 (8 mm diameter) ……… 46
9
Figure 29 XP stratigraphic thin section of sample D7(3) A1469 M3 VII 2018/257 showing four plaster layer with a thickness 1.44, 1.79, 1.45, 1.03 mm. in a magnification range 2.5 * / 0.075 (8 mm diameter
……… 46
Figure 30 XP AND PPL thin section showing the whit calcite re-crystallization inside the fissuring in sample D7(3) A1469 M3 VII 2018/257. with a magnification rang 10* / 0.30 (2.4 mm diameter) ……… 47
Figure 31 XP AND PPL horizontal thin section showing the texture, the structure of sample D7(3) A1469 M3 VII 2018/257. in a magnification range 2.5 * / 0.075 (8 mm diameter) ……… 48
Figure 32 XP thin section of sample D6(12) A1489 13a VII 2018/108 show structure and texture of two layer of plaster. In a magnification rang 2.5 * / 0.075 (8 mm diameter). ……… 49
Figure 33 XP AND PPL thin section showing the whit calcite re-crystallization inside the fissuring and the pores of sample D6(12) A1489 13a VII 2018/108. In a magnification rang 10* / 0.30 (2.4 mm diameter). ……… 49
Figure 34 Sample A900 RM3 VII 2011/1135 XRD diffractogram……… 50
Figure 35 Sample A900 M2 VII 2007/102 XRD diffractogram ……… 50
Figure 36 Sample A950 M1 VII 2017 XRD diffractogram ……… 51
Figure 37 Sample D7(3) A1469 M3 VII 2018/257 XRD diffractogram ……… 51
Figure 38 Sample D6(12) A1489 13a VII 2018/108 XRD diffractogram ……… 52
Figure 39 sample A9OO RM3 VII 2011/1135 backscattering image by SEM(EDS) on the right, OM XP image in the left ………..53
Figure 40 sample A9OO RM3 VII 2011/1135 SEM(EDS) chemical composition spectrum and table ……… 53
Figure 41 A900 M2 VII 2007/102 backscattering SEM(EDS) binder image on the right, OM XP image on the left ……… 54
10
Figure 43aggregate SEM (EDS) backscattering image and chemical composition spectrum ………. 55 Figure 44 dolomite SEM (EDS) backscattering image and spectrum. ……… 56 Figure 45 sample A950 M1 VII 2017 aggregate SEM(EDS) backscattering image on the top, chemical composition spectrums, OM XP image on the right. ……… 56 Figure 46 sample A950 M1 VII 2017 charcoal piece SEM(EDS) backscattering image on the right, OM XP image on the left ……… 57 Figure 47 sample A950 M1 VII 2017 shell fossil fragment SEM(EDS) backscattering image and chemical composition spectrum ……… 57 Figure 48 sample A950 M1 VII 2017 fossil SEM(EDS) backscattering image ……… 58 Figure 49 sample A950 M1 VII 2017 siliceous rock fragment SEM(EDS) backscattering image on the top, chemical composition spectrum, and OM XP image on the bottom. ……… 58 Figure 50 sample A950 M1 VII 2017 secondary calcite product SEM(EDS) backscattering image on the top, chemical composition spectrum. OM XP image on the bottom ……… 59 Figure 51 four layers sample D7(3) A1469 M3 VII 2018/257 SEM(EDS) backscattering image on the top showing 1.44,1.79,1.45, 1 .03 mm layers thickness, chemical composition spectrums. OM XP image on the bottom………..60 Figure 52 superficial and the substrate part of layer 1 sample D7(3) A1469 M3 VII 2018/257 SEM(EDS) chemical composition spectrums……… 61 Figure 53 inclusion from the colored part on the upper layer sample D7(3) A1469 M3 VII 2018/257 SEM(EDS) backscattering image on the right, OM XP image on the lift………..61 Figure 54 D6(12) A1489 13a VII 2018/108 two layer of plaster SEM(EDS) backscattering image on the top showing 1.30 mm thickness of the surface layer, chemical composition spectrum for the surface layer on the top and for the substrate layer on the bottom, OM XP image on the bottom ……… ………..62 Figure 55 fragment of bone sample D6(12) A1489 13a VII 2018/108 SEM(EDS) backscattering image and chemical composition spectrum ……… 63
11
LIST OF TABLES
Table 1 Arslantepe chronology ... 23 Table 2 List of samples. Identification, collocation, chronology, reference building ... 36 Table 3 XRD result (++++ very abundant 70-50%; +++ abundant 50-30%; ++ present 30-15%; + scarce 15-5%; tr. Traces <5%)... 52
12
1. INTRODUCTION
Since the ancient time, the plaster has played an important role in the life of the humanity. It was used for a microlithic tools (Bar-Yosef & Goring-Morris, 1977), ritual and symbolic purpose (Goring-Morris, 2000), and later became a major material used in most of domestic structure built during the pre-historic time (Rollefson, 1990a). Usually the large compositional variation and difference among the ancient plaster samples beside the deterioration and ageing factors make the characterization of plaster a very hard mission (Elsen, 2006).
This research will represent the result of a multi-analytical study focus on the archaeometric characterization of the 4th millennium B.C. plaster from temple C, and two elite houses belong to late Chalcolithic 3-4 (3800-3400 B.C), period VII from Arslantepe – Turkey, a site located in the Malatya plain, 5 km away from the city center and 15 km away from the Euphrates right bank.
The aim of this study is to determine the mineralogical, petrographic, and chemical composition of five samples from four different structure in Arslantepe, in order to identify the composition and the origin of the raw material, and to explore and evaluate the building practice and technique and all the related process like maintenance. therefore, this study deals with the characterization of this plaster in order to determine potential differences in composition or technology. and their correlation with the function and the type of the structure.
For this purpose, five different samples have been investigated using three methods. optical microscopy (OM) in thin section under polarizing microscopy to define petrographic features in terms of plaster fabric texture and structure as well as the type, percentage, ratio grain size and distribution of the added aggregate and inclusions Micro-morphological analysis has been carried out by Scanning Electron Microscopy coupled with Energy Dispersive Spectroscopy (SEM-EDS) to define the fabric , inclusions and the secondary product in the pores . a mineralogical analysis by X-ray diffraction (XRD) has been carried out also to identify the quantitative and qualitative mineralogical composition of the samples.
The results obtained by the application of different analytical techniques are held out and discussed in separate sections in order to get more clear and wider vision on the characterization of the plaster samples.
13
2. MORTAR
2.2 HISTORICAL BACKGROUND
Plaster and mortar are very interesting artificial stone materials that were used from the prehistoric time until today and played an important role in ancient constructions, and used in a wide range of different purpose (Rollefson, 1990a) as it was recorded and studied by Aristotle (384-322 B.C.), Theophrastos (372- 287 B.C.), Stravon (63/64 B.C. -23 A.D.) and Pliny (23-79 A.D.) (Vasiliki et al., 2014).
“The plaster” is a generic term that involve a wide range of product which make it very confusing to be interpreted among the pre-historic archeologist (Rollefson, 1990b). For example, Garstang, in his reports on excavations at Jericho in the 1930s, referred to "lime plaster" and "clay plaster" almost interchangeably and was it not clear what exact material he refers (Kenyon, 1981).
According to Bar-Yosef & Goring-Morris (1977) the earliest identified use for plaster as cement to a haft microlithic tool was dated 12000 B.C. and found at the site of lagma (Sinai).
Morris also presented a hypothesis that the plaster was first used for a ritual purpose as modelling facial features on skulls and for statuary and that the massive use of lime plaster for profane construction probably had symbolic significance (Goring-Morris, 2000).
Later, Kingery & Prickett (1988) mention that the earliest well-characterized example of quicklime production is in the Hayonim Cave (Israel) dated to the Natufian period at about 10400–10000 B.C. (Kingery & Prickett, 1988).
According to Christidou, Coqueugniot, & Gourichon the earliest known circular mud brick building with a wall painting is in Dja'de el Mughara (Aleppo) (Figure 1 ) dated to the Pre – Pottery Neolithic A period 11.000 B.C. (Christidou et al., 2009). Later the carbon 14 dating study showed the wall painting dated back to 9000 B.C (Çamurcuoglu, 2015). At present there is no published information about the technology of this painting or what preparation layer the painting had.
14
Figure1 view of a painting uncovered at Djade al-Mughara Neolihic site, northeast of the Syrian city of Aleppo, in this September 2007 handout photo. REUTERS/Handout. https://www.reuters.com/article/us-syria-painting/worlds-oldest-wall-painting-unearthed-in-syria-idUSOWE14539320071011
Wright (2005) described the first use of a mortar as a structural mud-mortar in Mesopotamia and Babylonia during the 8th millennium B.C. (Vasiliki et al., 2014).
Later, at the half of the 8th millennium B.C. the plaster production became a major undertaking in the Levant, and produced in industrial scale (Rollefson, 1990a). Most of the domestic structures built during the Pre – Pottery Neolithic B period (ca. 7500-6000 B.C.) included plaster floors and plaster washed interior walls and ceilings (Rollefson, 1990a). Such as “Ain Ghazal (Jordan)” (Byrd & Banning, 1988; Rollefson & Simmons, 1985, 1988; Rollefson et al., 1992), “Ghwair I (Jordan)” (Simmons & Najjar, 2006), “Ba’ja (Jordan) (Gebel et al., 2002), “Basta (Jordan) (Figure 2)” (Gebel et al., 2006), “Teleilat Ghassul
15
(Jordan)” (Schwartzbaum et al., 1980), “Abu Hureyra (Syria)” (Moore et al., 1975), and “Tell Bouqras (Syria)( Figure 3 )” (Merrett & Meiklejohn, 2007).
Figure 2 Red painted wall plaster in Basta (Gebel et al. 2006, 269).
Figure 3 Ostriches and crane painting in Bouqras, House 17. (Akkermans et al. 1982, 49).
The Neolithic histories and material cultures of Syro-Palestine, Anatolia, Cyprus, and Mesopotamia are closely associated and interdependent, but they are not identical (Twiss, 2007)-.
16
In Anatolia the earliest use of mud binder as a mortar was dating back to the PPNA (9600-8500 cal. BC). A circular bulding made of stone, mud, clay, wattle/daub or pise, all naturally available materials, where found in Pınarbaşı (Baird, 2012), Hallan Çemi and the early levels of Çayönü.
Later as in the levant the plastering practice became a major undertaking during the Pre-Pottery Neolithic B (PPNB) and used in the most central/southeastern Anatolia sites such as “Boncuklu (central Anatolia)” (Baird et al., 2012), “Aşıklı Höyük (central Anatolia)” (Cutting et al., 2006)., “Çayönü (southeast Anatolia)” (Erim-Özdoğan, 2011), “Can Hasan III (central Anatolia)” (French, 1972).
In Çatalhöyük (central Anatolia) the marl- which is a natural available sediment, composed of very fine-grained calcium carbonate and also rich in clay- was used as a unique plastring material for the mud brick walls (Figure 4) (Siddall & Çamurcuoglu, 2016).
Figure 4 The famous “Hunting scene” B.V.1, South Area (www.corbisimages.com/stock-photo/rights-managed/4225028825/neolithic-wall-mural-from-catal-hoyuk).
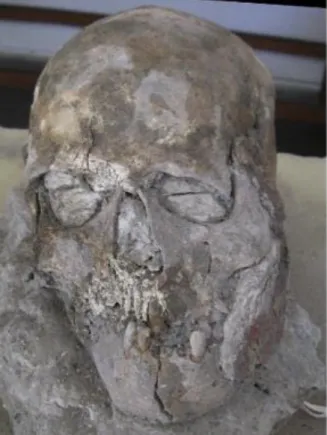
Earlier during the pre-pottery Neolithic, the use of plaster was not confined in floors and walls, but, according to Gourdin & Kingery (1975), it has been also used for a ritual purpose (Clarke, 2012). The lime plaster also enabled other forms of art to emerge. such as decorating human/animal skulles (Bonogofsky, 2006), masks, anthropomorphic figures, figurines and sculptures.
Some example of plastered skulls are found in: “Jericho (Palestine) (Figure 5)” (Strouhal, 1973; Rollefson, 1985), “Tell Ramad (Syria)” (Ferembach, 1969; Ferembach & Lechevallier, 1973), “Tel Aswad (Syria)” (Stordeur, 2003), “Ain Ghazal (Jordan)” (Butler, 1989; Simmons et al., 1990), “Nahal Hemar (Israel)” (Yakar & Hershkovitz, 1988; Arensburg & Hershkovitz, 1988), “Kfar Hahoresh (Israel)” (Goren et
17
al., 2001 ; Simmons et al., 2007), and ”Beisamoun (Israel)” (Ferembach & Lechevallier, 1973; Lechevallier, 1978), “Göbekli Tepe (Turky)” (Renfrew, 2015), “Çatalhöyük (Turky)” (Hodder, 2007), “Köşk Höyük (Turky) (Özbek, 2009) (Figure 6)”.
Figure5 Plastered skull (D112/J 5758) from Jericho with mandible. Courtesy of the Jordan Archaeological Museum, Mohammad Fayyez, photographer. (Bonogofsky, 2006).
18
Figure 6 Plastered skull Ks¸k. 2006. No. 5. Frontal view. (Özbek, 2009)
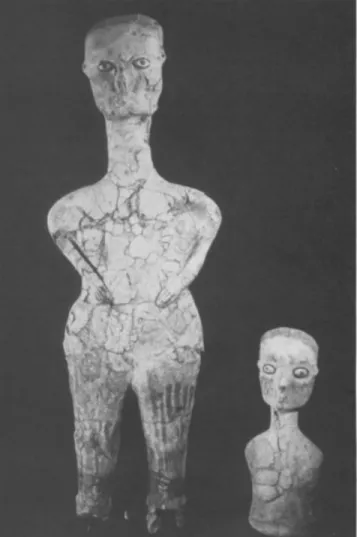
morever, one of the most emportant example of the PPNB large scale Plaster sculptures are the one from Ain gazal (Jordan) (Figure 7). The sculteres made from plaster around a reed core which was tied together with twine (Tubb & Grissom, 1995). Eyes were made of shell or limestone (white), which were placed into plaster statues, and often lined with bitumen (black) and with bitumen irises (Grissom, 2000).
19
Figure 7 Restored plaster statue (left) and bust from the 1983 cache. The taller figure is approximately 90 cm high. (Photo: P. Dorrell and S. Laidlaw.(Rollefson et al.,1992)
On the other hand, most prehistoric plasters and mortars are not a completely pure product and consist a very small amounts of burnt lime mixed with anthropogenic debris, soil, and sediment (Karkanas, 2007). For example: in Hayonim Cave (Israel) 10400–10000 B.C. the analyses of the excavated white layer in the cave have shown limestone fragments surrounded by small rounded bodies of pure calcium carbonate which interpreted as the carbonated products of lime calcination (Kingery et al., 1988). However, the cave itself is a limestone (Mercier et al., 2007) and some results could interfere with the effect of the human fire activity on the natural stone (Dorn et al., 2012).
In case of skull plastering the studies show that every site applied its own technology which is directly connected to the local materials (Goren et al., 2001). For example in Jericho the main compostion of plaster was silicate and calcite, and for Beisamoun skulls the result show clay, burnt lime, ash, silt and opaque minerals (Goren et al., 2001).
20
During the Greek and later Roman period around the 1st millennium B.C., lime mortar starts to be
widely and commonly used (Blezard, 1998).
The Romans contributed to a great step in mortar production and they have very important references as the De Architectura, Book VII, written by Vitruvius, and the Naturalis Historia, Book V, written by Plinius. These important works, written as a guide for building projects, refer to the slaked lime as one of a great steps in mortar production (Rodriguez‐Navarro et al., 2000). The romans also succeeded to produce hydraulic lime (lime + pozzolana) for the underwater structure (Gilberto & Angelini, 2010).
21
2.2 DEFINTION
Mortar is a mix of binder, fine aggregates, water and other inorganic or organic materials. All these components are provided as powders and when mixed with water they form a fluid mass (paste) in a proportion that allows workability and can be shaped, molded, or attached to the surface of other materials when it’s fresh, and had a physical and mechanical feature when its dried at a normal environmental condition (Gilberto & Angelini, 2010).
Plaster is a pasty composition (as of lime or gypsum, water, and sand) that has been prepared for the specific use of providing a protective covering on the inner or outer surfaces of construction (Britannica, 2008).
Three types of plaster and mortar were used at the past: lime plaster, gypsum plaster, and mud (soil or silt mixed with water).
2.2.1 LIME PLASTER
The technological principle of lime plaster was very simple, it is based on burning the lime raw material at a specific temperature 800-900 °C then the heated raw material should be crushed to a fine powder to slake it later with water to form a paste.
CaCO3 (calcite) + heat CaO (quick lime) + CO2 [production of quicklime]
CaO (lime) + H2O Ca(OH)2 (slaked lime) + heat [quick hydration]
Ca(OH)2 + CO2 CaCO3 + H2O [long term carbonation]
Lime mortar technology keeps improving during time, to improve its durability and workability through the addition of several materials to the pasty (like volcanic ash, plant ash or even a crushed pottery or stone). The most important step was during the Roman period when they succeeded first to produce a slaked compound (Ca (OH2)) with a very fine grain size and little porosity using an ageing process
that is mentions by Vitruvius (De Architectura, Book VII), and Plinius (Naturalis Historia, Book V). This process includes the storing of the slaked lime under water for extended periods of time, which will improve the plasticity, workability, and water retention (Rodriguez‐Navarro et al., 2000).
22
Romans also succeeded and produced a hydraulic lime mortar (its dry both in the air and water) by firing the raw material on very high temperature 1300-1500 °C and adding a reactive material like “pozzolana” to the paste (Gilberto & Angelini, 2010).
CaO+ (Al2O3 or SiO2 or Fe2O3) n CaO (Al2 or Si or Fe2) On
At that time the Romans recognized the need to such mortar especially in the water related structure, but they couldn’t fully understand and recognized the properties/technology of hydraulic lime (Dorn et al., 2012).
2.2.2 GYPSUM PLASTER
The technological basis of gypsum plaster is very similar to that of lime plaster. It depends on heating the alabaster or gypsum rock (CaSO4. 2H2O) at a temperature in the range 150-400 °C to form the
hemihydrate (CaSO4. ½ H2O) which, when mixed with water, reacts to reform the dihydrate (CaSO4. 2H2O)
(Kingery & Prickett, 1988; Gilberto & Angelini, 2010).
CaSO4·2H2O (gypsum) + heat 130 °C CaSo4· ½ H2O (hemihydrate) + ½ H2O [production of plaster of
Paris]
CaSO4· ½ H2O + heat 183 °C CaSO4 (anhydrite) + ½ H2O [production of anhydrite]
CaSO4· ½ H2O + ½ H2O CaSO4·2H2O [quick hydration]
CaSO4 + 2H2O CaSO4·2H2O [slow hydration]
Maintaining the low temperature that is needed to prepare the gypsum mortar was one of the main difficulties in the gypsum preparing process. Moreover, the high solubility of gypsum plaster in water makes it more proper to be used for the interior architectural use. Those two reasons lead to a limitation on the use of gypsum plaster compared to lime plaster (Kingery et al., 1988; Philokyprou, 2012).
2.2.3 MUD PLASTER
The technology of mud plaster is one of the simplest and most ancient technologies. Reported from the 9th millennium B.C. at the Pre-Pottery Jericho Period, Palestine (Bar-Yosef, 1986). It consists of a
23
3. ARCHAEOLOGICAL SETTING
Arslantepe – Turkey, site in the tentative world heritage list since 2015, located in the Malatya plain (38 ° 22′55 ″ N 38 ° 21′40 ″ E), 5 km away from the city center and 15 km away from the Euphrates right bank (Figure 8) (UNESCO Centre, 2019). The site is an artificial settlement mound, approximately 30 m in height and 4 ha in size. The name of Arslantepe is derived from the lion (“Arslan” in Turkish) - statues excavated at the site.
Figure 8 Arslantepe a sttalite view (Googl map)
Arslantepe considered as the largest Syro-Mesopotamian site in Malatya plain and was always the dominant center in its region (Frangipane, 2013). The long period of excavation in the site showed the site was occupied from at least the fifth millennium B.C. to the Middle Age (Table 1) (Frangipane, 2012; Liberotti et al., 2016).
Table1Arslantepe chronology
date callebrating with
14 C dindrocnology Arslantepe period General chronolgy I Roman and Byzantine period
1100-700 BC.
II-III Iron age
1600-1200 BC.
IV Late Bronze age I
1750-1600 BC.
V B Late Bronze age II
2000-1750 BC.
V A Middle Bronze age
2500-2000 BC.
VI D Early Bronze age III
24
2750-2500 BC.
VI C Early Bronze age II
3000-2750 BC.
VI B2-B1 Early Bronze age I
3350-3000 BC.
VI A Late Calculithic 5 (Late Uruk)
3800-3350 BC. VII Late Calculithic 3-4 4250-3800 BC. VIII Late Calculithic 1-2
The most two important periods which were discovered in Arslantepe are represented by the Late Chalcolithic period, which covers the entire course of the 4th millennium B.C. and represents the
development of the early hierarchical centralized political and economic societies (Frangipane et al., 2017), and the Late Bronze-Iron Age (the 2nd and early 1st millennium B.C.), which was affected by the
eastward expansion of the Hittite state. Following the “collapse” of this central Anatolian empire, Arslantepe was the capital of a new autonomous political entity, the NeoHittite kingdom of Melid (Frangipane et al., 2017).
The site was first excavated by the French archaeologist Louis Delaporte from 1932-1939 A.D. The French mission investigated the upper part of the mound and exposed:
- remains of an Iron Age buildings, among which are the so-called Neo-Assyrian palace (end of eighth– beginning of seventh century B.C.)
- the well-known Lions Gate (ninth–eighth centuries B.C.), which was according to De laporte typical of the Neo-Hittite kingdoms art (Delaporte, 1939, 1940).
The world war II ended the work of De laporte mission. And later the French excavations continued from 1949 by C. Schaeferf until it came to end in 1951 without any important result.
Later, the first Italian excavations at the site of Arslantepe started in 1961 A.D. and were conducted under the direction of Professors Piero Meriggi and Salvatore M. Puglisi (Puglisi & Meriggi, 1964), and later by Puglisi alone. The work continued under by Alba Palmieri and later under Marcella Frangipane, to become one of the major archeological projects of Sapienza University of Rome.
The Italians started to investigate the northern part where the French mission was working before. They exposed a stratigraphic sequence of a number of building levels dating back to the first and second millennia B.C. Neo-Hittite (Iron Age), Imperial Hittite (Late Bronze II), and Early Hittite (Late Bronze I) Pe-riods and insubstantial Early Bronze layers with scanty architectural remains and a series of seven build-ing levels with domestic structures from the Late Chalcolithic built on virgin soil (Palmieri, 1978). The se-quence ends with the remains of roman occupation (Equini Schneider, 1970).
25
In the last thirty-five years -from Sapienza mission which was carried out for more than fifty years (Frangipane, 2011; ARSLANTEPE, 2019)- the research started to be focused on the prehistoric and proto-historic levels of Arslantepe. They investigated the west and the south west zone of the mound
And a long and detailed sequence from the end of the fifth to the beginning of the second millen-nium B.C. (Late Chalcolithic, Early Bronze, and Middle Bronze age) levels has been brought to light (Fran-gipane, 1993; Palmieri et al., 1973; Palmieri, 1981).
Later the work in the northern part resumed again in 2008 by using the modern research methodol-ogies in order to investigate the late history of the site, between the Hittite “conquest” of the region, the subsequent dismantling of the imperial system, and the formation of the Neo- Hittite kingdom of Malatya (Figure 9) (Liverani, 2009).
26
3.1 ARSLANTEPE DURING THE 4
thMILLENNIUM B.C.
This research will mainly focus on the 4th millennium B.C. one of the most important periods in Arslantepe as it represents the early hierarchical centralized political and economic societies (Frangipane et al., 2017). It is divided into several periods: Late Chalcolithic 3-4 (3800-3400 B.C.) or period VII, and Late Chalcolithic 5 (3350- 3100 B.C.), period VI A. Several monumental buildings with tripartite plan belong to this period and were discovered in Arslantepe (Frangipane, 2013; Frangipane et al., 2017).
Many studies suggested the effect of the Mesopotamian culture on Arslantepe during the 4th millennium B.C. especially in the terms of architectural, structural, and systemic organization (Frangipane, 2013).
In this period Arslantepe retained its marked autonomy, followed its own specific, and different, development pattern, which was less well entrenched than those of the highly urbanized environments and probably had a major role as an intermediary center in the vast network of interregional relations involving the Syro-Mesopotamian communities and those living in the mountain areas of central-eastern and northeastern Anatolia (Frangipane, 2009).
3.1.1 LATE CALCOLITHIC 3-4 (3800-3400 B.C.) PERIOD VII
In this period the excavation shows a huge extending in the site which is almost covered the hill area of the hill, and a new architectural element discovered in the north-eastern part of the site which was not previously occupied before (Frangipane,2013). This could give an indication of increase and flourish in the size of population during this period.
A sharp social and symbolic differentiation between the areas occupied is also attested, with monumental élite buildings located on the top of the ancient mound, and common houses on the slopes and on the margins of the settlement, which may indicate to the earliest hierarchical society in Arslantepe (Frangipane,2013).
The effect of the Mesopotamian culture on Arslantepe was very clear during this period especially in the terms of architectural, structural, and systemic organization, but at the same time it had its own cultural character which was somehow different from the Mesopotamian culture (Frangipane, 2013).
Several buildings were discovered and belong to this period.
Frangipane also thinks that the paintings in the elite building during this period were part of a well-rooted tradition in the Upper Euphrates area that begging at least on the late Ubaid period (Frangipane, 2011).
27
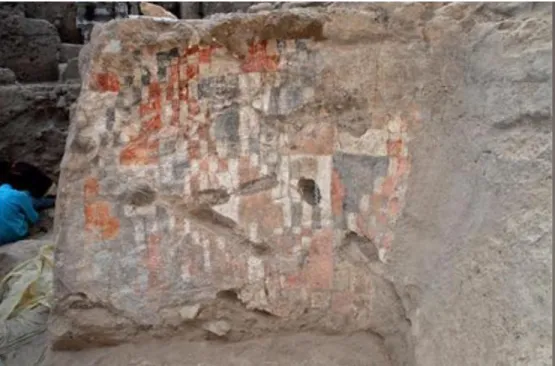
- common small mud brick houses on northeastern edge of the mount consist one to three rooms, in one case with a geometric painting on a house wall that featured alternating black and white triangles (Palmieri, 1978).
- élites residences on the higher part of the western area of the mound with mudbrick walls over 1–1.20 m thick, covered with white plaster and paintings on the walls and four “white-plastered” mudbrick columns lining the walls excavated in the higher part of the western area of the mound (Frangipane, 1993).
- Another élite monumental building with columns (Figure 10) on the higher part of the western area of the mound which was transformed during the time from a large reception hall with “white plastered” columns and paintings on the walls into four smaller rooms used for different purposes (Frangipane, 2013).
Figure 10 Arslantepe, period VII. The so-called “column building” viewed from the north (Frangipane, 2013)
- A monumental ceremonial building (Temple C) with a tripartite plane and multiple recessed niches decorating the short sides of the central room (Figure 11). was excavated near the western edge of the mound. The building was isolated and built on a low platform made of huge stone slabs and mud layers (Frangipane, 2002, 2003). The building was the only one with a tripartite plan, which is similar to the Mesopotamian architecture. The building also had some local features
28
such as some wall paintings and a particular construction technique using wooden beams laid horizontally under the floor (Frangipane, 2011)
Figure 11 Arslantepe, period VII. Temple C. a.Plan of Temple C and its reconstructed layout; b.The niched north-eastern corner of the large central hall A900; c. Mass-produced bowls scattered on the floor of the central hall A900; d. Bowls piled up in the side room A932 (Frangipane, 2013).
29
3.1.2
LATE CHALCOLITHIC 5 / LATE URUK (3350- 3100 B.C.) PERIOD VI A
In this period the Economic and political centralization reached its climax and a shape of a state organization starts to appear in the society, the archeological evidence also start to show more clear distinguish of the elite and there activity, and the separation between there private”/religious and there “public”/economic start to appear in the building functionality (Frangipane, 2013).
And a process of something which is similar to the “secularization” of power started to appear in the society of Arslantepe, more rapidly in comparison with the other Mesopotamian regions (Frangipane, 2013).
Arslantepe also started to play a major role as an intermediary center in the vast network of interregional relations involving the Syro-Mesopotamian communities and those living in the mountain areas of central-eastern and northeastern Anatolia (Rothman, 2004)
On the other hand, the settlement starts to be smaller during this period in comparison with period VII (Frangipane, 2013). And the wall paintings start to be figurative motifs which represent a symbolic element with an actual sense (Figure 12) (Frangipane, 2011).
Figure 12 Arslantepe, period VI A (LC5). Wall paintings in the palatial complex (Frangipane, 2012)
Several buildings were discovered and belong to this period of Arslantepe:
- A palatial complex (a palace) in the southern slope of the mound which consists of a complex of several buildings that involve different religious, economic, political and administrative activates, those buildings were involved:
30
- Two monumental mudbrick buildings along the southwestern slope of the mound, standing on several terraces and linked by corridors and courtyards, where various public functions (religious/ceremonial, administrative, storage, reception), were excavated: temple A, and temple B (Figure 13) (Frangipane, 1997, 2010).
Figure 13 Arslantepe. Temple B and the eastern sectors of the palace complex viewed from the north (Frangipane, 2013).
These two buildings represent the appearance of an architectural complex, and the earliest known example of a public “palace-like” aggregation (Frangipane, 2011).
Wall paintings with figurative motifs were discovered on the sides of doors and along the main corridor, those wall painting represent an ideologically important and highly meaningful messages to everyone entering the palace (Frangipane, 2011).
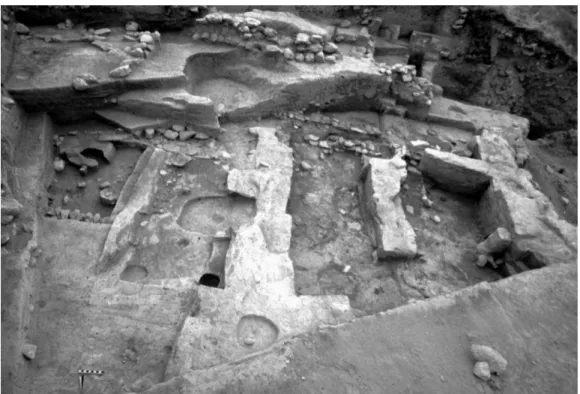
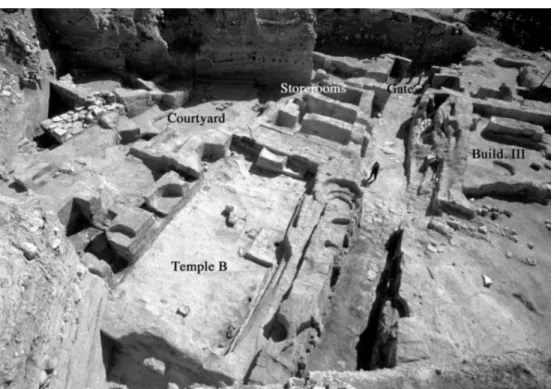
- A group of rooms – that due to archeological finds were probably used for storage and administrative purpose- (Figure 14) were located in the lower and southern area of the monumental complex (Frangipane,2013).
31
Figure 14 Arslantepe. Storeroom complex (Frangipane, 2013).
an arsenical copper door socket was also found at the corner of a monumental entrance to another building (Frangipane 2011; 2013)
32
3.2. ARSLANTEPE BULDING MATERIAL AND CONSTRUCTION TECHNIQUE
DURING THE 4
thMILLENNIUM B.C.
Several studies were done in order to understand better Arslantepe earthen architecture (mud-brick houses (Palmieri, 1978), élites residence (Frangipane, 1993), monumental ceremonial buildings Frangipane, 1997, 2002, 2003, 2010)) material and techniques during the 4th millennium B.C. (period VII,
period VI A).
According to Liberotti, & Quaresima (2010) the adobe (mud-brick) sample that’s belong to the fourth millennium B.C. have an XRD composition characterized by the presence of calcite, quartz, dolomite, anorthoclase, plagioclase, ankerite, halite, magnesio-riebeckite, palygorskite, smectite, chlorite, illite, kaolinite, mixed layers illite/smectite similar to the surrounding calcareous soil which may give indicator to a local origin of the building material (Liberotti & Quaresima, 2010).
Another microscopic study has suggested that the addition of a natural fiber was a common practice during the 4th millennium B.C. in order to increase the strength and performance of the adobe, and to
decrease the water amount in the paste (Alvaro, et al., 2011).
The plaster analyses from the palatial complex walls which belongs to the 4th millennium B.C period
VI A . show a similar composition with adobe used in the building but with extra calcite composition in order to give the white color of the plaster (Liberotti & Quaresima, 2010).
The natural fiber was also added to the plaster with more concentration in comparison with the ones that was added to the adobe, in order to increase the workability of the plaster (Liberotti & Quaresima, 2010).
In case of Arslantepe building technique, two or more rows of adobe elements were laid in order to compose a masonry with higher thickness. In some cases, this masonry was built on a foundation of unshaped stones and covered with a layer of white plaster which sometimes had a painting or geometric decoration (Frangipane, 2013 ; Liberotti & Quaresima, 2010). The buildings were sealed with a layer of large woody beam that supports other layer of smaller stick above of them which is covered with a final clay coating layer (Alvaro et al., 2010).
A previous macroscopic analysis of some plaster layer that belongs to the VI A period from the 4th
millennium B.C. was done in order to understand the plastering practice and techniques, the result summarized by (Liberotti & Quaresima, 2010):
33
- A lower layer of mostly clay mixed with fragments of vegetable fibers and charcoal particles adhering to the adobe (mud-brick) substrate.
- A middle layer of rounded edges particles of sand. - A final layer made of purified clay.
Some hypotheses suggest three types of ceiling system in Arslantepe (Alvaro et al., 2010): - flat roofs without central pole (which was used during the 4th millennium B.C.).
- flat roofs with central pole. - sloping roofs with central pole.
34
4.
GEOGRAPHICAL AND GEOLOGICAL SETTING
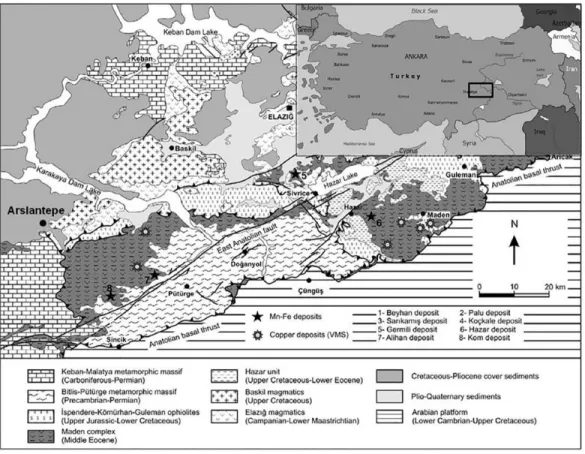
Arslantepe is located in the Malatya plain (southeastern Turkey), at 6 km north of Malatya city and 15 km south-west of the River Euphrates .
To the north-west of Malatya, a mountainous area made of marbled limestone and basalt is present. To the south and south-west Palaeozoic soils forms the Malatya dağlari with marbled limestone, gneissic rocks, schists and volcanic rocks. At south of Malatya, limestone and clay outcrop as well as at east with Cretaceous deposits made of white limestones and clay. Arslantepe site is set on clays embedded with sandstone with micritic cement (Figure 15) (Liberotti et al., 2016).
To the north and east of Arslantepe, the Upper Miocene deposit is characterized by conglomerates and the Gelincik Tepe with volcanic rocks (trachites and andesites) occurs. At the western side of this deposit a layer of clay by the alteration of volcanic rocks is still used in the bricks production. To the south-east of Arslantepe Eocenic limestones also outcrops (Alvaro et al., 2011; Fragnoli, 2018; Liberotti et al., 2016). Arslantepe rests on lake soils, formed by calcareous clays, sand layers and calcareous cement (Liberotti & Quaresima, 2010).
Figure15 Regional geological map of the Malatya-Elazığ region, showing the location of the site Arslantepe (slightly modified from Turkish Geology Map of MTA 2002, 1:500,000 scale) (Fragnoli, 2018).
35
5. RESEARCH PURPOSE
This research will mainly focus on the analytical study of plaster belong to the late chalcolithic period 4th millennium B.C. Period VII in Arslantepe – Turkey, in order to:
- Determine the main character, composition, and origin (local or imported) of the material that is used in the plaster paste.
- Contextualizing the results in a general evaluation of building practices, materials and all the related processes, as maintenance, or refurbishment, which probably took place in the past.
The following central research questions will be asked: - What type of plaster they used?
- Is there's any difference between the plastering technique and mixture between the difference studied buildings?
- Was plaster preparation a professional work with a specific recipe? - Did they perform any maintenance work on the plaster?
- If it’s possible to identify, what is the source of the raw material?
The significance of this research come from the need to continue the previous researchers work, and to have a comparative analysis for the composition of the plaster that is came from a different type of buildings belongs to the 4th millennium B.C. period VII. The outcomes of this inquiry will contribute in a
better understanding for Arslantepe plastering material and practice, and later further study could be done on more plastered buildings from Arslantepe in order to have a wider vision for the plastering practice during the 4th millennium.
36
6. MATERIALS AND METHODS
In modern time, mortar and plaster studies provide useful information about the ancient building techniques, the raw materials employed in the recipe, and the source where the materials came from (Leoni et al., 2000; Philokyprou, 2012).
In this research a multi-analytical approach is applied including optical microscopy in thin section (OM), X-ray Powder Diffraction (XRPD), and Scanning Electron Microscopy Coupled with Energy Dispersive Spectrometric Analysis (SEM-EDS) to identify mortar and plaster samples from A900, A950 (Temple C), and from A1469, A1489 (two different Elite residence), which belong to the late chalcolithic 4th millennium
B.C.
6.1
MATERIALS
Five samples of plaster and mortar were studied from Arslantepe (Table 2); all the samples belong to period VII, Late Chalcolithic 3-4 (3800-3400 B.C.).
Table 2 List of samples. Identification, collocation, chronology, reference building
Sample Sample
nature
Trench Location Absolute chronology Site sequence Typology of building A900 RM3 VII 2011 / 1135 Stone South-west
A900 3800-3400 B.C Period VII Temple C
A900 M2 VII 2007/102
Plaster South-west
A900 3800-3400 B.C Period VII Temple C
A950 M1 VII 2017 plaster, and mortar South-west
A950 3800-3400 B.C Period VII Temple C
D7(3) A1469
M3 VII 2018/257
Plaster South-west
A1469 3800-3400 B.C Period VII Elite residence
D6(12) A1489
13a VII
2018/108
Plaster South-west
37
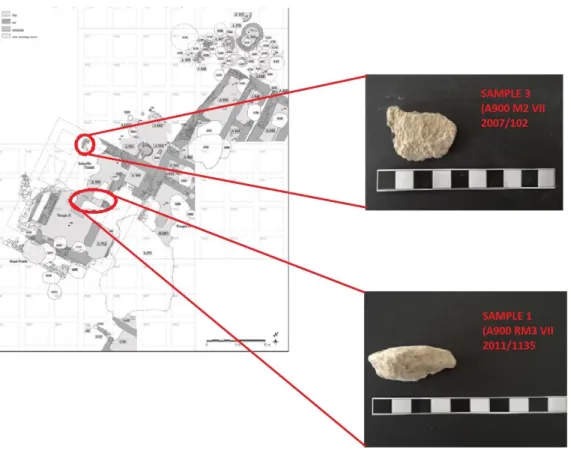
Sample A900 RM3 VII 2011 / 1135 (Figure 16) is one of a large group of stones, unearthed together at the base of the southern wall of Temple C (excavated in 2011 in the temple C. The stone is hard and with a white homogeneous color.
Sample A900 M2 VII 2007/102 (Figure 16) was samples by eastern wall (excavated 2007), a white layer of plaster of the eastern wall of the central room of Temple C.
Both sample A900 RM3 VII 2011 / 1135 and sample A900 M2 VII 2007/102 come from A900, a central room of a large tripartite ceremonial building called “Temple C”.
Figure 16 Sample A900 RM3 VII 2011 / 1135, sample A900 M2 VII 2007/102 come from a central room of a large tripartite ceremonial building called “Temple C”
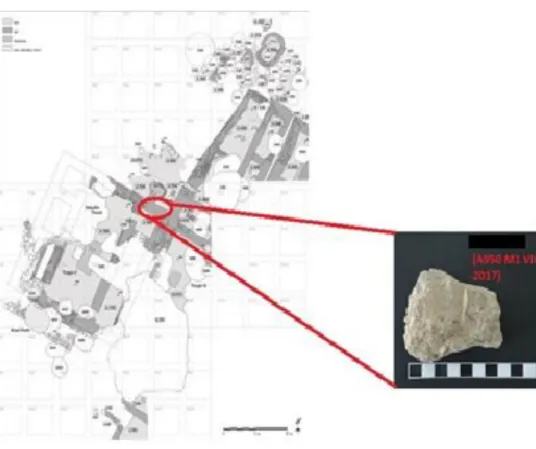
Sample A950 M1 VII 2017 (Figure 17) was sampled by the northern wall (excavated 2017) of A950, the lateral small storing room on the north eastern side of Temple C. The sample is characterized by the presence of the mortar with a piece of brick and the layer of plaster with a thickness of 2mm (Figure 18).
38
Figure 17 Sample A950 M1 VII 2017 came from A950, the lateral small storing room on the north eastern side of Temple C.
39
Sample D7(3) A1469 M3 VII 2018/257 (Figure 19) was sampled by the southern wall (partially excavated 2018), of A1469 probably a rectangular elite residence. This sample is characterised by a multiple layer of white plaster with red painting.
Figure 19 Sample D7(3) A1469 M3 VII 2018/257 come from A1469 probably a rectangular elite residence.
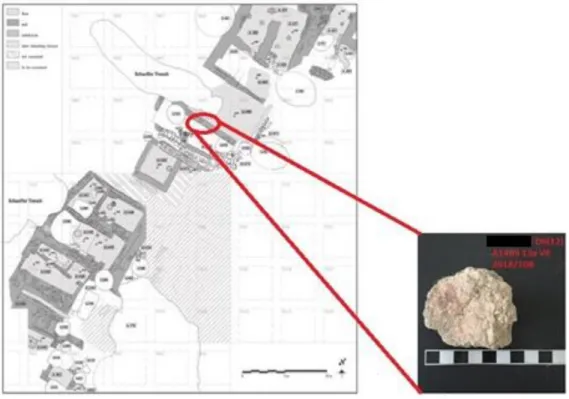
Sample D6(12) A1489 13a VII 2018/108 (Figure 20) was sampled by northern wall (partially excavated 2018), of A1489 probably a rectangular elite residence. A white layer plaster with red painting is observed.
40
41
6.2 METHODS
6.2.1 OPTICAL MICROSCOPY IN THIN SECTION (OM)
One of the major tools that is used to study the prehistoric lime mortar and plaster is optical microscopy in thin section. Zeiss D-7082 Oberkochen polarized optical microscope (Department of Earth Sciences, Sapienza University, Rome, Italy). used to determine the mineralogy and the fabric of the thin section, at a various scale, ranging of magnification 2.5 * / 0.075 (8 mm diameter) – 10* / 0.30 (2.4 mm diameter) – 20* / 0.50 (1.2 mm diameter).
The parameters considered are: - the binder: type, and appearance;
-aggregate: nature, origin, composition, ratio, shape and dimension; -lime inclusions
6.2.2 X-RAY POWDER DIFFRACTION (XRPD)
One of most effective analytical technique used to identify the mineralogical composition of mortars is XRD analysis. A small fragment of each plaster sample has been chosen. About 150-200 mg. were gently hand crushed in an agate mortar (Figure 21) (particle size < 20 µm). A Siemens D5000 diffractometer (Department of Earth Sciences, Sapienza University of Rome, Italy) with CuKa radiation, 40 kV and 30 mA, in the range of 3°–60° 2h, at a speed of 1°/min and 2 s/step, 1° diverging slide, slide receiver of 0.1 mm and sled anti-scatter of 2°.
42
6.2.3 SCANNING ELECTRON MICROSCOPY COUPLED WITH ENERGY DISPERSIVE
SPECTROMETRIC
ANALYSIS
This analytical method allows having a will defined image with an excellent resolution and a great magnification up to 100,000 x and coupled with energy dispersive spectrometric analysis is possible to determine the elemental information of the samples including semi-quantitative analysis, line profiling and spatial distribution of elements. Thin sections of samples were metalized with graphite and SEM investigations were carried out using an electron microscope FEI Quanta 400 (Department of Earth Sciences, Sapienza University of Rome, Italy), operating at 20 kV, coupled with X-ray energy dispersive spectroscopy system (EDS) (Figure 22) to acquire qualitative chemical composition and morphology of binder and aggregate.
43
7. RESULTS
7.1. OPTICAL MICROSCOPY IN THIN SECTION (OM)
The mineralogical and petrographic features mostly the plaster fabric texture and structure as well as the type, percentage, ratio grain size and distribution of the added aggregate and inclusions were determined by OM analysis. For this we determine her the microscopic feature of five samples -one of them had been cutted in two different way (stratigraphy, and horizontal) thin section.
Sample A900 RM3 VII 2011 / 1135
The analysis by OM (Figure 23) is compatible with the structure of a carbonate rock fragment probably a limestone characterized by a micritic texture which appears in dark gray color with a very fine crystals that it’s hard to be identified individual under the microscope.
Figure 23 XP AND PPL thin section showing the texture and the structure of sample A900 RM3 VII 2011/1135, with a magnification rang 10* / 0.30 (2.4 mm diameter)
Sample A900 M2 VII 2007/102
The analyses by OM show a piece of air hardening calcic lime binder with a homogenous structure and micritic texture.
44
The small percentage of the aggregate is reflected in the binder/aggregate ratio less than 1/3. The aggregates are mainly represented by quartz and less calcite with a shape between sub-angular and angular.
Irregular fine fissuring in the binder appears with a diameter range between 0.5 * 0.5 mm - 2.00 * 0.5 mm –. Sometimes, secondary calcite is detected into the pores (Figure 24).
Figure 24 XP AND PPL thin section showing the texture, the structure and fissuring of sample A900 M2 VII 2007/102 with a magnification rang 2.5 * / 0.075 (8 mm diameter).
Sample A950 M1 VII 2017
The image under the OM show a piece of air hardening calcic lime binder with a heterogeneous structure and a micritic texture that is appears with grey colour (Figure 25). Between angular to sub-rounded aggregate of a calcite, quartz, plagioclase, clinopyroxene, and some fine inclusion of siliceous sedimentary rock appears also with a ratio less than 1/3.
Figure 25 XP AND PPL thin section showing the texture, the structure and aggregate of sample A950 M1 VII 2017. with a magnification rang 2.5 * / 0.075 (8 mm diameter).
45
Remains of under burnt limestone inclusion with a sub-rounded to rounded shape and diameter range between 0.5* 0.5 mm - 2.0*2.0 mm –are also identified (Figure 26).
Figure26 XP AND PPL thin section showing Remains of under burnt lime stone inclusion (Lumps) in sample A950 M1 VII 2017. with a magnification rang 10* / 0.30 (2.4 mm diameter)
Charcoal pieces were also detected in the sample and shown in Figure 27.
Figure 27 XP AND PPL thin section showing Remains of one of the charcoal pieces in sample A950 M1 VII 2017. with a magnification rang 10* / 0.30 (2.4 mm diameter)
Irregular pores are detected in the sample with a diameter range between 0.5 – 0.5 mm - 7.0 * 2.00 mm (Figure 28). Re-crystallized calcite as secondary decay product appeared also in the pores.
46
Figure28 XP AND PPL thin section showing the whit calcite re-crystallization inside the fissuring and the pores of sample A950 M1 VII 2017. with a magnification rang 2.5 * / 0.075 (8 mm diameter).
Sample D7(3) A1469 M3 VII 2018/257 – stratigraphic section
Several layers of an air hardening calcic lime binder with micritic texture and homogenous structure appears under the OM. The stratigraphy is very clear in this sample; indeed, it is possible to observe four different plaster layers with a thickness 1.44, 1.79, 1.45, 1.03 mm respectively from layer one (at the contact of the wall) to four (surface) (Figure 29).
Figure 29 XP stratigraphic thin section of sample D7(3) A1469 M3 VII 2018/257 showing four plaster layer with a thickness 1.44, 1.79, 1.45, 1.03 mm. in a magnification range 2.5 * / 0.075 (8 mm diameter).
Remains of sub- rounded to rounded under burnt limestone with a diameter range between 0.5* 0.5 mm - 1.0 * 1.2 mm are also identified.
Sub-angular to rounded quartz and calcite crystals seem to be oriented to the surface, and a charcoal piece is also detected in the sample. The binder/aggregate ratio is estimated less than 1/3.
47
The first layer has the biggest amount of quarts aggregate in compares with the other layers and according to Liberotti & Quaresima (2010) description of the plastering techniques in Arslantepe, this layer seems to represent the middle layer of a rounded edges sand (quartz) particles that is attached to plaster. This mortar also has a fissuring in the binder, irregular pores (Figure 30) with a diameter range between 0.5 – 0.5 mm – 4.0 * 1.0 mm, irregularly distributed in the sample. Secondary calcite deposit is also detected into the pores.
Figure30 XP AND PPL thin section showing the whit calcite re-crystallization inside the fissuring in sample D7(3) A1469 M3 VII 2018/257. with a magnification rang 10* / 0.30 (2.4 mm diameter)
Sample D7(3) A1469 M3 VII 2018/257 – horizontal section
This thin section was created including only the plaster layer of sample D7(3) A1469 M3 VII 2018/257 which is already a piece of air hardening calcic lime binder with a micritic texture and a homogenous structure.
a small percentage of sub-angular to angular quartz and less calcite in a ratio less than 1/3, with more concentration in the painting layer.
This plaster also has a fissuring in the binder, irregular pores with a diameter range between 0.5 * 0.5 mm - 1.00 * 4.0 mm, irregularly distributed into the sample. Sometimes, secondary calcite is detected into the pores (Figure 31).
48
Figure 31 XP AND PPL horizontal thin section showing the texture, the structure of sample D7(3) A1469 M3 VII 2018/257. in a magnification range 2.5 * / 0.075 (8 mm diameter).
Sample D6(12) A1489 13a VII 2018/108
The OM images show a piece of air hardening calcic lime binder with a micritic texture and a heterogeneous structure.
Remains of sub-rounded to rounded under burnt limestone with a diameter range between 0.5 mm - 1.0 * 2.0 mm are also identified.
A heterogenous structure is observed with the aggregate characterized by the presence of sub-angular to sub-rounded quartz and calcite crystals and a binder/aggregate ratio less than 1/3 ratio in total. in the first layer. On the contrary, more homogenous structure with quartz, calcite and clinopyroxene crystals was observed in the surface layer. A charcoal piece was also detected in the sample.
Due to the difference in the aggregate type, size, structure and concentration in two different parts of the sample, it’s clear that this sample had an upper plaster layer with 1.3 mm thickness attached to the substrate main plaster layer (Figure 32).
49
Figure 32 XP thin section of sample D6(12) A1489 13a VII 2018/108 show structure and texture of two layer of plaster. In a magnification rang 2.5 * / 0.075 (8 mm diameter).
This mortar also has a fissuring in the binder, irregular pores with a diameter range between 0.5 * 0.5 mm - 3,0 * 1.0 mm , irregularly distributed into the sample. Sometimes, secondary calcite is detected into the pores (Figure 33).
Figure 33 XP AND PPL thin section showing the whit calcite re-crystallization inside the fissuring and the pores of sample D6(12) A1489 13a VII 2018/108. In a magnification rang 10* / 0.30 (2.4 mm diameter).
50
7.2. X-RAY POWDER DIFFRACTION (XRPD)
XRPD provided quantitative and qualitative mineralogical analyses of the plaster.
Sample A900 RM3 VII 2011 / 1135
Figure34 Sample A900 RM3 VII 2011/1135 XRD diffractogram
The XRPD results (Figure 34) show that sample A900 RM3 VII 2011/1135 is only composed of calcite
Sample A900 M2 VII 2007/102
Figure 35 Sample A900 M2 VII 2007/102 XRD diffractogram
The XRPD results (Figure 35) show that sample A900 M2 VII 2007/102 is composed by very abundant calcite, common clay minerals (illite-montmorillonite), and traces of quartz and dolomite.
51
Figure 36 Sample A950 M1 VII 2017 XRD diffractogram
XRPD results (Figure36) show that sample A950 M1 VII 2017 is characterized by very abundant calcite; quartz and clay minerals are present, whereas plagioclase, and clinopyroxene are in traces.
Sample D7(3) A1469 M3 VII 2018/257
Figure 37 Sample D7(3) A1469 M3 VII 2018/257 XRD diffractogram
The XRPD result (Figure 37) shows that sample D7(3) A1469 M3 VII 2018/257 is represented by very abundant calcite, common quartz. and a scare of clinopyroxene and some clay minerals.
52
Sample D6(12) A1489 13a VII 2018/108
Figure 38 Sample D6(12) A1489 13a VII 2018/108 XRD diffractogram
The XRPD result (Figure 38) shows that sample D6(12) A1489 13a VII 2018/108 is mainly characterized by very abundant calcite, clay minerals, scarce quartz, and dolomite.
XRPD results reported in Table 3 showed that sample A900 RM3 VII 2011/1135 is only composed of calcite. Sample A950 M1 VII 2017, sample A900 M2 VII 2007/102, sample D7(3) A1469 M3 VII 2018/257, and sample D6(12) 13a VII 2018/108 show the presence of calcite, quartz, and clay minerals (illite – montmorillonite) in different proportions. In addition to the main minerals, sample A950 M1 VII 2017 had also plagioclase and clinopyroxene; sample A900 M2 VII 2007/102 and sample D6(12) 13a VII 2018/108 show dolomite and finally sample D7(3) A1469 M3 VII 2018/257 clinopyroxene.
Table 3 XRD result (++++ very abundant 70-50%; +++ abundant 50-30%; ++ present 30-15%; + scarce 15-5%; tr. Traces <5%)
Sample Qtz Cal Pl Ill-Mnt Dol Clpx
A900 RM3 VII 2011/1135 ++++
A900 M2 VII 2007/102 tr ++++ ++ tr
A950 M1 VII 2017 ++ ++++ Tr ++ tr
D7(3) A1469 M3 VII 2018/257 ++ ++++ + +
53
7.3. SCANNING ELECTRON MICROSCOPY COUPLED WITH ENERGY DISPERSIVE
SPECTROMETRIC ANALYSIS
A900 RM3 VII 2011/1135
Figure 39 sample A9OO RM3 VII 2011/1135 backscattering image by SEM-EDS on the right, OM XP image in the left
A9OO RM3 VII 2011/1135 is identified as a piece of limestone by OM. Moreover, we analyse it by SEM-EDS to define the chemical composition. From the EDS spectrum (Figure 40) we observe the pres-ence of Ca as the main element and the table in Figure 40 shows a semi-quantitative analysis in which calcium oxide (CaO) is estimated about 93.32%; some traces of SiO2 2.58%, MgO 1.60%, Al2O3 1.11%, P2O5 80%, NaO2 0.59% are also detected.
Figure 40 sample A9OO RM3 VII 2011/1135 SEM-EDS chemical composition spectrum and table
A900 M2 VII 2007/102
From the SEM-EDS spectrum in (Figure 41) the binder in sample A900 M2 VII 2007/102 (Figure 42) is mainly calcium carbonate (CaO2).
54
Figure 41 A900 M2 VII 2007/102 backscattering SEM-EDS binder image on the right, OM XP image on the left
55
SEM-EDS analysis allow confirming the presence of some minerals and rock fragments as aggregate (Figure 43): quartz (point A), calcite (point E), calcareous inclusion (point B, C, D) dolomite (point F) (Fig-ure 44).
56
Figure 44 dolomite SEM - EDS backscattering image and spectrum.
A950 M1 VII 2017
SEM-EDS analysis are focus on the chemical characterization of the aggregate (Figure XXX): the re-sults confirm the OM rere-sults highlighting the presence of quartz crystals (point B), dolomite (point D), iron oxide (point C) lime lump (point A), K-feldspar “probably anorthoclase” (point G).
Figure 45 sample A950 M1 VII 2017 aggregate SEM-EDS backscattering image on the top, chemical composition spectrums, OM XP image on the right.
57
We also confirm one of the of charcoal pieces that is identify by (OM) (Figure 46)
Figure 46 sample A950 M1 VII 2017 charcoal piece SEM-EDS backscattering image on the right, OM XP image on the left
A fragment of shell (Figure 47) and other type of fossils (Figure 48) has been also identified.
58
Figure 48 sample A950 M1 VII 2017 fossil SEM-EDS backscattering image
Confiming the OM result, a fraggment of siliceous rock is detected also (Figure 49)
Figure 49 sample A950 M1 VII 2017 siliceous rock fragment SEM-EDS backscattering image on the top, chemical composition spectrum, and OM XP image on the bottom.
59
Figure 50 sample A950 M1 VII 2017 secondary calcite product SEM-EDS backscattering image on the top, chemical composition spectrum. OM XP image on the bottom
D7(3) A1469 M3 VII 2018/257
SEM-EDS analysis allows us to compare the chemical composition of the different layers identified by OM (Figure 51). All the layers are composed mainly from Ca, Si, Mg, Al, P and Na in different percent-age (Figure 51).
60
Figure 51 four layers sample D7(3) A1469 M3 VII 2018/257 SEM-EDS backscattering image on the top showing 1.44,1.79,1.45, 1 .03 mm layers thickness, chemical composition spectrums. OM image on the bottom
Thus, no differences in chemical composition between the superficial and the substrate part of layer 1 (Figure 52) are observed.
61
Figure52 superficial and the substrate part of layer 1 sample D7(3) A1469 M3 VII 2018/257 SEM-EDS chemical composition spectrums
The inclusions detected in the coloured part of layer 4 are mainly calcite, quartz, and feldspar. The colour is due to the presence of iron oxides (i.e., hematite) from the raw material (Figure 53).
Figure 53 inclusion from the colored part on the upper layer sample D7(3) A1469 M3 VII 2018/257 SEM-EDS backscattering image on the right, OMXP image on the lift
It was complicated to identify the colored part of the other layers because of their thickness. How-ever, the chemical composition of colour agent and of the inclusions is similar for all the layers.
62
D6(12) A1489 13a VII 2018/108
The two layers of plaster identified by OM have been also investigated by the SEM-EDS. In particu-lar, the analysis allows us to measure the thickness of the superficial layer 1 and to compare their chemi-cal composition. Indeed, the EDS spectra (Figure 54) show that the two layers have the same chemichemi-cal com-position in different concentration. In addition, Quartz, calcite and calcareous inclusion have been detect-ed as aggregated in both layers (Figure 54).
Figure 54 D6(12) A1489 13a VII 2018/108 two layer of plaster SEM-EDS backscattering image on the top showing 1.30 mm thickness of the surface layer, chemical composition spectrum for the surface layer on the top and for the substrate layer on the bottom, OM XP image on the bottom.
63
In addition, a fragment of bone has been found as an aggregate which could be already in the soil that has been used as a source of the raw material (Figure 55).
Figure 55 fragment of bone sample D6(12) A1489 13a VII 2018/108 SEM-EDS backscattering image and chemical composition spectrum