”Intelligence is a very valuable thing, innit, my friend? And usually it comes far too late.”
— Alfie Solomons (Peaky Blinders)
Universidade de Aveiro Departamento deEletr´onica, Telecomunica¸c˜oes e Inform´atica 2018
Jo˜
ao Renato
Figueiredo Brito
Solu¸
c˜
ao de Business Intelligence para a ´
Area
Econ´
omica e Financeira
Business Intelligence Solution for the Economic and
Financial Area
Universidade de Aveiro Departamento deEletr´onica, Telecomunica¸c˜oes e Inform´atica 2018
Jo˜
ao Renato
Figueiredo Brito
Solu¸
c˜
ao de Business Intelligence para a ´
Area
Econ´
omica e Financeira
Business Intelligence Solution for the Economic and
Financial Area
Disserta¸c˜ao apresentada `a Universidade de Aveiro para cumprimento dos requisitos necess´arios `a obten¸c˜ao do grau de Mestre em Engenharia de Computadores e Telem´atica, realizada sob a orienta¸c˜ao cient´ıfica do Doutor H´elder Troca Zagalo, Professor Auxiliar do Departamento de Electr´onica, Telecomunica¸c˜oes e Inform´atica da Universidade de Aveiro
o j´uri / the jury
presidente / president Prof. Dr. Joaquim Jo˜ao Estrela Ribeiro Silvestre Madeira
Professor Auxiliar da Universidade de Aveiro
vogais / examiners committee Prof. Dra. Mariana Curado Malta
Professora Adjunta do Instituto Superior de Contabilidade e Administra¸c˜ao do Porto (Arguente)
Prof. Dr. H´elder Troca Zagalo
agradecimentos / acknowledgements
I would like to thank my family for all their support, specially to my parents for giving me this opportunity and without whom this dissertation would certainly not be a reality. My appreciation to all my friends who stood with me from the begining of this journey all the way to its end, that a bright future awaits us all.
Palavras Chave Business Intelligence, Data Warehouse, ETL, ERP
Resumo Quando usada correctamente, a ferramenta mais poderosa que uma empresa tem ao seu dispor para compreender o seu neg´ocio s˜ao os dados gerados pelo pr´oprio neg´ocio.
Actualmente todas as m´edias e grandes empresas usam um sistema de Enterprise Resource Planning (ERP) que junta informa¸c˜ao sobre o estado de todas as diferentes divis˜oes da empresa e armazena essa informa¸c˜ao, disponibilizando-a para ser depois usada por todos os departamentos da empresa. Os dados armazenados s˜ao muito valiosos para uma empresa, e devidamente analisados podem ajudar as empresas a tomar melhores ac¸c˜oes de neg´ocio. As solu¸c˜oes actuais de Business Intelligence s˜ao ´optimas ao analisar dados de uma ´unica fonte, mas n˜ao foram pensadas para anal-isar dados de fontes diferentes. O objectivo desta disserta¸c˜ao ´e criar uma solu¸c˜ao de Business Intelligence, com foco na ´area econ´omico-financeira, capaz de extrair dados de diferentes ERPs que existem actualmente e ar-mazenar esses dados numa Data Warehouse, disponibilizando-os para serem mais tarde processados e analisados. Este projecto foi proposto por uma empresa portuguesa, Satbyte, sendo realizado em ambiente empresarial em colabora¸c˜ao com a mesma por forma a desenvolver um novo produto que possa ser comercializado pela empresa.
Este documento apresenta a solu¸c˜ao proposta para o problema e a imple-menta¸c˜ao da mesma. Esta consistiu na constru¸c˜ao de uma Data Warehouse para guardar os dados de forma integrada, proveninentes de diversos ERPs e o desenvolvimento, em ambiente web, de diversos casos de uso do ˆambito da an´alise financeira e econ´omica empresarial. A solu¸c˜ao desenvolvida provou ser eficaz para o prop´osito inicialmente formulado e foi validada pela em-presa como a pe¸ca crucial para a continua¸c˜ao do desenvolvimento da solu¸c˜ao de Business Intelligence alargada na qual pretendem continuar a investir.
Keywords Business Intelligence, Data Warehouse, ETL, ERP
Abstract When used properly, the most powerful tool that companies have to under-stand their business is the data generated by the business.
Nowadays every mid-to-large size company uses an Enterprise Resource Planning (ERP) system that collects information about the state of all different divisions of the enterprise and stores this information, making it available to be used by every department of the company. The data stored is very valuable to a company and properly analyzed it can help companies take better business actions. The current Business Intelligence solutions work great when analyzing data from a single source, but struggle to collect data from different sources. The objective of this dissertation is to create a Business Intelligence solution, focused in the financial and economic field, that can extract data from all the different ERPs that currently exist and store that information in a Data Warehouse, making it available to further processing and analyzing. This project was proposed by a portuguese com-pany, Satbyte, and it was done in a business environment in collaboration with it to develop a new marketable product for the company.
This document contains the proposed solution to the problem and a im-plementation of it. That consisted in the creation of a Data Warehouse to store the data in an integrated way, coming from several ERPs and the development, in web environment, of several use cases from the economic and financial analysis field. The developed solution proved to be effective for the purpose initially formulated and was validated by the company as having a crucial role for the continuation of the development of the extended Business Intelligence solution in which they intend to continue to invest.
Contents
Contents i
List of Figures iii
List of Acronyms v
1 Introduction 1
1.1 Motivation . . . 1
1.2 Problem and Objectives . . . 2
1.3 Satbyte . . . 2
1.4 Outline . . . 3
2 Theoretical Framework 5 2.1 Data vs Information vs Knowledge . . . 5
2.2 Accounting and Financial Concepts . . . 6
2.2.1 Chart of Accounts . . . 6
Account Balance . . . 7
Aggregating vs Movement Accounts . . . 7
2.2.2 Balance Sheet . . . 8
2.2.3 Business Performance Metrics . . . 8
2.3 Enterprise Resource Planning . . . 9
2.4 Business Intelligence . . . 10 2.4.1 History . . . 11 2.4.2 Goal . . . 11 2.4.3 Architecture . . . 12 2.4.4 Benefits . . . 13 2.4.5 Applications . . . 14
2.5 Extract, Transform and Load . . . 15
2.6 Data Warehouse . . . 16
2.6.1 History and Definition . . . 17
2.6.2 Dimensional vs Normalized Approach . . . 18
Inmon’s Model . . . 19
Kimball’s Model . . . 20
2.7 OLAP . . . 21
2.7.1 OLAP Cube . . . 21
3 Requirements and Solution 23 3.1 The Problem . . . 23 3.1.1 Requirements . . . 23 3.2 Proposed Solution . . . 24 3.2.1 Architecture . . . 24 3.2.2 Data Sources . . . 25 3.2.3 ETL Process . . . 26 Normalized COA . . . 26 Unfolded Accounts . . . 27 3.2.4 Data Warehouse . . . 28 History Tables . . . 30
3.2.5 Economic and Financial Analysis Use Cases . . . 30
Web Application . . . 31 4 Implementation 33 4.1 Import Tool . . . 33 4.1.1 ETL Process . . . 34 Normalized COA . . . 34 Unfolded Accounts . . . 34 4.1.2 Demos . . . 35 4.2 Web Application . . . 39 4.2.1 Balance . . . 39 4.2.2 Results . . . 41 4.2.3 Compare . . . 45 5 Conclusions 47 5.1 Future Work . . . 47 References 49
List of Figures
2.1 From data to decisions (adapted from [1]). . . 5
2.2 Portuguese standard Chart of Accounts (COA) example. . . 6
2.3 Aggregating(A) and Movement(M) accounts. . . 7
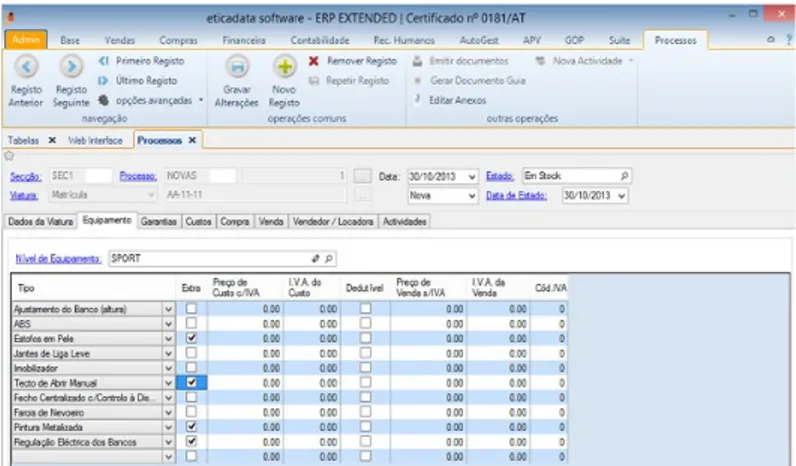
2.4 Eticadata ERP software. . . 9
2.5 Business Intelligence concept (adapted from [4]). . . 10
2.6 Business Intelligence as data refinery (adapted from [22]). . . 11
2.7 Business Intelligence framework (adapted from [24]). . . 12
2.8 Conceptual view of the ETL process (from [30]). . . 15
2.9 Concept: multiple sources, one repository. . . 16
2.10 Conceptual data models (adapted from [37]). . . 18
2.11 Inmon’s model (adapted from [40]). . . 19
2.12 Kimball’s model (adapted from [40]). . . 20
2.13 OLAP cube (adapted from [30]). . . 21
3.1 Solution architecture. . . 24
3.2 New COA identifiers translation table sample. . . 26
3.3 Unfolding account example. . . 27
3.4 Data Warehouse conceptual model. . . 28
3.5 Data Warehouse relational model. . . 29
3.6 Data Warehouse history tables. . . 30
4.1 Import tool in the solution architecture. . . 33
4.2 COA translator database. . . 34
4.3 Unfolded account - software requires user action. . . 35
4.4 Import tool - Login . . . 35
4.5 Import tool - Menu . . . 35
4.6 Import tool - Options . . . 36
4.7 Import tool - Unfolded account . . . 36
4.8 Import tool - Done . . . 37
4.9 Import tool - Searches/Accounts . . . 37
4.10 Import tool - Searches/Balance . . . 38
4.11 Import tool - Searches/Movements . . . 38
4.12 Web application in the solution architecture . . . 39
4.13 Web application - Menu . . . 39
4.14 Web application - Balance menu . . . 39
4.16 Web application - Results menu . . . 41
4.17 Web application - Results/Overview . . . 41
4.18 Web application - Results/Expenses . . . 42
4.19 Web application - Results/Expenses unfolded . . . 43
4.20 Web application - Results/Profits . . . 43
4.21 Web application - Results/Prediction toolbar . . . 44
4.22 Web application - Results/Prediction . . . 44
4.23 Web application - Compare toolbar . . . 45
4.24 Web application - Compare . . . 45
4.25 Web application - Compare/Prediction options . . . 46
List of Acronyms
3NF Third Normal FormBI Business Intelligence COA Chart of Accounts
ERP Enterprise Resource Planning ETL Extract, Transform and Load DW Data Warehouse
MSSQL Microsoft SQL Server OLAP Online Analytical Processing OLTP Online Transaction Processing SQL Structured Query Language
Chapter 1
Introduction
Knowledge is power, and time is money.
Nowadays every mid-to-large sized company uses Enterprise Resource Planning (ERP) systems for monitoring its business activities. These systems gather information from different functional areas - Finance, Human Resources, Marketing, Sales, etc. - of a company, organize it and keep all of this information in the same place.
Knowing that the everyday activity of a company can produce an immeasurable quantity of data that once processed becomes information, this holds a great value to a company business decision making, but this information can really shine when modeled as useful knowledge. All of this can be achieved using a Business Intelligence (BI) solution on top of the already implemented ERP system of the company.
By using the data stored in the ERP, with a BI solution it is possible to turn raw data into useful knowledge. BI tools analyze data and present analytical results in reports, dashboards, charts, etc. These can, then, be used by the right people to make informed decisions or just to know the state of a business at any given time. Focusing in the financial and economics data gathered in ERPs, this information can, then, be used by financial-economics professionals: consultants, advisors, auditors, etc.
As previously stated, if knowledge is power, and time is money, knowing that the ultimate goal of every business is to make money, then, BI by providing useful knowledge while cutting the time needed to analyze all the information and transform it in useful knowledge can become not only a supplement to business activities but instead a fundamental part of it.
1.1
Motivation
Information growth in the last years is a tendency that shows no signs of stopping or even slowing down. In an article1 posted by Forbes magazine in the end of 2015, it is said that the data created in the past two years is larger than in the entire previous history of the human race. It is estimated that by the year of 2020, about 1.7 megabytes of new information will be created every second for every person on the planet, by then the accumulated data will
1
https://www.forbes.com/sites/bernardmarr/2015/09/30/big-data-20-mind-boggling-facts-everyone-must-read/#d7f6b4817b1e - accessed on 29/03/2018
grow from about 4.4 zettabytes to around 44 zettabytes, and of all these data only less than 0.5% is analyzed and used.
Such an increase in data volumes demands that all of these data must be filtered, splitting the unnecessary data from the important and possibly useful. The filtered data can, then, be transformed into information and afterwards into useful knowledge. First, all of this data needs to be stored in databases somewhere, then analyzed and presented by using various methods, these activities can ultimately take shape as BI. By planning and creating a BI solution, this offers the possibility to research and comprehend more deeply all the different topics that constitute it.
This project develops a BI solution in collaboration with a real company, Satbyte. The value of doing the dissertation in a real business environment, while working in a solution of a real problem that can result in a new marketable product is immeasurable to an undergraduate student. Also, the importance of multidisciplinary knowledge cannot be ignored and must be highlighted, and by developing a BI solution for the economic-financial area, this project presents the opportunity to learn some concepts from these fields.
1.2
Problem and Objectives
In 2008, according to a survey2 by Teradata, a company that provides business analytics solutions, almost three-quarters of financial professionals said that there was a struggle to collect data from multiple sources and, therefore, the capacity to get knowledge about corpo-rate financial performance was diminished. This survey is at this time almost 10 years old, and while some of the difficulties presented must have been resolved by various solutions, like BI, a somewhat related problem arises.
The problem, brought up by a Portuguese informatics solutions company - Satbyte, is that field professionals, despite having more solutions for analyzing the financial business information related to an enterprise, do not have a BI solution that can retrieve and analyze information from different vendors ERPs. For example, a company that provides outsourcing services needs to have different software licenses and specialized workers so that they can use a specific BI system to analyze data in a specific ERP, most of times from the same vendor, that is installed on the contracting company.
So, the ultimate goal of this project is to create a BI solution focused in the economic-financial area that can be used to retrieve, store and analyze data from different ERP systems independently of their vendors. Such system, by default, also enables the possibility of com-paring data from different companies with distinct ERP systems and can be used to evaluate and predict global economic and financial metrics performance.
1.3
Satbyte
As referred in the previous section, the problem that this project addresses was brought up by a Portuguese company called Satbyte. Created in 2011, with a partnership over a previous professional relationship of its two founders: Artur Correia, specialist in enterprise
2
http://www.computerweekly.com/feature/Finance-directors-see-value-of-business-intelligence - accessed on 29/03/2018
networks, IT security, cloud computing and relational databases, and Carlos Dias, bachelor’s degree in accounting. By merging both professional knowledges, the company was born with the goal of developing economic-financial management software. Taking advantage of both the economic growth and detailed knowledge of the business needs of the Angolan market, the company business activity spans over to Angola.
In Angola, one of the sectors with a high degree of growth and a significant lack of regula-tion by the official entities, especially the Naregula-tional Bank of Angola, was the foreign currency buying and selling. Anticipating the evolution of the market, Satbyte developed computer solutions for exchange houses, among which a specific ERP for this sector of activity. Cur-rently, it is the most commercialized exchange software in Angola, being installed throughout the country, with quality acknowledged on several occasions by the National Bank of Angola. Later, in order to diversify the market, both geographically and in the business sector, an ERP for small and medium-sized enterprises has been developed since 2014, and it has been concluded, certified by Tax and Customs Authority and in the process of being implemented in the national and international market.
At the same time, in order to strengthen its presence in the international markets, with more prominence in the PALOP countries, a company was set up in Angola, Inforxxinetworks, Lda. In addition to the Angolan market, Satbyte has the goal, with the creation of this company, of extension to other African markets, besides the PALOPs.
1.4
Outline
Chapter 2 presents the theoretical framework by introducing some topics more related to the economic-financial area, enterprise management and other topics necessary to fully understand the extent of this dissertation. Introduces the BI systems, it goes over their history, architecture, benefits and others characteristics. It is introduced the Data Warehouse (DW) subject. It goes over its definition and concepts. Some related tools are also presented. Chapter 3 presents the objectives and requirements for this project. After, it presents the proposed solution. It goes over the decisions taken, the steps followed from the beginning of developing the solution to its completion.
Chapter 4 shows the final result of the work done within this dissertation, the final result of the steps shown in the previous chapter. It shows the implemented solution and demonstrates its usability.
Chapter 5 completes this dissertation by presenting some conclusions and future work guidelines.
Chapter 2
Theoretical Framework
This chapter provides a theoretical overview about the concepts and technologies used in this dissertation.
2.1
Data vs Information vs Knowledge
Data, information and knowledge are probably some of the most important and funda-mental concepts that must be learned when starting a BI project, so in this section we will be defining each one of them [1].
Figure 2.1: From data to decisions (adapted from [1]).
Data is/are the facts of the world. It can be thought of as a description of the world: having brown hair, blue eyes, be 180cm tall. All of these are facts whether they are written down or not. They can be perceived with our senses and the brain processes them. Human beings have used data as long as we’ve existed to form knowledge of the world. Until we started using information, all we could use was data directly.
Information allows us to expand our knowledge beyond the range of our senses. Infor-mation can capture data, then, it can be moved so that other people can access it at different
times. For example, a photograph of someone is information. But what someone looks like is data. If the photo is lost or destroyed, that does not change how the person looks like.
Knowledge is what we know. It can be thought of as a map of the world we build inside our brain. It is from this ”map” that we base our decisions, not the real world itself. Currently, the brain is the only place where it is possible to store knowledge. Computers are not artificial brains, they do not understand what they are processing, and cannot make independent decisions based upon what is told to them.
Finally, data is always correct (a person can’t be 25 years old and 30 years old at the same time) but information can be wrong (there could be two files on that person, one saying it was born in 1993, and one saying it was born in 1988). Information captures data at a single point in time, and data changes over time. Information can be lost, however it is not possible to physically lose data.
2.2
Accounting and Financial Concepts
This section will introduce some accounting and financial concepts whose understanding is fundamental for being able to understand the work done in this dissertation.
2.2.1 Chart of Accounts
The Chart of Accounts (COA) [2] is a list of all accounts used in the general ledger of an organization, broken down into categories. The general ledger [3] is a company’s set of numbered accounts for its accounting records. It provides a complete record of financial transactions over the life of the company, and holds information that is needed to prepare financial statements.
As one can see in Figure 2.2, a standard COA is organized according to a numerical system. Each category is defined with a number, and every subcategory within that category starts with the same numerical identifier followed by another number corresponding to the subcategory.
Every country has its own COA standard, in Figure 2.2 the example shown is the Por-tuguese standard COA. The numeric identifier of each account can be different comparatively to the COA of another country. These identifiers are set by each country up to the fourth digit maximum. Each account identifier can have more than four digits but the extra ones are set by each company and are totally unrelated from each other. Each company has the flexibility to set the best COA for its activity by including as many accounts as needed, so the size of each COA is variable and unique to each company.
Account Balance
Because every business transaction affects at least two accounts, the accounting system is known as a double-entry system [7]. When one business transaction occurs, there are at least two accounts involved, in one the transaction amount must be debited and credited in the other one. For example, if a company pays the rent for the current month, Rent Expense and Cash are the two accounts involved. Since cash was paid out, the asset account Cash is credited and the Rent Expense account is debited.
The balance of an account is the difference between debit and credit of such account. If debit is greater than credit, the balance is a debit balance, the opposite is known as a credit balance.
Balance = Debit − Credit (2.1)
Aggregating vs Movement Accounts
Each account presented in the COA can be considered as Aggregating or Movement. The aggregating accounts are the ones that have a subcategory. These accounts don’t have its own balance, that is obtained by adding the balances of all the subcategory accounts for that account. The movement accounts are the ones that don’t have any subcategory account. These accounts have their own balance. The aggregating accounts can be thought as branches of a tree, while the movement accounts are the leaves. In the example shown in Figure 2.3, the account number 62 is an aggregating account, and the accounts 621 and 622 are both movement accounts. The balance of account 62 is the sum of balances from accounts 621 and 622.
2.2.2 Balance Sheet
The balance sheet is a statement of the assets, liabilities, and capital of a business at a particular point in time, detailing the balance of income and expenditure over the preceding period. It is the most important of the main financial statements used to illustrate the financial health of a business [8] [9]. The balance sheet is based on the fundamental equation:
Assets = Liabilities + Equity (2.2)
Assets are typically organized into liquid assets - those that are cash or can be easily converted into cash - and non-liquid assets that cannot quickly be converted to cash, such as land, buildings, and equipment. The list of assets may also include intangible assets, which are much more difficult to value - patents, licenses, and secret formulas.
Liabilities are the money that a company owes to outside parties, from bills it has to pay to suppliers to interest on bonds it has issued to creditor to rent, utilities and salaries. Current liabilities are those that are due within one year, long-term liabilities are due at any point after one year.
Equity, also known as shareholders’ equity, is that which remains after subtracting the liabilities from the assets. Sometimes equity gets confused with capital, but they are not the same [10]. Equity is the owner’s share of assets of a business, and capital is the owner’s investment of assets in a business. Equity consists of capital plus reserves (retained earnings), so capital is one sub-category of equity. Retained earnings are earnings retained by the corporation - that is, not paid to shareholders in the form of dividends that can be used to pay down debt or reinvest in the business to take advantage of growth opportunities.
Because the balance sheet informs the reader of a company’s financial position as of one moment in time, it allows someone - like a creditor - to see what a company owns as well as what it owes to other parties in a specific point in time. This is valuable information to the banker who wants to determine whether or not a company qualifies for additional credit or loans. Others who would be interested in the balance sheet include current or potential investors, company management, suppliers, competitors, government agencies, etc [11] [12].
2.2.3 Business Performance Metrics
This section will define other business performance metrics that will appear in this project. These metrics, as the balance sheet, can hold valuable information to financial and accounting professionals, company management, and help investors analyzing the profitability and future growth of a company, which plays a huge role in deciding whether or not to invest in it.
• Current Assets: Represents the value of all assets that can reasonably expect to be converted into cash within one year. It include cash and cash equivalents, accounts receivable, inventory, marketable securities, prepaid expenses, and other liquid assets that can be readily converted to cash [13] [14].
• Current Liabilities: Are a company’s debts or obligations that are due within one year or within a normal operating cycle.
• Borrowed Capital: Consists of money that is borrowed and used to make an invest-ment. It differs from equity, which is owned by the company and shareholders.
• Pretax Result: It refers to the difference between a company’s operating revenues and its directs expenses (except taxes) tied to those revenues. Is one of the best barometers for the basic health of a business, because it measures both the revenue and expenses associated with the company’s primary business activities [15].
• Operating Result: Is a indicator of a company’s profitability, calculated as revenue minus expenses, excluding tax and interest. By ignoring tax and interest expenses, it focuses solely on a company’s ability to generate earnings from operations, ignoring variables such as the tax burden and capital structure [16].
2.3
Enterprise Resource Planning
Enterprise Resource Planning (ERP) is a business process management software that allows an organization to use a system of integrated applications to manage the business and automate many back office functions related to technology, services and human resources [17]. The first ERP system to be developed was SAP, a software firm that was established in 1972 by three software engineers based in Mannheim, Germany. But it wasn’t until the 1990s that the acronym ERP was first used, coined by the Gartner Group [18].
An ERP system nowadays is a fundamental part of every mid-to-large sized companies. Typically, each department would have its own system optimized for that division’s particular tasks. With ERP, each department still has its own system, but it can communicate and share information easier with the rest of the company. The ERP software functions like a central nervous system for a business. It collects information about the activity and state of different divisions of the corporation and makes this information available to other parts where it can be used productively. Information on the ERP is added in real time by users, and any authorized user can access the system any time.
The ERP system helps a corporation become more self-aware by linking information about production, finance, distribution and human resources. ERP connects different technologies used be each individual part of a business, eliminating duplicate and incompatible technology that is costly to the corporation. This involves integrating accounts, stock-control systems, order-monitoring systems and customer databases into one system.
2.4
Business Intelligence
Business Intelligence (BI) can have different definitions based on where and/or what it is used, in a large sense it can be defined as the processes, technologies and tools needed to turn data into information and information into knowledge and knowledge into plans that drive profitable business action. It is a broad term that encompasses data mining, process analysis, performance benchmarking, descriptive analytics, etc [19].
Essentially, BI is timely, accurate, high-value, and actionable business insights, and the work processes and technologies used to obtain them. It makes interpreting voluminous data friendly, easily used for decision making [20].
Figure 2.5: Business Intelligence concept (adapted from [4]).
Business Intelligence grew out of the conviction that managers with inaccurate or incom-plete information will tend to make worse decisions than if they had better information. BI is meant to solve that problem by bringing in the most current data that is ideally presented on a dashboard of quick metrics designed to support better decisions.
Business Intelligence does not tell business managers what to do or what will happen if they take a certain course, neither is BI only about generating reports. Rather, BI offers a way for people to examine data to understand trends and derive insights. For example, a company that wants to better manage its supply chain needs BI capabilities to determine where delays are happening and where variabilities exist within the shipping process. That company could also use its BI capabilities to discover which products are most commonly delayed or which nodes of transportation are most often involved in delays.
The potential use cases for BI extend beyond the typical business performance metrics of improved sales and reduced costs. The benefits of using BI tools cannot be understated. It enables faster, more accurate reporting and analysis, improved data quality, and the ability to make better business decisions.
2.4.1 History
The first known use of the term ”Business Intelligence” was in the ’Cyclopedia of Com-mercial and Business Anecdotes’ from 1865. ”Throughout Holland, Flanders, France, and Germany, he maintained a complete and perfect train of business intelligence. The news of the many battles fought was thus received first by him, and the fall of Namur added to his profits, owing to his early receipt of the news.”, the author Richard Millar Devens used the term to describe how the banker Sir Henry Furnese gained profits by receiving and acting upon information prior to this competitors. While not quite equivalent to its current meaning, this usage already demonstrates the core abilities that BI provides to its user [21].
In the late 1980s BI came into focus, it was clear that analyzing business information through computerized systems had a very bright future. In 1989, Howard Dresner, proposed it as an umbrella term to describe concepts and methods to improve business decision making by using fact-based support systems. But it was only in the late 1990s that the term was widely adopted and replaced other terms like executive information systems.
2.4.2 Goal
The goal of BI is to assist in strategic and operational decision making, and to help knowledge workers make better and faster decisions. By gathering data and presenting it in an useful and meaningful form BI can help decision-makers take decisions and more informed actions and, consequently guide them towards better decisions for their organizations.
Business leaders have access to more data than ever before[32], but data by itself doesn’t generate insights. BI can be thought of as a data refinery, see Figure 2.6, that turns data into actions and business value. BI is most effective when it combines data derived from the market in which a company operates (external data) with data from company sources internal to the business such as financial and operations data (internal data) [22].
2.4.3 Architecture
Business Intelligence is the process of turning data into actionable information. This process includes two primary activities: getting data in and getting data out [23]. The first delivers limited value to an enterprise, and only when users and applications access the data and use it to make decisions the organization realizes the full value from its data warehouse. The second activity consists of business users and applications accessing data from the data warehouse to perform enterprise reporting, querying, and predictive analytics.
As one can see in Figure 2.7, a BI solution has 5 main components: Data sources, Extract, Transform and Load (ETL), Data Warehouse (DW), Data Marts and Dashboards/Reports[24].
Figure 2.7: Business Intelligence framework (adapted from [24]).
1. Data Sources: Everything starts with the data. Any source of data like people, docu-ments, products, activities, events and records from which data are obtained represent the data sources. Sources can be internal to organization, or come from an external data provider. External sources can vary greatly on what questions the organization is trying to answer, but may include public data from government reports, weather information and industry news reports.
2. ETL: A key part of BI is the tools and processes used to prepare data for analysis. The process of extracting data from source systems and bring it into the DW is called ETL. The data is extracted from internal and external sources, transformed into a common format, and loaded into a DW.
3. Data Warehouse: Is the place where data will be stored. It is the central repository of data where all the data from different sources is integrated. The point of BI is to generate more insight about organizations as a whole, so the data from all of those systems must be combined in order to understand a single, holistic view of what’s happening in the company.
4. Data Mart: A data mart is a database like DW, but it is usually smaller and has a narrower scope (e.g. focus on a particular functional area). They are usually supplied by the DW and can be used to store a particular set of data, allowing operations over that data, like Online Analytical Processing (OLAP), answering the user’s questions. 5. Reports, dashboards, others: Various forms of displaying information to the end
user requesting it. These can, then, be used to support the process of decision making. One of the goals of BI is to make data accessible and useful to non-technical business users. As such, data must often be transformed into something beyond spreadsheets and lists of numbers so that it can be properly understood. Traditional formats include bar charts, pie charts and scorecards.
2.4.4 Benefits
The use of BI presents numerous benefits to a company and there are many reasons why companies adopt it. Initially, the benefits have more of a local impact and are easier to measure. As business users mature to performing analysis and prediction, the level of benefits become more global in scope and difficult to quantify [23]. It is difficult to find a business area that does not benefit from having better information to work with.
A successful and well-executed BI solution [25]:
• Eliminates guess work: BI can provide accurate historical data, updates in real time and even allows to predict ”what-if” scenarios. This way, management is able to see detailed, current data on all aspects of the business like financial, production, and customer data. Hence management can make fact-based decisions and not just a guess work.
• Gives quicker responses: By getting immediate answers to any business questions it is possible to make quicker decisions without wasting too many valuable time searching for this answers in scattered reports.
• Allows to obtain important business data anytime: It is possible to access data, business metrics, dashboards and reports anywhere and whenever it is necessary by just accessing a mobile device application for example.
• Gain valuable insight into your customer’s behavior: One of the biggest benefits is the ability to look into what the market is purchasing (or not). It gives the company an opportunity to turn such information into profit and hold on to its valuable clients. • Pinpoint cross-selling and up-selling opportunities: By analyzing customer’s behavior and patterns, sales personnel can up-sell and cross-sell products at the most appropriate client touch points.
• Improves resource allocation: Allows to analyze how each business unit is doing and can easily pinpoint the areas that need to modify in order to streamline its operations. • Improves efficiency: Information can be centralized and can be viewed in a dashboard or report, eliminating inefficiencies in many organizations that throw away valuable time looking for information from within their different data sources.
• Find out the real manufacturing costs: It can give a bigger insight into the com-pany manufacturing costs and the ability to make changes to production in order to come up with larger profitability.
• Helps in identifying business opportunity: It can help a company assess its own capabilities; compare its relative strengths and weaknesses against its competitors; iden-tify trends and market conditions; and respond quickly to change to gain a competitive advantage and to identify new business opportunities.
2.4.5 Applications
In order to create business value, BI tools can be applied to various functions which vary depending on the industry. For example, they are used in manufacturing for order shipment and customer support, in retail for user targeting and profiling, in financial and banking services for claims and risk analysis, in transportation for fleet management, in telecommunications for understanding customer drop-off rates, and in power and utilities for power usage analysis [26].
The following list contains the most common BI tools and some of the most popular ways to utilize them [27]:
• Executive Scorecards and Dashboards: With time being of essence in the day of top-level company managers, the deployment of graphical dashboards allows senior executives to monitor key performance indicators and critical metrics of the business in the shortest time possible.
• OLAP Analysis: BI offers OLAP (computer processing that enables the user to easily and selectively extract and view data from different points of view, further discussed in Section 2.7) capabilities, allowing users to manipulate data in an unlimited number of ways enabling business analysts and other power users to analyze information down to the finest detail.
• Ad hoc Reporting: Sometimes, employees need to rapidly create a new report to answer an urgent question, make an ”on the fly” decision, or address a pending issue. BI eases this even to non-technical users.
• Operational Reporting: Enables real-time monitoring of day-to-day events in thou-sands of executing operational tasks that businesses run on.
• Forecasting: Allows a company to anticipate trends. Leverages historical data to predict future events in order to ensure effective strategic planning.
• Data Mining: In a world with massive volumes of data, finding which one is relevant can be a daunting task. Data mining eases this process, helps locate and extract the most important information from large data sets.
• Customer Intelligence: Helps the businesses better understand needs, behaviors, and preferences and use that knowledge to implement more successful loyalty and up-sell/cross-sell programs.
2.5
Extract, Transform and Load
Simply having access to the data does not mean it is ready to be used for BI [28]. A key part of BI is the tools and processes used to integrate and prepare data for analysis. When data is created by different applications, it is not likely all in the same format, and data from one application cannot necessarily be looked at in relation to data from another. In addition, if BI is relied on to make critical decisions, businesses must make sure the data they are using is accurate.
The Extract, Transform and Load (ETL) processes are the steps that the system takes to move information from the source data systems to the target database, while consolidating it. Consolidating the data involves: moving it, making it consistent and cleaning up the data as much as possible [20]. ETL enables integration and analysis of the data stored in different databases and heterogeneous formats (see Figure 2.8). As the name suggests, ETL is a combination of three different database processes. Extracting and loading are simply moving data, but transforming it is where the complexity lies. [29] [30]
• Extract: The aim of Extract is to do the data extraction from the source system, often from multiple and different types of sources, and make it available for further processing. This step is focused on obtaining data as efficiently and with as little impact to the source system as possible.
• Transform: The aim of the Transform process is to apply a series of rules or functions to transform and prepare the extracted data to meet the requirements of the target system. Some of the processes used are conversion, joining data from several processes, clearing the duplicates, standardizing, filtering, translating and looking up or verifying if the data sources are inconsistent. This process entails transformation types that ensure the quality and integrity of data. Without this step, businesses cannot be confident in the data being migrated or integrated into the target system.
• Load: The Load step concludes the ETL process with the loading of the extracted and transformed data into the target database.
2.6
Data Warehouse
The whole purpose of a BI implementation is to turn operational data into meaningful knowledge. That means BI must be connected with organization’s data to be effective. With huge amounts of data generated by any enterprise, the challenge is to put all the necessary data in one place, in one common format. Data Warehouse (DW) is the perfect architecture to meet that challenge.
Data warehouses are central repositories for data imported from other databases. They collect relevant data from multiple different data sources, rationalize, summarize and catalog it in a large consistent, stable, accurate, long term data stores. A DW repository is a single logical (but not necessarily physical) repository for a company’s transactional and operational data, and external data sources. The DW itself does not create data; it is not a transactional system. Every byte of data inside the DW has its origins elsewhere [20] [30].
Figure 2.9: Concept: multiple sources, one repository.
Data warehousing is a vital component of BI. It is used to provide greater insight into the performance of a company by comparing data consolidated from multiple heterogeneous sources. The ETL process ends with data being loaded into the warehouse because when the data is contained within the separate sources, it is not much use for intelligence. That’s for two primary reasons [28].
1. Those sources are typically applications that are designed for processing transactions, and analyzing data directly from them would take too long and disrupt critical business operations.
2. The objective of BI is to generate more insight about the organizations as a whole, so the data from all of those systems must be combined in order to understand a single, holistic view of what is happening in the company.
Data warehousing is also often a tool to bridge the gap across multiple functional areas of an organization. A good DW system should make it easier for different departments within a company to access each other’s data. For example, a company stores information pertaining
to its employees, their salaries, developed products, customer information, sales and invoices. The CEO might want to ask a question that the answer will involve analysis all of this data. This is a main service of the DW, allowing executives to reach business decisions based on all these disparate raw data items, and unlike an operational data store, it contains aggregate historical data, which may too be analyzed [31].
2.6.1 History and Definition
The relational data revolution in the early 1980s introduced an era of improved access to the valuable information contained deep within data [33]. In the 70’s, a typical business used a collection of large mainframe-base application systems for most of their operations, and while the tools to access and extract data from these systems were very powerful, they required particular expertise. Worst, the way data was stored during this time led to massive anomalies and inaccuracies in data. Relational databases and most importantly, the development of Structured Query Language (SQL) made it easier to delete and modify details, avoid data duplication and inconsistent records, while also making it easier to maintain security. But it was soon discovered that databases modeled to be efficient at transactional processing were not always optimized for complex reporting or analytical needs.
The practice known today as DW dates back to the late 1980s [35] when IBM researchers Barry Devlin and Paul Murphy developed the ”business data warehouse”, although a future progenitor of the practice, Bill Inmon, used a similiar term before. Considered by many to be the Father of Data Warehousing, Bill Inmon first began to discuss the principles around DW and even coined the term in the 1970s. He created the most accepted definition by the community of what a DW is:
”A data warehouse is a subject-oriented, integrated, time-variant and non-volatile collection of data in support of management’s decision making process.” - Bill Inmon [34]
According to Bill Inmon, [34] DW presents the following properties.
• Subject-Oriented: A DW can be used to analyze a particular subject area. For example, ”finance” or ”sales” can be a particular subject.
• Integrated: A DW integrates data from multiple data sources. Fo example, source A and source B may have different ways of identifying a product, but in DW, there will only be a single way of identifying a product.
• Time-Variant: Historical data is kept in the DW. For example, it is possible to retrieve data from 3 months, 6 months, 12 months, or even older data from a DW. This contrasts with a transaction system, where often only the most recent data is kept. • Non-volatile: Once data is in the DW, it will not change. So, historical data in a DW
2.6.2 Dimensional vs Normalized Approach
There are two leading approaches to store data in a DW - the normalized approach and the dimensional approach. The normalized approach refers to Bill Inmon’s model (Figure 2.11); the dimensional approach refers to Ralph Kimball’s model (Figure 2.12) [35]. While the DW systems in most enterprises are closer to Kimball’s idea, there is no right or wrong.
In the normalized approach, the data in the DW are stored following, to some ex-tent, database normalization rules. Database normalization is the process of restructuring a relational database in accordance with a series of normal forms in order to reduce data redundancy and improve data integrity.
This model identifies the key subject areas, and most importantly, the key entities the business operates with and cares about, like customer, product, vendor, etc. From this model, a detailed logical model is created for each major entity. All the details including business keys, attributes, dependencies, participation, and relationships will be captured in the detailed logical model. The key point here is that the entity structure is built in normalized form. Data redundancy is avoided as much as possible.
In a dimensional approach, data is partitioned into either ”facts”, which are generally numeric transaction data, or ”dimensions”, which are the reference information that gives context to the facts.
The fundamental concept of dimensional modeling is the star schema. In the star schema, there is a fact table surrounded by many dimensions. The fact table has all the measures that are relevant to the subject area, and it also has the foreign keys from the different dimensions that surround the fact. The dimensions completely are de-normalized so that the user can drill up and drill down avoiding JOIN operations. Multiple star schemas will be built to satisfy different reporting requirements, but the key dimensions that are shared across the different facts will be built once and be used by all the facts. [36] [37]
(a) Normalized schema (b) Star schema
Inmon’s Model
In Bill Inmon’s model, the DW is sourced from Online Transaction Processing (OLTP) systems, is the central repository of data, and it is in the Third Normal Form (3NF). Data marts source their information from the DW as and when required, and OLAP cubes (Section 2.7.1) are built from the dimensional data marts [38].
Inmon is one of the leading proponents of the top-down approach to DW design, in which the DW is designed using a normalized enterprise data model. He has defined a DW as a centralized repository for the entire enterprise. Dimensional data marts containing data needed for specific business processes or specific departments are created from the enterprise DW only after the complete DW has been created [39]. Any data that comes into the DW is integrated, and the DW is the only source of data for the different data marts. This ensures that the integrity and consistency of data is kept intact across the organization. Figure 2.11 shows the typical architecture of an Inmon DW [40].
Figure 2.11: Inmon’s model (adapted from [40]). Following the Inmon’s model has some advantages [36]:
• The DW truly serves as the single source of truth for the enterprise, as it is the only source for the data marts and all the data in the DW is integrated.
• The business processes can be understood easily, as the logical model represents the detailed business entities.
• Very flexible, as the business requirements change or source data changes, it is easy to update the data warehouse as one thing is in only one place.
But it presents various disadvantages:
• The model and implementation can become complex over time as it involves more tables and joins.
• The initial set-up and delivery will take more time, and management needs to be aware of this.
• A fairly large team of specialists need to be around to successfully manage the environ-ment.
Kimball’s Model
Data warehouse is the conglomerate of all data marts within the enterprise, it is central to the model and is a de-normalized star schema. Information is always stored in the dimensional model, and the OLAP cubes are built on the DW. The data marts are sourced from OLTP systems and are usually relational databases in 3NF [38]. [39] [40]
Kimball’s model follows a bottom-up approach, in which data marts are first created to provide reporting and analytical capabilities for specific business processes. These data marts are eventually integrated together to create a DW using a bus architecture, which consists of conformed dimensions between all the data marts. So the DW ends up being segmented into a number of logically self-contained and consistent data marts, rather than a big and complex centralized model. Kimbals defines DW as a copy of transaction data specifically structured for query and analysis. Figure 2.12 shows the typical architecture of a Kimball DW.
Figure 2.12: Kimball’s model (adapted from [40]). Here are some of the advantages of Kimball’s model [36]:
• Quick to set-up and build, and the first phase of the data warehousing project will be delivered quickly.
• The star schema can be easily understood by the business users and is easy to use for reporting. Most BI tools work well with star schema.
• A small team of developers and architects is enough to keep the data warehouse per-forming effectively
Some disadvantages:
• The essence of the one source of truth is lost, as data is not fully integrated before serving reporting needs.
• Redundant data can cause data update anomalies over time.
• Adding columns to the fact table in star schema can cause performance issues. This is because the fact tables are designed to be very deep. If new columns are to be added, the size of the fact table becomes much larger and will not perform well. This makes the dimensional model hard to change as the business requirements change.
2.7
OLAP
OLAP stands for Online Analytical Processing, and as opposed to the OLTP systems -where the main emphasis is to put on very fast query processing (INSERT, UPDATE, DELETE), maintaining data integrity and its effectiveness is measured by the number of transactions -, focus is on data analyses rather than transactions. The DW and ETL process represent the back end of BI, while OLAP represents the front end. OLAP performs mul-tidimensional analysis of business data and provides the capability for complex calculations, trend analysis, and sophisticated data modeling [41].
OLAP is the function that allows users to pull out the data they want and make the comparisons they need in order to have their questions answered. OLAP systems are funda-mentally different from other forms of data conceptualizations because it handles data in the same way people do when they are creating reports [30].
The operational applications store their data in disparate database systems scattered around the company. That information is brought together into the common DW envi-ronment. The OLAP system extracts information from the DW and stores it in an easily changeable, multidimensional, hierarchical database called a cube. The OLAP access tools then links users to the data in the OLAP cube to help them produce multidimensional reports and analyses.
2.7.1 OLAP Cube
An OLAP cube is a data structure that overcomes the limitations of relational databases by providing rapid analysis of data. The term cube here refers to a multidimensional dataset. In an OLAP environment, a cube is a specialized data store designed specifically to handle multidimensional summary data. But rather then being held in a relational table (which are built to process transactions rapidly), cube data is stored in cells. Its structure is like a 3D spreadsheet [30].
Figure 2.13: OLAP cube (adapted from [30]).
Figure 2.13 shows an example of a cube composed by three dimensions: student name, exam and semester; And a measure: grades. A dimension refers to a characteristic of the data, and while the example cube contains only three dimensions it is possible to add more.
A measure corresponds to a description of what is represented by the cells, think of the title of a report as the long version of the measure [42].
Assume that the dimension ”year” is added, and imagine this new dimension as being a box containing the previous three dimensions, then, the result would be various boxes containing the example cube with the information for a specific year. Now the cube has four dimensions, and it is possible to continue adding more until all the requirements are met.
Cubes can display and sum large amounts of data while also providing users with search-able access to any data points. So, the data can be rolled up, sliced and diced as needed to handle the widest variety of questions.
2.7.2 Architecture
OLAP systems can be mainly categorized in three different architectures [43]:
• MOLAP: Multidimensional OLAP, the more traditional way of OLAP analysis. Is the architecture based on cubes, the data is stored in a multidimensional cube. It is a version of OLAP that is built for speed: stores data in logical structures uniquely constructed to accelerate retrieval.
• ROLAP: Relational OLAP, relies on manipulating the data in relational databases to give the appearance of traditional OLAP’s slicing and dicing functionality. Instead of proprietary multidimensional databases, it emulates a cube layer, inserting a semantic layer between the database and the end-user tool that mimics the data cube’s actions. In essence, each action of slicing and dicing is equivalent to adding a ”WHERE” clause in the SQL statement.
• HOLAP: Hybrid OLAP, attempts to combine the advantages of MOLAP and ROLAP systems. The cube structure is in place to handle large numbers of dimensions spanning many levels of hierarchy. They offer rapid performance and fast refresh to perform analysis and create complex reports. Meanwhile, the hybrid system can rely upon the space-saving ROLAP architecture to store larger volumes of raw data, funneling only the necessary summary information to the cube. And when detail information is needed, HOLAP can drill-through from the cube into the underlying relational data to work directly with it.
Chapter 3
Requirements and Solution
This chapter presents the proposed solution to the problem described earlier. The solution meets the requirements for this project and shows all the steps, decisions, and work done that builds up the final solution architecture.
It should be noted that this work was done in collaboration with a company - Satbyte.
3.1
The Problem
Remembering what was said in Chapter 1, the objective of this dissertation is to develop a BI solution focused in the economic and financial area. The system must collect crucial economic and financial information from different ERP systems, independently of its vendors and store all the information in the same place - the DW, which will make it available to the system for subsequent processing and analysis.
Other BI systems1 can manage the economic and financial data, and deliver advanced reports and analysis. But these solutions have merely access to data specific from one database/DW, while the objective of this project is to create a solution that can retrieve data from every single ERP software2 that exists and store it together in the same DW to analyze it, independently from each other or together. This allows analysis and comparison of global economic and financial performance metrics and financial statements available to business owners or other parties interested.
3.1.1 Requirements
Now that the problem and objective of this project is clarified, the solution for it needs to meet some requirements. So, the solution developed has to meet the following requirements:
1. The tool built to import data must be for Desktop Windows OS. 2. The modules needed must be written in C#.
3. The DW must be developed in Microsoft SQL Server (MSSQL).
1
Most popular BI softwares: https://www.capterra.com/business-intelligence-software/#infographic - ac-cessed on 29/05/2018
2
Most popular ERPs: https://www.capterra.com/enterprise-resource-planning-software/#infographic - ac-cessed on 29/05/2018
4. The DW must be in the 3NF.
5. The data in DW must be normalized.
6. When importing data, all the situations of unfolded accounts must be handled. 7. The ERPs collected data cannot be cut-down.
3.2
Proposed Solution
This section will describe the proposed solution to the problem, now that the requirements it needs to meet were presented. And through its subsections, the workflow that led to its implementation. First, in order to meet the requirements set to this project, Section 3.1.1, the following decisions were taken:
• Requirement 1: The tool to import the data will be developed using Windows Presen-tation Foundation (WPF) with C# in Visual Studio.
• Requirement 2: The modules to import the data, specific to each ERP, will be in C#. • Requirements 3 and 4: The DW will be developed in MSSQL and the data will be in
the 3NF. Its core architecture will follow Bill Inmon’s model (Figure 2.11).
• Requirements 5, 6 and 7: All the data to be stored in the DW will go through an ETL process, the rules and functions to be implemented in it ensure that all the data imported meets these requirements.
In addition to the requirements it will be, also, developed a web application in ASP.NET to be the project front-end to the reporting and analytics layer. Figure 3.1 shows the solution architecture with all the modules that compose it.
3.2.1 Architecture
Figure 3.1 shows the proposed solution architecture. It is composed by four different main modules.
1. Data Sources: This represents all the sources from which the data is retrieved, mainly the different ERPs database. Each one of them is first analyzed, and the tables with the crucial data are pointed to create the respective C# module that will be used to retrieve the data from its source.
2. Import Tool: To be developed in WPF/C#. It will retrieve the data from the ERPs using the specific C# module to each one. It is in this tool that the ETL process will be applied, first extracting the crucial data, then transforming it to consolidate accordingly with the parameters defined and, finally, loading it to the DW.
3. Data Warehouse: The DW is the central piece of the solution architecture. It’s in the DW that all the data imported will be stored in the 3NF. Its design follows closely the Bill Inmon’s model (Figure 2.11).
4. Reporting and Analytics Layer: It is in this layer that all the information stored in the DW will be put out to use. By simply creating and displaying reports to its users, or by using it with advanced analytical tools to answer any question. All of these functionalities will be available to the users in form of a web application developed in ASP.NET.
3.2.2 Data Sources
Starting with the data sources, the ERP’s databases. The initial premise of this project is to import crucial information from the different ERP’s databases to our DW. So, which information is crucial to be imported? The answer to this question was provided in the various meetings with the finance and accounting department of Satbyte. It come to the conclusion that what we wanted to import was essentially, the company’s Chart of Accounts (COA), the transactions and movements records, and the credit and debit balances from its activities.
Knowing which information needs to be imported, it was time to start analyzing the available ERPs. The first ERP to be analyzed was ERP eticadata3. Without previous knowledge of this tool, first the interface, features and functionalities were analyzed to provide a better understanding of what was expected to be delivered, and where to search for the information needed to be imported to the DW. Following this it was time to start analyzing its database.
As can be expected, such systems, to be able to store information about so many functional areas of a company have some hundreds of tables in a very complex database. So the process of analyzing the database tables and figuring out where the crucial information was stored took some time, but it is essential and of the most importance. This needs to be repeated for every different ERP, candidate to be included in this system. There is no different path or short cut. Every different ERP has its own database, with different tables and structure that needs to be examined, directly or through documentation. Some ERPs have a better structured database than others, with better tables names, which facilitates this step.
At the end of this step, with the knowledge obtained, it is possible to start developing the C# module to import crucial data from the analyzed ERP’s database. Module that will, then, be integrated in the import tool to be developed adding more available ERP systems, from which it will be possible to import data to the DW.
3.2.3 ETL Process
As previously seen, during the ETL process all data imported must be consolidated before it is stored in the DW. The ETL process will be part of the import tool. In order to consolidate the data to be loaded to the DW, aside from normalizing the data types and formats, there are two important situations that need to be handled: normalized COA and handling unfolded accounts.
Normalized COA
To normalize all accounts presented in the different COAs imported to the DW it was created a new COA to which all the accounts identifiers are converted. This new COA is based in the standard Portuguese COA, and it defines all the accounts identifiers up to a maximum length of four. The new accounts identifiers are obtained by prefixing a ’9’ to the respective Portuguese account identifier. This will be applied to all COAs, independently of its origin country. First, a COA from a country other than Portugal is translated to its Portuguese equivalent, then, the translation table is applied to its accounts identifiers. A sample of the translation table can be seen in Figure 3.2.
Figure 3.2: New COA identifiers translation table sample.
As said above, the translation table is defined up to the four digits length accounts. But organizations can define accounts in their COA with as many digits as they want, and by requirement 7: ”The ERP’s collected data can’t be cut-down”. To handle this problem, when importing an account identifier with more than four digits, to translate it to the normalized COA, the identifier is cut-down to the fourth digit and that sub-identifier is looked up in the translation table. Then, it’s translated and the rest of the original identifier is appended to it.
Unfolded Accounts
The unfolded account problem appears when a movement account with a balance different from zero is unfolded in one or more movement accounts, becoming that way an aggregating account (explained in Section 2.2.1).
For example, the account 62 in July was 1000e. In August this account is unfolded in the accounts 621 and 622, and as a result of the transactions in this month the balance of each one is, respectively, 500eand 100e. In this scenario, knowing that only movement accounts can contribute to the balance, to where it goes the balance of account 62? Well, in case this happens it must be the user that answers this question. There are two options:
1. Split the balance as the user sees fit between the unfolded accounts (621, 622). 2. Do nothing and set the balance of account 62 to 0e.
This example is illustrated in Figure 3.3. It shows both cases in this situation, first where the user chooses option 1 - split the balance, and second where the user chooses option 2 - do nothing.
Figure 3.3: Unfolding account example.
• Case 1: The user chooses option 1, the account 62 balance (1000e) is divided as the user sees fit. In the scenario displayed in the figure above, the balance was split by adding 600e to account 621, and 400e to account 622. The balance of account 62 for August is 1600e because it’s the sum of resulting balances from accounts 621 and 622. • Case 2: The user chooses option 2, the account 62 balance is set to 0e. In this scenario the resulting balance of account 62 is 600e, because it is the sum of initial balances from accounts 621 and 622.
The software to be developed needs to be aware that this situation can occur, and during the import of data from ERP to the DW, it needs to keep track and warn the user if this situation occurs. Stops and waits for the user to take an action so that it can proceed with importing data to the DW.
3.2.4 Data Warehouse
The DW is where all the imported data will be stored so that it can, then, later be used to create reports and/or be analyzed to answer the users questions and support decision-making processes. From the initial requirements (Section 3.1.1), we know that the DW must be developed in MSSQL and its structure be normalized up to the 3NF.
The first step when building a DW is the requirements analysis. We already know that the data to be stored in it has its source from the different ERPs databases, but we need to know, specifically, which data will be stored in it. As said in Section 3.2.2, after several meetings with Satbyte’s finance department, we come to the conclusion that we will store in the DW data relative to the companies COA, balances and movements from its accounts.
After gathering the necessary requirements, the following Entity Relationship Diagram, using Chen’s notation, was built as a conceptual model to the DW:
Figure 3.4: Data Warehouse conceptual model.
From the Entity Relationship Diagram in Figure 3.4 it is possible to create a relational model for the DW. In this model is possible to observe the entity names, relationships, attributes, primary and foreign keys of the DW to be implemented. Observing the model, it’s easily deducted that the DW is at least in the 3NF:
• It’s in the 1NF: It contains only atomic values, and there are no repeating groups. • It’s in the 2NF: It’s in the 1NF, and all non-key attributes are fully functional
de-pendent on the primary key.
• It’s in the 3NF: It’s in the 2NF, and there is no transitive functional dependency. The relational model is shown ahead in Figure 3.5, and it shows how the DW structure in MSSQL will look like when implemented.
Figure 3.5: Data Warehouse relational model.
As can be seen in Figure 3.5, the DW will be composed with five tables. This DW will only store crucial information for finance and economic analysis, being crucial and field oriented the keywords in this project.
• Source: This table stores the information about the data origin. From which server and database it was imported, and the company’s name it refers to.
• Chart Accounts: This table will store the information about the COA imported from the data source. It attributes an identifier to each yearly COA imported to the DW from the company’s database.
• Account: The COA is constituted from accounts, and the accounts information, num-ber and name, is stored in this table. Every entry in this table stores an account from a specific company’s year COA.
• Balance: In this table it is stored the balance for every account imported by month, along with the debit and credit values from which resulted the account’s balance. It is also stored the account type for that month, aggregating or movement.
• Movement: The movement table is the one with more columns. It stores information about all the movements made for each account that result in its credit and debit values, resulting from the company activities in the years imported.
![Figure 2.5: Business Intelligence concept (adapted from [4]).](https://thumb-eu.123doks.com/thumbv2/123dok_br/15875049.1088543/28.892.285.616.402.720/figure-business-intelligence-concept-adapted-from.webp)
![Figure 2.6: Business Intelligence as data refinery (adapted from [22]).](https://thumb-eu.123doks.com/thumbv2/123dok_br/15875049.1088543/29.892.278.636.730.1054/figure-business-intelligence-data-refinery-adapted.webp)
![Figure 2.7: Business Intelligence framework (adapted from [24]).](https://thumb-eu.123doks.com/thumbv2/123dok_br/15875049.1088543/30.892.194.710.382.712/figure-business-intelligence-framework-adapted-from.webp)
![Figure 2.8: Conceptual view of the ETL process (from [30]).](https://thumb-eu.123doks.com/thumbv2/123dok_br/15875049.1088543/33.892.271.637.810.1060/figure-conceptual-view-etl-process.webp)

![Figure 2.10: Conceptual data models (adapted from [37]).](https://thumb-eu.123doks.com/thumbv2/123dok_br/15875049.1088543/36.892.167.737.752.1041/figure-conceptual-data-models-adapted-from.webp)
![Figure 2.11: Inmon’s model (adapted from [40]).](https://thumb-eu.123doks.com/thumbv2/123dok_br/15875049.1088543/37.892.222.684.458.746/figure-inmon-s-model-adapted-from.webp)
![Figure 2.12: Kimball’s model (adapted from [40]).](https://thumb-eu.123doks.com/thumbv2/123dok_br/15875049.1088543/38.892.221.682.436.703/figure-kimball-s-model-adapted-from.webp)
![Figure 2.13: OLAP cube (adapted from [30]).](https://thumb-eu.123doks.com/thumbv2/123dok_br/15875049.1088543/39.892.261.642.761.998/figure-olap-cube-adapted-from.webp)
