Comparative Study of Amine Solutions used in CO
2Absorption/Desorption Cycles
SAMUEL PEREIRA DOS SANTOS
(Licenciado em Engenharia Química)
Trabalho Final de Mestrado para obtenção do grau de Mestre em Engenharia Química
Orientadores:
Doutor João Carlos Moura Bordado
Doutor João Fernando Pereira Gomes Júri:
Presidente:Doutor Manuel José de Matos Vogais:
Doutor João Carlos Moura Bordado Doutor João Fernando Pereira Gomes Doutor João Miguel Silva
Doutora Helena Teixeira Avelino
Setembro de 2013
ISEL
INSTITUTO SUPERIOR DE ENGENHARIA DE LISBOA
“The core of man’s spirit comes from new experiences”
Jon Krakauer
Acknowledgements
I would like to thank, in the first place, to my advisers, Professor João Gomes and Professor João Bordado, for giving me the opportunity to develop this work and for their continuous availability, encouragement and scientific guidance.
I particularly want to thank Professor Ana Paula Soares for the loan of the thermocouple in the early trials. Without the thermocouple, the early trials could not have been performed and the work would be delayed.
Really special thanks to all my laboratory colleagues on IST, in particular to Olga Ferreira, Helena Mota and Sandro Matos, for their fellowship, for the support that they provided and the great coexistence.
To my parents, my brother and his girlfriend Carla, and remaining family for the unconditional support and for all the strength and perseverance that was crucial throughout this work.
To all my friends who have being part of my life and been following the progress of this work, always with a kind word of encouragement, comfort and support.
ISEL, 2013 i
Abstract
The increasing concerns about climate change and global warming has increase the interest in reducing the emissions of greenhouse gases (GHG), mainly CO2. Thus, the chemical absorption of carbon dioxide by aqueous amine
solutions has been investigated over the last decades.
The studies were performed in two distinct stages. The first one was the preliminary trials. In these trials, the absorption of carbon dioxide and the solvent regeneration/release of carbon dioxide were performed. The second one consisted on the performance of carbon dioxide absorption in a pilot unit, with the aqueous amine solutions that showed the best results in the preliminary trials and the amine solutions that were to be tested in the previous work.
In the carbon dioxide absorption tests performed in the preliminary trials, the goal was to study the energy efficiency of each tested amine solution, i.e., at which temperature the solutions would start releasing the absorbed CO2. The
following aqueous amine solutions with a concentration of 20 % by weight were tested: isopropylamine, diisopropylamine, diethylamine, bis(2-ethylhexyl)amine, dimethylethanolamine (DMEA) and triethylamine. The isopropylamine aqueous solutions was not prepared, due to the fact that its boiling point temperature was around 31-33 ºC, which meant that during the solvent regeneration/release of carbon dioxide trials, It would be impossible to assure that if it was the release of carbon dioxide or the amine that was starting to boil. The remaining aqueous amine solutions were prepared. After they had been saturated with carbon dioxide, their physical state was verified. In the case of diisopropylamine aqueous solution, this amine was not soluble in water, but only miscible, which meant that when its carbamate was formed, it immediately precipitated. For bis(2-ethylhexyl)amine, this solution showed a blue coloration and two liquid phases: organic and aqueous. This was due to the fact the molecule of this amine was amphiphilic, meaning that it has hydrophilic and hydrophobic properties. Triethylamine was not completely soluble in water. DMEA, theoretically was soluble in water, been an alkanolamine, but it was not soluble in water. This could be due to the fact that it was from 2004 and it could have already been degraded. Diethylamine was the only amine that was completely soluble in water.
ISEL, 2013 ii Then, the tests of solvent regeneration/release of carbon dioxide were performed for all the aqueous amine solutions, except, isopropylamine and diisopropylamine. For the solutions of diethylamine and DMEA, the release of carbon dioxide was not observed. In the case of bis(2-ethylhexyl)amine, the release of carbon dioxide was observed for the temperature of 30 ºC for a period of 35 minutes. In the case of triethylamine, the release of carbon dioxide was observed for the temperature of 36 ºC for a period of 44 minutes.
In the carbon dioxide absorption tests performed in the pilot unit, the following aqueous amine solutions with a concentration of 10 % by weight were tested: diethylamine, monoethanolamine (MEA), piperazine (PZ) and ethanolamine (EDA). The tests were performed with an absorption time of 240 minutes (4 hours). The obtained results for the tested aqueous amine solutions were: 0.492 mol CO2/mol amine for the diethylamine aqueous solution, 0.409
mol CO2/mol amine for the MEA aqueous solution, 0.395 mol CO2/mol amine
for the PZ aqueous solution and 0.321 mol CO2/mol amine for the EDA
aqueous solution.
Then, the obtained results in this work were compared with the ones obtained in Santos (2012) [25], which were for N-methyldiethanolamine (MDEA) and diethanolamine (DEA) 10 % by weight aqueous solutions. The solutions used in Santos (2012) [25] showed a higher carbon dioxide loading capacity than the solutions used in this work. For the MDEA, the loading capacity was 1.020 mol CO2/mol amine and for DEA, the loading capacity was 0.982 mol
CO2/mol amine.
Lastly, a cost analysis was performed in other to see which one of the amines was the most economical solvent. After analyzing the carbon dioxide loading capacity and the price per liter for each one of the amine, it was concluded that DEA was the most economical solvent, with a loading capacity of 0.982 mol CO2/mol amine and price of 25.70 €/L.
Keywords: Carbon dioxide; Chemical absorption; Aqueous Amine Solutions;
Solvent Regeneration; Isopropylamine; Diisopropylamine; Diethylamine; Bis(2-ethylhexyl)amine; Triethylamine; DMEA; MEA; PZ; EDA; MDEA; DEA.
ISEL, 2013 iii
Resumo
O aumento das preocupações relacionadas com as alterações climáticas e com o aquecimento global tem aumentado o interesse na redução das emissões de gases de efeito de estufa (GEE), principalmente o CO2. Deste
modo, a absorção química do dióxido de carbono através de soluções aquosas de aminas tem sido alvo de estudos nas últimas décadas.
Os estudos foram realizados em duas etapas distintas. Numa primeira etapa realizaram-se os ensaios preliminares. Nestes ensaios, procedeu-se à absorção do dióxido de carbono e regeneração do solvente/libertação de dióxido de carbono. A segunda etapa consistiu na realização de ensaios de absorção de dióxido de carbono numa instalação-piloto, com as soluções aquosas de aminas que apresentaram os melhores resultados nos ensaios preliminares e com as soluções aminadas que eram para ter sido testadas no trabalho realizado anteriormente.
Nos testes de absorção de dióxido de carbono realizados nos ensaios preliminares, o objetivo era estudar a eficiência energética de cada uma das soluções aminadas, isto é, averiguar a que temperatura as soluções começavam a libertar o dióxido de carbono absorvido. As seguintes soluções aquosas de aminas com uma concentração de 20 % em massa foram testadas: isopropilamina, di-isopropilamina, dietilamina, bis(2-etilhexil)amina, dimetiletanolamina (DMEA) e trietilamina. No caso da isopropilamina, a sua solução aquosa não foi preparada pois a sua temperatura de ebulição rondava os 31-33 ºC, o que posteriormente nos ensaios de regeneração de solvente/libertação de dióxido de carbono tornaria impossível observar com certeza se seria o dióxido de carbono a ser libertado ou se seria a amina a entrar em ebulição. As restantes soluções aquosas de aminas foram colocadas dentro de um balão de três tubuladuras. Fez-se borbulhar o dióxido de carbono no interior das soluções, por via de um tubo de teflon, até que estas se encontrassem saturadas. Após a saturação das soluções aquosas de aminas, verificou-se o seu estado físico. No caso da solução aquosa de di-isopropilamina, concluiu-se que esta amina não era solúvel em água, mas sim miscível, pois observou-se à formação de um precipitado branco dentro da solução à medida que a amina ia reagindo com o dióxido de carbono. Este
ISEL, 2013 iv precipitado branco era o carbamato produzido pela reação entre a amina e o dióxido de carbono que, pelo facto de a amina ser somente miscível em água, não se conseguiu dissociar no bicarbonato correspondente, levando à sua precipitação. No caso da solução aquosa de bis(2-etilhexil)amina, esta apresentava uma coloração azulada e tinha uma separação entre a fase aquosa e a fase orgânica. Verificou-se que esta amina possuía uma molécula anfifílica, isto é, a molécula desta amina é constituída por uma secção hidrófila, que neste caso é o grupo amina, e por uma secção hidrofóbica, a cadeia alifática. Para a solução aquosa de trietilamina, verificou-se que esta amina não era completamente solúvel em água, pois observou-se a formação de uma fase aquosa e a formação de uma fase orgânica. Já com a solução aquosa de DMEA ocorreu algo de insólito. Teoricamente, a DMEA seria solúvel em água, tal como as outras alcanolaminas, mas neste caso, talvez pelo facto de ela ser de 2004 e de poder estar degradada, tal não se verificou. Ao se preparar esta solução aquosa, verificou-se que esta amina não era solúvel em água, pois mais uma vez, formou-se uma separação entre a fase aquosa e a fase orgânica. A única das aminas que era completamente solúvel em água era a dietilamina.
De seguida, foram efetuados os testes de regeneração de solvente/libertação de dióxido de carbono para todas as soluções aquosas, à exceção da solução de isopropilamina e a solução de di-isopropilamina, pelos motivos referidos anteriormente. Estes testes consistiam em aquecer as soluções aquosas de aminas que tinham sido saturadas com dióxido de carbono. Para tal utilizou-se uma placa de aquecimento (Agimatic-N, J. P. Selecta) para aquecer o banho de óleo para o aquecimento das soluções aquosas que se encontravam dentro do balão de três tubuladuras. Foi colocado no balão de três tubuladuras um adaptador para libertar o dióxido de carbono para dentro de uma tina com água, através de um tubo de borracha, e um termopar (Honeywell) para a saber qual era a temperatura da solução aquando do começo da libertação do dióxido de carbono. Para a solução aquosa de bis(2-etilhexil)amina, obteve-se uma temperatura de regeneração/ libertação de dióxido de carbono de 30 ºC e essa libertação durou cerca de 35 minutos. Pode-se concluir que, apesar de apresentar uma molécula anfifílica, a bis(2-etilhexil)amina conseguiu absorver e libertar o dióxido de carbono. O mesmo se
ISEL, 2013 v verificou para a solução aquosa de tretilamina, apesar de apresentar duas fases líquidas. A libertação de dióxido de carbono iniciou-se à temperatura de 36 ºC e durou cerca de 44 minutos. Para a solução aquosa de DMEA, não se observou qualquer libertação de dióxido de carbono, o que leva a concluir que não chegou sequer a ocorrer absorção do mesmo, pois sendo DMEA uma amina terciária é fulcral que esta seja solúvel em água, pois caso contrário a absorção de dióxido de carbono não ocorre. Por último, para solução aquosa de dietilamina, apesar de ser a única que foi completamente solúvel em água, não se observou qualquer libertação de dióxido de carbono. Isto pode ter ocorrido devido ao facto de se ter formado sais estáveis ao aquecimento (HSS) o que torna impossível a libertação do dióxido de carbono absorvido.
Nos testes de absorção de dióxido de carbono efetuados na instalação-piloto, as seguintes soluções aquosas de aminas com uma concentração de 10 % em massa foram testadas: dietilamina, monoetanolamina (MEA), piperazina (PZ) e etanolamina (EDA). A solução aquosa de dietilamina foi também utilizada nestes testes pois, apesar de não ter sido capaz de libertar o dióxido de carbono absorveu, foi a única das aminas testadas nos ensaios preliminares que apresenta uma completa solubilidade em água. Realizaram-se na instalação-piloto, ensaios de absorção com um tempo de absorção de 240 minutos (4 horas). A cada 30 minutos, uma amostra de 20 mL proveniente da coluna de absorção, era retirada através de uma válvula instalada para esse efeito. As amostras foram posteriormente analisadas pelo método de precipitação. Este método permitiu a quantificação do dióxido de carbono absorvido através da adição em excesso de soluções de NaOH e BaCl2.2H2O
com a concentração de 1.0 molar. Essa quantificação foi apresentada através do número de moles de dióxido de carbono presentes em cada mol de amina. Os resultados obtidos para as soluções aquosas testadas foram: 0,492 mol CO2/mol amina para a solução de dietilamina, 0,409 mol CO2/mol amina para a
solução de MEA, 0,395 mol CO2/mol amina para a solução de PZ e 0,321 mol
CO2/mol amina para a solução de EDA.
De seguida, comparou-se os resultados obtidos neste trabalho com os resultados obtidos anteriormente para a mesma concentração de aminas em Santos (2012) [25], onde foram utilizadas soluções aquosas de N-metildietanolamina (MDEA) e dietanolamina (DEA). Concluiu-se que essas
ISEL, 2013 vi soluções aquosas de aminas apresentavam valores de capacidade de carga em dióxido de carbono superiores aos registados para as soluções aquosas deste trabalho, sendo que a solução aquosa de MDEA obteve uma capacidade de carga de 1,020 mol CO2/mol amina e a solução aquosa de DEA obteve uma
capacidade de carga de 0,982 mol CO2/mol amina.
Por fim, foi feita uma análise económica aos custos associados à compra de cada litro de amina em relação à capacidade de carga em dióxido de carbono. Após a comparação entre as capacidades de carga em dióxido de carbono e o seu preço por litro, concluiu-se que a amina que aparenta ser a mais económica de entre as seis consideradas foi a DEA, com uma elevada capacidade de carga em dióxido de carbono e o preço por litro mais baixo de todas elas (25,70 €/L).
Palavras-chave: Dióxido de carbono; Absorção química; Soluções aquosas de
aminas; Regeneração de solvente; Isopropilamina; Di-isopropilamina; Dietilamina; Bis(2-etilhexil)amina; Trietilamina; DMEA; MEA; PZ; EDA; MDEA; DEA.
ISEL, 2013 vii
Table of Contents
Abstract. ... i
Resumo ... iii
Table of Contents ... vii
List of Figures ... viii
List of Tables ... x
List of Acronyms ... xi
1. Introduction ... 1
1.1. Carbon Capture and Storage (CCS) technology ... 6
1.2. Chemical absorption ... 13 1.2.1. Amine chemistry ... 13 1.2.2. Process description ... 16 2. Experimental ... 22 2.1. Preliminary trials ... 22 2.1.1. Experimental procedure ... 22
2.1.2. CO2 absorption using amine solutions ... 27
2.1.3. Regeneration of the CO2 saturated aqueous amine solutions ... 28
2.2. Pilot unit ... 29
2.2.1. Assembly of the sampling valve downstream the absorption column ... 29
2.2.2. Studies of CO2 absorption in amine solutions ... 30
3. Results and Discussion ... 38
3.1. Preliminary trials ... 38
3.1.1. CO2 absorption using amine solutions ... 38
3.1.2. Regeneration of the CO2 saturated aqueous amine solutions ... 41
3.1.3. Studies of CO2 absorption in amine solutions ... 43
3.1.4. Comparison with the obtained results from the earlier performed tests .. 46
3.1.5. Cost analysis ... 49
4. Conclusions ... 51
4.1. Preliminary trials ... 51
4.2. Pilot unit ... 52
5. Perspectives for Future Work ... 54
6. References ... 55
ISEL, 2013 viii
List of Figures
Figure 1 – Carbon dioxide molecule ... 2
Figure 2 – Schematic representation of the flows of energy between outer space, the atmosphere and Earth’s surface. ... 4
Figure 3 – Atmospheric CO2 concentrations during 1000-1997 based on the analysis of ice cores and measured atmospheric CO2 concentrations during 1958-2004. ... 5
Figure 4 – Block diagram showing post-combustion, pre-combustion and oxy-combustion ... 6
Figure 5 – Carbon Capture and Storage technological options ... 7
Figure 6 – Options for carbon dioxide sequestration. ... 10
Figure 7 –Purified and liquefied CO2 storage tanks in the Coca-Cola factory in Jundiaí, Brazil ... 13
Figure 8 – Amines molecular structures: a)primary (MEA) b) secondary (DEA) c)tertiary (MDEA) d)sterically hindered (PZ) ... 14
Figure 9 – Process diagram for CO2 absorption, using amines, with the respective temperatures and reactions ... 16
Figure 10 – Process flow diagram of stripping column. ... 17
Figure 11 – Energy dissipaters in a conventional process for CO2 capture... 18
Figure 12 – Mechanism of oxidative degradation of MEA ... 20
Figure 13 – Molecular structure of isopropylamine. ... 23
Figure 14 – Molecular structure of diisopropylamine. ... 23
Figure 15 – Molecular structure of diethylamine. ... 24
Figure 16 – Molecular structure of bis(2-ethylhexyl)amine... 25
Figure 17 – Molecular structure of dimethylethanolamine. ... 25
Figure 18 – Molecular structure of triethylamine. ... 26
Figure 19 - Illustration of experimental tests carried out to study the absorption of CO2 from aqueous amines solutions (diethylamine aqueous solution). ... 27
Figure 20 - Illustration of experimental tests performed to regenerate amines from aqueous solutions saturated with CO2. ... 28
ISEL, 2013 ix
Figure 22 – Pilot unit flowsheet. ... 30
Figure 23 – Molecular structure of MEA. ... 31
Figure 24 – Molecular structure of EDA. ... 32
Figure 25 – Molecular structure of PZ. ... 32
Figure 26 – Pilot unit. ... 34
Figure 27 – Detail of the pilot unit. ... 35
Figure 28 –Amine aqueous solution with two liquid phases during the saturation with CO2. ... 38
Figure 29 – Reaction sequence for the capture of carbon dioxide by using aqueous solutions of primary and secondary amines. ... 39
Figure 30 – Obtained results for CO2 loading capacity over the absorption time for the tested aqueous amine solutions (10 % (w/w)). ... 45
Figure 31 – Comparison of the obtained results for CO2 loading capacity over the absorption time for all the tested aqueous amine solutions (10 % (w/w)). ... 48
ISEL, 2013 x
List of Tables
Table 1 – World energy use, population and per capita in 1900 and 2001. ... 1
Table 2 – Main sources of carbon dioxide emissions ... 3
Table 3 – Comparison of available technology options for carbon dioxide capture and separation. ... 8
Table 4 – Current status of CO2 uses in various industrial applications. ... 11
Table 5 – Structural properties of isopropylamine. ... 22
Table 6 – Structural properties of diisopropylamine. ... 23
Table 7 – Structural properties of diethylamine. ... 24
Table 8 – Structural properties of bis(2-ethylhexyl)amine ... 24
Table 9 – Structural properties of dimethylethanolamine. ... 25
Table 10 – Structural properties of triethylamine. ... 26
Table 11 – Structural properties of MEA. ... 31
Table 12 – Structural properties of EDA. ... 31
Table 13 – Structural properties of PZ. ... 32
Table 14 – Obtained results in the experimental tests carried out for studying the regeneration of the CO2 saturated aqueous amine solutions. ... 41
Table 15 – Obtained results for CO2 absorption by aqueous amine solutions (10 % (w/w)) using the precipitation method. ... 44
Table 16 – Results in absorption of CO2 by each aqueous amine solution at 10% (w/w) by the method of precipitation of the samples. ... 47
ISEL, 2013 xi
List of Acronyms
CAPEX Capital Expenditure
CCS Carbon Capture and Storage
CFC Chlorofluorocarbon
DEA Diethanolamine
DMEA Dimethylethanolamine
ECBM Enhanced Coal Bed Methane
EDA Ethanoldiamine
EOR Enhanced Oil Recovery
GHG Greenhouse Gases
HEED N-(2-hydroxyethyl-)ethylenediamine
HSS Heat Stable-salts
IEA International Energy Agency
IPCC Intergovernmental Panel on Climate Change
MDEA N-methyldiethanolamine
MEA Monoethanolamine
OPEX Operational Expenditure
PSA Pressure Swing Absorption
PZ Piperazine
TSA Temperature Swing Absorption
UN United Nations
ISEL, 2013 1
1. Introduction
In the history of civilizations, the 20th century can be characterized as a
century of explosive growth in energy consumption and a rapid increase in population worldwide along with unprecedented pace of inventions and new technologies and ever-increasing expansion of manmade materials. One of the greatest revolutions in the 20th century is related with transport systems.
Inventions of cars, trucks and airplanes along with engine-powered trains and ships have created a completely new world that has become increasingly dependent on the combustions of hydrocarbonated fuels, such as gasoline, diesel fuel and kerosene (jet fuel). Inventions of electrical power plants, electric home appliances, personal computers and mobile cell phones have electrified the world, which is increasingly dependent on the electricity, which is largely generated from carbon-based resources such as coal and natural gas. Development of processes such as the high-pressure ammonia synthesis, as well as the development of the chemical fertilizers containing nitrogen, phosphorus and potassium, and also the engine-based machinery for crop production fueled the rapid growth of the global population, thus increasing the energy demand. [1]
Table 1 – World energy use, population and per capita in 1900 and 2001. [2]
Energy sources 1900 Use 2001 Use
MTOEa % or Unit MTOEa % or Unit
Coal 501 55 2395 24 Petroleum 18 2 3913 39 Natural gas 9 1 2328 23 Nuclear 0 0 662 6 Renewablesb 383 42 750 8 Total 911 100% 1004.8 100%
Population 1762 Million 6153 Million
Per Capita Energy use 0.517 TOEa 1.633 TOE
Global CO2 emissions 534 MTCEa 6607 MTCE
Per capita CO2 emission 0.30 TCEa 1.07 TCE
Atmospheric CO2 295 ppmva 371 ppmv
Life expectancy 47.3 Years 77.2 Years
a TOE: Ton oil equivalent; MTOE: million ton of oil equivalent; MTCE: million ton of carbon
equivalent; TCE: ton of carbon equivalent; ppmv: part per million by volume. b including
ISEL, 2013 2 The above table shows a comparison between energy use, population and per capita consumption in 1900 and 2001. Currently over 85 percent of the world energy demand is supplied by fossil fuels. Fossil-fueled power plants are responsible for roughly 40 percent of total CO2 emissions, with coal-fired power
plants being the main contributor. Environmental issues due to emissions of pollutants from combustion of solid, liquid and gaseous fuels in various stationary and mobile energy systems as well as the emissions from manufacturing plants have also become major global problems involving not only pollutants such as SOx, NOx and particulate matter, but also greenhouse
gases (GHG) such as carbon dioxide (CO2) and methane (CH4). There are
increasing concerns related with global climate change and, thus, promoted interest, worldwide, in the reduction of GHG emissions, particularly of CO2.[1][2]
Carbon dioxide is a colorless and odorless gas. The molecule is linear with a double bond between the carbon and oxygen atoms.
Figure 1 – Carbon dioxide molecule.[3]
CO2 occurs freely in nature and acts as a source of carbon for
photosynthesis of plants, algae and some bacteria. Combustion of most carbon-containing substances produces CO2. Today energy utilization in modern
societies is based largely on the combustion of fuels composed by hydrocarbons, which are mainly: coal, petroleum and natural gas. The complete oxidation, that is the combustion, of any carbon-based organic matter produces CO2, but, until recently, carbon dioxide was, generally, thought to be harmless.
In fact, carbon dioxide plays an important role in the Earth’s carbon cycle and is a necessary component in the life cycle of animals and plants. [1]
ISEL, 2013 3
Table 2 – Main sources of carbon dioxide emissions. [1]
Stationary sources Mobile sources Natural sources
Fossil fuel-based electric power plants Cars and sport utility
vehicles Humans
Independent power producers Trucks and buses Animals
Manufacturing plants in industry a Aircrafts Plants and animals
decay
Commercial and residential buildings Trains and ships Land
emission/leakage Flares of gas at natural gas and
petroleum extraction fields Construction vehicles Volcano
Military and government facilities Military vehicles &
devices Earthquake
a Major concentrated CO2 sources include plants for manufacturing hydrogen, ammonia,
cement, limestone and soda ash as well as fermentation processes and chemical oxidation processes
Analyzing the studies performed over the past five decades, particularly during the past 15 years, it is believed that increased GHG levels in atmosphere can cause global warming.[2]
Among GHG, CO2 is the largest contributor, accounting to about 60 percent
of the global warming effects, which is due to its high amount in the atmosphere[2], although methane and chlorofluorocarbons (CFC’s) have much
higher greenhouse effect per mass of gases. Nowadays there are increasing concerns regarding global warming caused by GHG, particularly CO2: the
International Panel on Climate Change (IPCC) predicts that, by the year 2100, the atmosphere may contain up to 570 ppmv of CO2, causing an increase of the
average global temperature of around 1.9 ºC and an increase in the average sea level of 38 m. [2]
ISEL, 2013 4
Figure 2 – Schematic representation of the flows of energy between outer space, the
atmosphere and Earth’s surface. [3]
These effects can also be accompanied by the extinction of some living species. The total amount of carbon on Earth is constant and its distribution among lithosphere, atmosphere and biosphere was relatively balanced until the beginning of the era of industrialized civilization. Since then, the carbon dioxide concentration has been continuously increasing. [2]
The following figure shows the change on the atmospheric carbon dioxide level over the years between 1000 and 1997 and also the actual CO2 level
during the period 1958-2004. CO2 level increased from 280 ppmv in 1000 to 295
ppmv in 1900. These values were based on data collected from ice cores in Antarctica. It increased to 315 ppmv in 1958 and further to 377 ppmv in 2004, and these values are based on data measured in Mauna Loa, Hawaii. [2]
ISEL, 2013 5
Figure 3 – Atmospheric CO2 concentrations during 1000-1997 based on the analysis of
ice cores and measured atmospheric CO2 concentrations during 1958-2004. [2]
In order to diminish global warming, the recognition of the carbon dioxide as the main responsible for the global warming problem has prompted the United Nations (UN) to call for several international forums on climatic changes, with the aim to regulate carbon dioxide emissions in all developed and under development countries. The Kyoto Protocol, which resulted from one of the most important international forums held in Kyoto, Japan in 1997, involved 37 industrialized nations and the European Union, which agreed to reduce their greenhouse gas emissions to a level of 5.2 percent, on average, lower than those of 1990 for the period of 2008-2012. The Copenhagen Agreement also requests the global temperature increase to be limited to ± 2 ºC above the pre-industrial level by 2100.[4][5]
ISEL, 2013 6 1.1. Carbon Capture and Storage (CCS) technology
The International Energy Agency (IEA) pointed out that in order to achieve the goal of ± 2 ºC above the pre-industrial level, it is required to of CO2 Capture
and Storage technology and its contribution, to reduce global emissions, would be around 19 percent in 2050.[5] In a global context, among all the industries
emitting CO2, fossil-fueled power plants generate the largest amount of CO2
emissions and that accounts for about 33-40 percent of the total. Besides power plants, the Steam Reforming facilities from petroleum refineries are also responsible for a considerable share of the total carbon dioxide emissions, although in a smaller scale. CCS would permit the continuing use of coal and other fossil fuels for power generation while significantly reducing GHG emissions.[5] [6]
The current leading carbon capture technologies, developed for power plants, can be divided in three methods which are characterized according to how or where the carbon dioxide is removed. These methods are called post-combustion capture, Oxyfuel post-combustion capture and pre-post-combustion capture.
[7]
Figure 4 – Block diagram showing post-combustion, pre-combustion and
ISEL, 2013 7 Post-combustion capture means that the carbon dioxide is captured from the flue gas of a conventional power plant. This method has an additional advantage of being used to capture carbon dioxide in industrial application for decades, although on a smaller scale than required for actual power plants. This makes post-combustion capture methods a prime candidate for many CCS applications. The other important advantage is it can be installed as a retrofit to existing power plants which significantly reduces the investment costs. [7]
Pre- or post-combsution CO2
separation and capture from gaseous mixtures like syngas of
flue gas
Technology options to
capture CO2 as a
concentrated stream from fossil-fuel-based power plants
Air separation followed by oxy-fuel combustion to obtain concentrated CO2 stream
Absorption Adsorption Membranes Cryogenics
PSA TSA Chemical Physical MEA Caustic Others Selexol Rectisol Others Adsorber Beds Alumina Zeolite Activated C Regeneration Method Gas Separation Gas Absorption Ceramic Based Systems Microbial/Algal Systems Washing
Figure 5 – Carbon Capture and Storage technological options. [9] [10]
The separation of CO2 into a pure stream (>95 percent) can be achieved
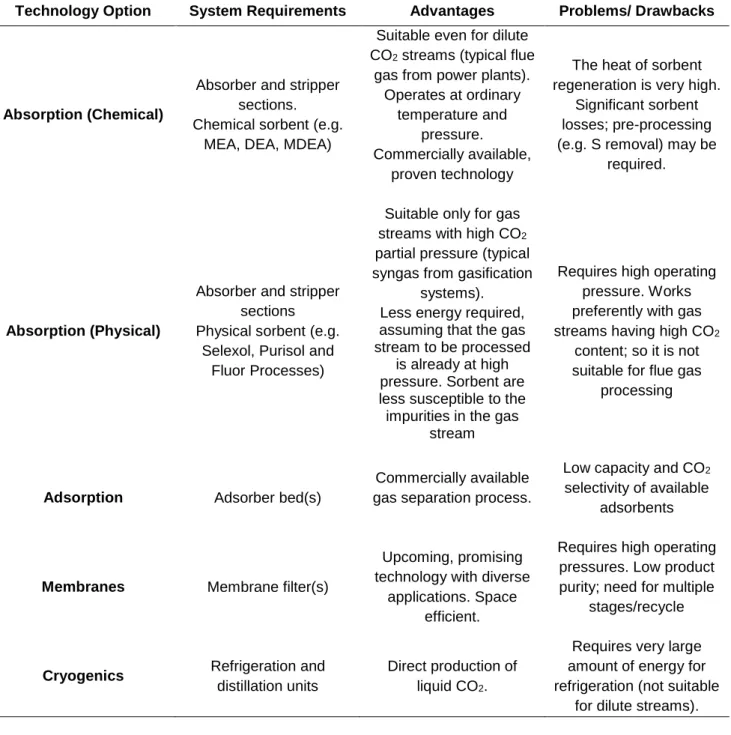
by a variety of techniques. Basically, there are six methods suitable for gaseous component capturing, which are, absorption, adsoprtion, permeation through a
ISEL, 2013 8 membrane, chemical conversion to another compound, condensation and cryogenics. From these unit operations, absorption is nowadays the most important one. During the absorption process, the gas to be treated is put in contact with a liquid stream and the gaseous components are transferred into the liquid phase (solvent) in which they are soluble. [9] [11] [12]
Table 3 – Comparison of available technology options for carbon dioxide
capture and separation. [9]
Technology Option System Requirements Advantages Problems/ Drawbacks
Absorption (Chemical)
Absorber and stripper sections. Chemical sorbent (e.g.
MEA, DEA, MDEA)
Suitable even for dilute CO2 streams (typical flue
gas from power plants). Operates at ordinary
temperature and pressure. Commercially available,
proven technology
The heat of sorbent regeneration is very high.
Significant sorbent losses; pre-processing (e.g. S removal) may be
required.
Absorption (Physical)
Absorber and stripper sections Physical sorbent (e.g.
Selexol, Purisol and Fluor Processes)
Suitable only for gas streams with high CO2
partial pressure (typical syngas from gasification
systems). Less energy required, assuming that the gas stream to be processed
is already at high pressure. Sorbent are less susceptible to the impurities in the gas
stream
Requires high operating pressure. Works preferently with gas streams having high CO2
content; so it is not suitable for flue gas
processing
Adsorption Adsorber bed(s)
Commercially available gas separation process.
Low capacity and CO2
selectivity of available adsorbents
Membranes Membrane filter(s)
Upcoming, promising technology with diverse
applications. Space efficient.
Requires high operating pressures. Low product purity; need for multiple
stages/recycle
Cryogenics Refrigeration and
distillation units
Direct production of liquid CO2.
Requires very large amount of energy for refrigeration (not suitable
ISEL, 2013 9 There are two types of absorption methods: physical and chemical absorption. Depending on the mechanism binding the gas compounds in solvent, one can distinguish between physical and chemical absorption. [11]
Once the CO2 is captured, it needs to be securely stored (sequestered).
Again, there are a wide range of options potentially available for CO2 capture,
as shown in Figure 6.[8] [9]
Geologic formations including deep saline reservoirs, depleted oil and gas wells, and non-mineable coal seams are some of the potentially attractive disposal sites. Among these options, there is the Enhanced Oil Recovery (EOR) and the Enhanced Coal Bed Methane (ECBM). EOR consists in the injection of carbon dioxide into the oil well, reducing oil surface tension and at the same time increasing its density, thus increasing the efficiency of oil extraction in the well. ECBM consists in the injection of carbon dioxide into the coal deposits. The coal will adsorb preferentially carbon dioxide, thereby releasing the existing methane from coal deposits. [8] [13][14]
These options can bring revenue as well, as they lead to the production of valuable products like oil and methane, respectively. Ocean storage is another option currently being studied.[8]
The distance to a secure storage site, the availability and cost of the transportation infrastructure, and the regulatory framework will affect the choice of disposal option. In general, studies indicate that geologic formations are the most plentiful and attractive for U.S. power plants. While economic cost of CO2
storage appears to be reasonable, its social and political acceptability are not yet clear, especially when compared to ocean sequestration. In fact, there are still a number of issues related to geologic sequestration of CO2, including
potential sites, storage capacities, environmental impacts, monitoring requirements and leakage.[9]
ISEL, 2013 10 CO2 Storage Options Geological Sequestration Ocean Sequestration Biological
Sequestration Other Methods
Deep Saline Reservoirs
Enhanced Oil Recovery (EOR)
Enhanced Coal Bed Methane (ECBM)
Depleted Oil and Gas Wells
Very Deep Ocean Injection
Unconfined Release (at~1000 m)
Dense Plume Formation (shallow)
Dry Ice Injection
Forests and Terrestrial Systems Marine Algae Storage as a solide in an Insulated Repository Utilization Schemes (e.g. Polymerization)
Figure 6 – Options for carbon dioxide sequestration. [9]
Another alternative is the recycling of the captured CO2, since carbon
dioxide has long been identified as renewable carbon feedstock (being nontoxic, highly abundant and economical) to access fine and commodity chemicals. However, there are only a handful of large scale industrial processes which actually use CO2 as a raw material. A number of these rely on the
physicochemical properties of carbon dioxide, such as the use of supercritical CO2 as solvent (in particular extraction processes such as decaffeination or
recovery of essential oils). [15]
The potential advantages of using CO2 as a chemical feedstock are as
follows:
1. It is relatively cheap, highly abundant and could be used to replace toxic chemicals, such as phosgene, or depleting resources, such as petrochemicals.
2. Can be transformed into totally new materials, such as new polymers, which are still difficult to produce from conventional petrochemicals.
ISEL, 2013 11 3. Can be transformed using efficient and economical routes (i.e. catalytic
processes).
4. Although the impact on global CO2 concentrations resulting from its
transformation into products (e.g. chemicals, polymers, fuels) may be modest, the products are expected to significantly improve the economics of carbon capture and storage.[15]
Table 4 lists the existing and emerging applications of CO2 in liquid, solid
and gaseous forms. Currently, CO2 is used as a refrigerant for food
preservation, a beverage carbonation agent, a supercritical agent, an inert medium (such as fire extinguisher), a pressurizing agent, a chemical reactant (urea, etc.), a neutralizing agent and as gas suitable for use in greenhouses. [15]
Table 4 – Current status of CO2 uses in various industrial applications. [1]
Sectors Industrial applications
Chemicals
CO2 is used in chemical synthesis and for controlling reactor temperatures.
CO2 is employed to neutralize alkaline effluents.
CO2 is used as a blowing agent for polyurethane and polystyrene foam
production and for blow molding manufacturing of plastic bottles and containers.
CO2 is used under supercritical conditions for purifying or dying polymer,
animals or vegetable fibers.
Pharmaceuticals
CO2 is used for producing chemicals such as salicylic acid and Aspirin; for use
as an inert gas and for supercritical fluid extraction.
CO2 is used for product transportation at low temperature (-78 ºC) and also
acidification (pH) of wastewater.
Foodstuffs
Liquid CO2 canbe used as cryogenic fluid in chilling or freezing operations or as
dry ice for temperature control during the storage and distribution of foodstuffs. Packaging of foodstuffs to increase the shelf life of many food products due to its inertizing properties and growth inhibiting effect on micro-organisms. Stunning of pigs and poultry in slaughterhouses instead of using electrical stunning.
Beverage
Carbonation of beverages such as soft drinks, mineral water or beer;
Supercritical CO2 is used to remove caffeine from coffee beans by extraction.
CO2 is used as shielding gas for preserving drinking quality and propellant gas
for emptying tanks of beverages
CO2 is also used in drinking water treatment in modern waterworks together
ISEL, 2013 12
Continuation of Table 4 – Current status of CO2 uses in various industrial
applications [1]
Healthcare
CO2 produces close-to-physiologic atmospheres for the operation of
artificial organs.
CO2 is used as a component in a mixture of oxygen or air as respiratory
stimulant to promote deep breathing.
It is also used for the surgical dilation by intra-abdominal insufflations.
Environment
Small amount of liquid CO2 can be used in recycling mechanical of
waters from Acid Mine Drainage.
Waste water treatment and waste liquid treatment by injection of CO2
for the pH of liquid effluents. CO2 is an excellent alternative to sulfuric
acid for pH balance control.
Pulp and paper
CO2 enables sharp tuning of the pH of recycled mechanical or chemical
after an alkaline bleaching.
CO2 can be used in the Tall Oil neutralization and for increasing the
performance of paper machines.
Precipitated calcium carbonate obtained from CO2 e CaO is used as a
whitener for the paper industry.
Electronics
CO2 is usually used as a cooling medium in environmental testing of
electronic devices.
CO2 can be used to add conductivity to ultrapure water.
CO2 can also be used as an environmentally friendly supercritical fluid
for removing photo-resist from wafers.
Metals industry
CO2 is typically used as an inert gas or for environment protection.
CO2 is used for red fume suppression during scrap and carbon
charging, for nitrogen pick-up reduction during tapping and for bottom stirring.
CO2 is used for fume suppression during ladle transfer of matte (Cu/Ni
production) or bullion (Zn/Pb production) in the non-ferrous metallurgy. Special grades of CO2 are used in CO2 lasers.
Laboratory &analysis
Supercritical CO2 is the mobile phase in both supercritical
chromatography and extraction applications.
Safety and others CO2 is used as carbon dioxide snow for fire extinguishers; pH control
and regulation of waste waters, swimming pools, etc.
A particular example of an industrial application of the captured CO2 is
the Messer plant in a bottling facility of Coca-Cola in the city of Jundiaí, Brazil. CO2 is extracted from the waste gases from the factory power plant, in a
ISEL, 2013 13 chemical absorption facility using amine solutions. The CO2 is further purified
and liquefied to food grade quality and used to carbonize the soft drinks. [16]
Figure 7 –Purified and liquefied CO2 storage tanks in the Coca-Cola factory in Jundiaí,
Brazil. [16]
1.2. Chemical absorption
The concept of separating CO2 from flue gas streams started in the 70s, not
due to the concern about the greenhouse effect, but as a potentially economic source of CO2, mainly for enhanced oil recovery (EOR) operations. Several
commercial CO2 capture were constructed in the U.S. in the late 70s and early
80s. CO2 was also produced for other industrial applications such as
carbonation of brine and production of products such as dry ice, urea and beverages. Some of these CO2 capture plants are still in operation today, but all
these plants are much smaller than a typical power plant. Chemical absorption is a well-known technology and it has been widely deployed on a large scale across several industries. [10][15]
1.2.1. Amine chemistry
It is the solvent chemistry that determines the type and seriousness of any environmental and public health impacts associated with fugitive emissions of organic solvents, or of the products resulting from solvent degradation or solvent-induced equipment corrosion. Therefore, the selection of appropriate solvents for use in these processes is far from being a simple task.[15]
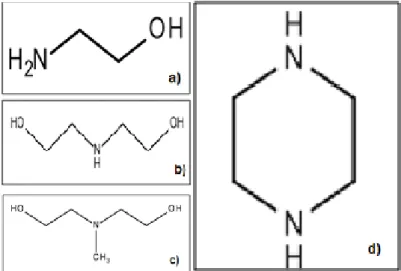
ISEL, 2013 14 In terms of solvent selection, amines have traditionally been the solvents of choice, with a primary alkanolamine, monoethanolamine (MEA) typically considered as the benchmark solvent to which alternative solvents must be compared. Other compounds that are often considered are sterically hindered compounds such as piperazine (PZ); secondary amines such as diethanolamine (DEA) and tertiary amines such as methyldiethanolamine (MDEA). [15]
Figure 8 – Amines molecular structures: a) primary (MEA) b) secondary (DEA) c)
tertiary (MDEA) d) sterically hindered (PZ). [17]
One of the major disadvantages of using MEA is related with its high energy requirements for CO2 capture when compared to DEA and MDEA. The major
setback is that MEA has a limitation that its maximum CO2 loading capacity,
based on stoichiometry, is about 0.5 mol CO2/mol amine, unlike tertiary amine
such as MDEA, which has an equilibrium CO2 loading capacity nearly of 1.0 mol
CO2/mol amine. [18]
The reactive nature of the aqueous amine solutions with CO2 is well known,
and there is considerable experimental and theoretical work done detailing the mechanism and rates of these reactions. In addition to the ionic formation equilibrium owing to the dissociation of CO2 and the amines in aqueous
solution, the principal reaction of interest between CO2 and a primary or
secondary amine (in water) is the formation of a carbamate, which is typically considered to occur via the formation of a “zwitterion”. Combining these two reactions can be represented as: [15]
ISEL, 2013 15 𝑅𝑅′𝑁𝐻 + 𝐶𝑂
2 ⇋ 𝑅𝑅′𝑁𝐻+𝐶𝑂𝑂−(𝑍𝑤𝑖𝑡𝑡𝑒𝑟𝑖𝑜𝑛) (1)
The “zwitterions” mechanism originally proposed by Caplow in 1958 and reintroduced by Danckwerts in 1979, is generally accepted as the reaction mechanism for the carbamate formation between CO2 with primary and
secondary amines. [19]
The subsequent removal of the proton by base B, which can be an amine, is as follows:
𝑅𝑅′𝑁𝐻+𝐶𝑂𝑂−+ 𝑅𝑅′𝑁𝐻 ⇋ 𝑅𝑅′𝑁𝐶𝑂𝑂−(𝐶𝑎𝑟𝑏𝑎𝑚𝑎𝑡𝑒) + 𝑅𝑅′𝑁𝐻
2+ (2)
Then, the overall reaction is: [5]
2𝑅𝑅′𝑁𝐻 + 𝐶𝑂
2 ⇋ 𝑅𝑅′𝑁𝐶𝑂𝑂−+ 𝑅𝑅′𝑁𝐻2+ (3)
𝑅𝑅′𝑁𝐶𝑂𝑂−+ 𝐻2𝑂 ⇋ 𝑅𝑅′𝑁𝐻 + 𝐻𝐶𝑂3− (4)
Other important reactions, which contribute to the overall reaction, are the reversion of carbamate to bicarbonate via a hydrolysis reaction and the formation of bicarbonate.[15]
𝑅1𝑅2𝑁𝐶𝑂2−+ 𝐻2𝑂 ⇌ 𝑅1𝑅2𝑁𝐻 + 𝐻𝐶𝑂3− (5)
𝐶𝑂2+ 𝑂𝐻− ⇌ 𝐻𝐶𝑂
3− (6)
In the case of non-sterically hindered compound, the reversion of carbamate to bicarbonate by chemical reaction is considered to occur only at high CO2
concentrations in the liquid phase. In the case of a sterically hindered compound such PZ, the reaction is particularly important, as the presence of the methyl group significantly reduces the stability of the carbamate bond, resulting in the preferred formation of the bicarbonate, leading to the particularly high loading capacity of this solvent. [15]
The mechanism involved in the absorption of CO2 by aqueous solutions of
tertiary amines, such as MDEA, are somewhat different to those of primary and secondary amines as they do not react directly with CO2. In fact, they act as a
base, catalyzing the hydration of CO2. Thus the reaction of interest in aqueous
ISEL, 2013 16 𝐶𝑂2+ 𝐻2𝑂 + 𝑅1𝑅2𝑅3𝑁 ⇌ 𝑅1𝑅2𝑅3𝑁𝐻++ 𝐻𝐶𝑂
3− (7)
1.2.2. Process description
Technologically, a typical chemical absorption process consists of an absorber and a stripper, in which the absorbent is thermally regenerated. In a chemical absorption process, the flue gas containing CO2 enters a packed bed
absorber from the bottom and contacts counter-currently with a CO2-lean
absorbent. After absorption, the CO2-rich absorbent flow into a stripper for
thermal regeneration. After regeneration, the CO2-lean absorbent is pumped
back to the absorber cyclic use. The pure CO2 released from the stripper is
compressed for the subsequent transportation and storage. The operation pressure is around 1 bar and the temperatures in the absorber and stripper are usually in the ranges of 40-60ºC and 120-140ºC, respectively. [5]
Figure 9 – Process diagram for CO2 absorption, using amines, with the respective
temperatures and reactions. [20]
The term “lean” refers to the fact that the solvent stream entering at the top of the column contains little or none of the components that are meant to be absorbed. In the context of CO2 capture, this means that the mole fraction of
CO2 in the liquid phase is small. Once the solvent stream reaches the bottom of
ISEL, 2013 17 regeneration process, consisting of a further gas-liquid contacting column with a reboiler at the bottom and a condenser at the top.[15]
For the de-absorption process, a “rich” stream of amine and CO2 from the
absorption column is pumped to the top of the stripping column, where it flows down over the packing within the stripping column. Stripping steam from the reboiler enters the column at the bottom and flows up the column in a counter-current flow arrangement. As the “rich” liquid flows down the column, the chemical reactions act as the reverse reaction and release CO2 into the
aqueous solution, which then diffuses into the gas phase. The “lean” amine solution exits at the bottom of the stripping column and is returned to the absorption process. [12]
A percentage of the “lean” amine solution is directed to the reboiler to provide the stripping steam for the process. The condenser cools the outgoing gas and thus reduces the water content and up-concentrates the amount of CO2. Typically, the captured CO2 requires more post processing treatment such
as dehydration and compression. [15]
Figure 10 – Process flow diagram of stripping column. [12]
In these systems, the major part of the operational costs is caused by the solvent regeneration (up to 40 percent). The regeneration process is usually done at an excess temperature its boiling temperature, as the chemical kinetics
ISEL, 2013 18 of regeneration increases with temperature. The energy consumption, in the stripping column, is estimated to be 15-30 percent of the net power production of a coal-fired power plant, considering about 90 percent of CO2 being removed. [21]
Figure 11 – Energy dissipaters in a conventional process for CO2 capture. [22]
The development of improved solvents with lower regeneration energy requirements can, therefore be identified as the highest priority in R&D objective for amine-based CO2 capture systems. Such improvements are needed to
reduce the too high-energy consumption of current systems, which makes them less competitive. [21]
Mixed amines have been reported to maximize the desirable properties of the individual amines. The use of mixed amines consist in having a solution formed of tertiary and primary or tertiary plus secondary amines, that uses much of the reactivity of primary amines or secondary amines at similar or reduced circulation rates, but offers low regeneration costs similar to those of tertiary amines. There are reports of substantial reduction in energy requirements and modest reduction in circulation rates for amine blends relative to the corresponding single amine systems of similar total amine concentration.
[2]
This technology option has the inherent advantage that it is an “end-of-pipe” technology. Moreover, its addition to power plants, either as a retrofit or as a
ISEL, 2013 19 new build, will not unduly affect the flexibility of operation demanded for these facilities.[15]
However, as with all of the proposed capture technologies show in Table 3, chemisorption processes have the distinct disadvantage of their cost, both investment costs (CAPEX) and also operation costs (OPEX) associated with its implementation and operation. In the case of chemical absorption process, it is anticipated that the deployment of this technology will result in a reduction of the thermal efficiency of a modern power plant from approximately 45 percent to approximately 35 percent. This efficiency penalty accounts for the cost of solvent regeneration, CO2 compression and transport as well as the additional
costs associated with transporting flue gases and solvents. Moreover, owing to the low CO2 partial pressure in the flue gas, relatively high solvent flow rates are
required to achieve a high rate of CO2 capture. [15]
One drawback of this process is the susceptibility of amines to thermal and oxidative degradation. This amine breakdown deteriorates the performance of the amine in the absorption process. Not only does it reduce the CO2 removal
capacity, but also, corrosion and foaming are induced due to the presence of degradation products. This obviously leads to significant costs associated with the solvent make-up. [15] [18]
Oxidative degradation has been extensively investigated in literature, particularly for alkanolamines. Here, the main degradation products are volatile compounds, amines, aldehydes and carboxylic acids, such as formic acid, acetic acid and oxalic acid.[15] [18]
Most, if not all, amines are irreversibly degraded by CO2, O2 e SOX. The
problem is that the gases mentioned before are also likely to be present in the flue gases to be treated. The concentration of these compounds and the temperature of operation are considered to be important variables conditioning the degree of degradation. It is known that secondary amines are more stable than primary amines, but the reaction paths are not yet well understood and there may be some subtle effects of the amines structures on the stability of the degradation products.[15]
ISEL, 2013 20 For example, in a MEA system, as shown in Figure 12, the reaction with CO2 generally results in the reversible formation of a carbamate, but a small
fraction may react further to form degradation products, such as 2-oxazolidone, which reacts again with MEA to form N-(2-hydroxyethyl-)ethylenediamine (HEED) via intermediates of N,N’-di(hydroxyethyl) urea e 1-(2-hydroxyethyl)-2-imidazolidone.[15]
Figure 12 – Mechanism of oxidative degradation of MEA. [23]
Thermal degradation has also been studied in some detail, for, at least some amines. It was found that the main thermal degradation products in the presence of O2 were amines, amino-acid derivatives and carboxylic acids.[15]
With industrial flue gases, the process becomes much more complicated owing to the presence of a mixture of CO2, O2, CO, SOx, NOx and fly ash. Fly
ash refers to the fine particulates in the flue gas consisting of inorganic oxides such as SiO2, Fe2O3, CaO, MgO, Na2O, K2O and P2O5.[15] [18]
Finally, given the relatively low degradation temperatures of most amines, the solvent regeneration processes takes places at approximately 120 ºC and 0.2 MPa, meaning that the CO2 stream is produced at a low pressure, relative
ISEL, 2013 21 to the one required for transport and storage, leading to considerable costs associated with the compression of the CO2.[15]
Apart from questions about the degradation chemistry, there are other important questions that have not been answered yet, involving the atmospheric fate of emissions of amines and its degradation products: how close from the emission source are these products being deposited, the effects of the atmospheric chemistry on these compounds or how can an emission legislation be defined for these compounds.[15]
What is actually known is that most of the molecules considered to be used in CO2 capture applications are strongly polar, and therefore highly soluble in
water. Thus, it is possible to foresee a scenario where fugitive amine emissions mix with rain water and quickly become part of the water cycle and biosphere. Thus, of the thermophysical properties often considered in solvent selection for CO2 capture, the volatility of the amines is very important, and should be given
ISEL, 2013 22
2. Experimental
The experimental studies done during this work had the main goals of assessing performance of amine absorption in preliminary laboratory trials for subsequent studies of CO2 absorption which took place in a pilot unit.
2.1. Preliminary trials
At this stage, studies regarding the regeneration efficiency of the amine solution were performed. In order to observe the amine regeneration, it was required that the amine was saturated with CO2. Therefore, CO2 absorption was
tried and assessed.
2.1.1. Experimental procedure
As mentioned before, in order to study the amine regeneration, it is necessary to saturate the amine solution with CO2. Therefore, the first step was
to search for the structural and thermophysical properties of the amines being studied.
2.1.1.1. Studied amines
The main properties and respective structure of the studied amines is indicated in the Tables 5 to 10, and Figures 12 to 17.
Table 5 – Structural properties of isopropylamine. [17]
Isopropylamine
CAS Number 75-31-0
Molecular Formula C3H9N
Molar Weight (g/mol) 59.11
Density (g/cm3) 0.69 (20 ºC)
Boiling Point (ºC) 31-33 ºC (1013 hPa)
Melting Point (ºC) -101 ºC
Flash Point (ºC) -37 ºC
Supplier Merck
ISEL, 2013 23
Figure 13 – Molecular structure of isopropylamine. [17]
Table 6 – Structural properties of diisopropylamine. [17]
Figure 14 – Molecular structure of diisopropylamine. [17]
Diisopropylamine
CAS Number 108-18-9
Molecular Formula C6H15N
Molar Weight (g/mol) 101.19
Density (g/cm3) 0.72 (20 ºC)
Boiling Point (ºC) 83-84 ºC (1013 hPa)
Melting Point (ºC) -96 ºC
Flash Point (ºC) N/A
Supplier Merck
ISEL, 2013 24
Table 7 – Structural properties of diethylamine. [17]
Diethylamine
CAS number 109-89-7
Molecular formula C4H11N
Molar weight (g/mol) 73.14
Density (g/cm3) 0.71 (20 ºC)
Boiling point (ºC) 56 ºC (1013 hPa)
Melting point (ºC) -50 ºC
Flash point (ºC) -23 ºC
Supplier Merck
Emission Limit Value (ppm) [24] 5
Figure 15 – Molecular structure of diethylamine. [17]
Table 8 – Structural properties of bis(2-ethylhexyl)amine. [17]
Bis(2-ethylhexhyl)amine
CAS number 106-20-7
Molecular formula C16H35N
Molar weight (g/mol) 241.45
Density (g/cm3) 0.80 (20 ºC)
Boiling point (ºC) 122-124 ºC (7 hPa)
Melting point (ºC) N/A
Flash point (ºC) 121 ºC
Supplier Merck
ISEL, 2013 25
Figure 16 – Molecular structure of bis(2-ethylhexyl)amine. [17]
Table 9 – Structural properties of dimethylethanolamine. [17]
Dimethylethanolamine (DMEA)
CAS number 108-01-0
Molecular formula C6H15N
Molar Weight (g/mol) 89.14
Density (g/cm3) 0.89 (20 ºC)
Boiling point (ºC) 132-135 ºC (1013 hPa)
Melting point (ºC) -59
Flash point (ºC) 39
Supplier CPB
Emission Limit Value (ppm) [24] N/A
ISEL, 2013 26
Table 10 – Structural properties of triethylamine. [17]
Triethylamine
CAS number 121-44-8
Molecular formula C6H15N
Molar weight (g/mol) 101.19
Density (g/cm3) 0.73 (20 ºC)
Boiling point (ºC) 90 ºC (1013 hPa)
Melting point (ºC) -115
Flash point (ºC) -11
Supplier Sigma-Aldrich
Emission Limit Value (ppm) [24] 3
ISEL, 2013 27 2.1.2. CO2 absorption using amine solutions
Regarding the CO2 absorption stage, the procedures indicated in Santos
(2012) [25] were followed and adapted for this study. In order to perform the tests, a 500 mL three–necked flask was used, as shown in Figure 19.
Figure 19 - Illustration of experimental tests carried out to study the absorption of CO2
from aqueous amines solutions (diethylamine aqueous solution).
A volume of the 250 mL of the aqueous amine solution, in a concentration of 20% w/w, was placed inside the three-necked flask. Then, CO2
was carefully inserted into the flask, using a Teflon tube which was immersed into the amine solution, to ensure the saturation of the solution. The solution saturation was observed visually through the occurrence of CO2 bubbles in the
amine solution. When the bubbles remained, from the bottom of the flask to the solution surface, it meant that the solution was already fully saturated. For the rest of the studied amines, the same method was used.
The system was studied at room temperature. The gas used for the amine saturation was supplied from a CO2 bottle (L’Air Liquide).
At the end of each test, the saturation of the solution was again observed. The next step was to determine at what temperature the studied Aqueous amine
solution
ISEL, 2013 28 amines solutions would start releasing the CO2 that was absorbed or, in other
words, the starting temperature of the amine regeneration.
2.1.3. Regeneration of the CO2 saturated aqueous amine solutions
In order to proceed to the regeneration of the CO2 saturated aqueous amine
solutions, the procedures indicated in Santos (2012) [25] were followed and adapted for this study.
The tests were conducted by heating the three-necked flask containing the amine solution, CO2 saturated, in an oil bath, as shown in Figure 20.
Figure 20 - Illustration of experimental tests performed to regenerate amines from
aqueous solutions saturated with CO2.
Since the oil has a higher boiling point than water, the amine solution could be heated to higher temperatures, until the temperature of which CO2 started
being released from the amine. In order to perform this study, the oil bath was placed on top of a heating plate (Agimatic-N, J.P. Selecta) and a Honeywell thermometer was placed on the left neck of the flask. Also, the adapter allowing the released CO2 to be directed inside the water tubbing through a rubber tube
was placed on the middle neck. Thus, when the CO2 release started, the
Oil bath
Water tubbing
ISEL, 2013 29 bubbles were visible in the water and it was possible to register the temperature at that precise moment.
2.2. Pilot unit
2.2.1. Assembly of the sampling valve downstream the absorption column
To perform the sample collecting from the absorption column, it was necessary to install a valve. This valve was placed downstream the column so that samples containing the CO2“rich” amine solution could be taken out, as
shown in Figures 21 and 22.
Figure 21 – Sampling valve downstream of the absorption column.
After adding this valve, the sample collecting was much easier to perform than in the original configuration of the pilot unit, allowing collecting the sample in a faster way, but also measuring the amine solution temperature immediately after it had been in contact with the CO2.
Apart from that, the original configuration of the pilot unit, described in Santos (2012) [25], was used.
ISEL, 2013 30 Compressor Air FI L2 Pump 1 FI CO2 Analyser FI E-8 FI FI Column Reboiler Pump 2 FI Feeding Tank Make-up Amine Stripping Column Mixer CO2 Bottle Absorption Column Heat Exchanger L 3 T2 T1 L 1 Analyser Data Collector T3
Figure 22 – Pilot unit flowsheet.
2.2.2. Studies of CO2 absorption in amine solutions
CO2 absorption studies were conducted in the pilot unit, using amine
solutions with a concentration of 10 % w/w. In these studies, the amines used in the preliminary tests that showed the best results were selected, as well as the amines that were expected to be used in the pilot unit during the tests previously performed as described in Santos (2012) [25]. Summary tables are given below containing the typical values of their structural properties for the studied amines and also their respective molecular structures.
ISEL, 2013 31 2.2.2.1. Studied amines
Table 11 – Structural properties of MEA. [25]
Monoethanolamine (MEA)
CAS number 141-43-5
Molecular formula C2H7NO
Molar weight (g/mol) 61.08
Density (g/cm3) 1.0164(20 °C)
Boiling point (ºC) 171 (1013 hPa)
Melting point (ºC) 10.5
Flash point (ºC) 93
Supplier VWR
Emission Limit Value (ppm) [24] 0.5
Figure 23 – Molecular structure of MEA. [17]
Table 12 – Structural properties of EDA. [25] Ethylenediamine (EDA)
CAS number 107-15-3
Molecular formula C2H8N2
Molar weight (g/mol) 60.10
Density (g/cm3) 0.898 (20 °C)
Boiling point (ºC) b) 117 (1013 hPa)
Melting point (ºC) b) 8,5
Flash point (ºC) b) 34
Supplier VWR
ISEL, 2013 32
Figure 24 – Molecular structure of EDA. [17]
Table 13 – Structural properties of PZ. [23]
Figure 25 – Molecular structure of PZ. [17] Piperazine Anhydrous (PZ)
CAS number 110-85-0
Molecular formula C4H10N2
Molar weight (g/mol) 86.14
Ignition temperature (ºC) 320 DIN 51794
Solubility (g/l) 150 (20 °C)
Melting point (ºC) 108 - 111
Density (g/cm3) 1.1 (20 °C)
Bulk density (kg/m3) 400
pH value 12 (150 g/l, H2O, 20 °C)
Boiling point (ºC) 145 - 146 (1013 hPa)
Vapor pressure (hPa) < - 10 (20 °C)
Explosion limit (%) 4 - 14 (V)
Flash point (ºC) 65
Supplier Merck
![Table 1 – World energy use, population and per capita in 1900 and 2001. [2]](https://thumb-eu.123doks.com/thumbv2/123dok_br/16037416.1104974/16.892.127.771.730.1096/table-world-energy-use-population-capita.webp)

![Figure 5 – Carbon Capture and Storage technological options. [9] [10 ]](https://thumb-eu.123doks.com/thumbv2/123dok_br/16037416.1104974/22.892.136.796.343.979/figure-carbon-capture-storage-technological-options.webp)
![Figure 6 – Options for carbon dioxide sequestration. [9]](https://thumb-eu.123doks.com/thumbv2/123dok_br/16037416.1104974/25.892.124.824.100.586/figure-options-for-carbon-dioxide-sequestration.webp)


![Figure 10 – Process flow diagram of stripping column. [12]](https://thumb-eu.123doks.com/thumbv2/123dok_br/16037416.1104974/32.892.290.633.665.1001/figure-process-flow-diagram-stripping-column.webp)
![Figure 11 – Energy dissipaters in a conventional process for CO 2 capture. [22]](https://thumb-eu.123doks.com/thumbv2/123dok_br/16037416.1104974/33.892.168.694.258.560/figure-energy-dissipaters-conventional-process-for-co-capture.webp)