Article
Printed in Brazil - ©2017 Sociedade Brasileira de Química0103 - 5053 $6.00+0.00
*e-mail: [email protected]
The Structure and Composition of Corrosion Product Film and its Relation
to Corrosion Rate for Carbon Steels in CO
2Saturated Solutions at Different
Temperatures
Yong Zhou,*,a Pei Zhang,b Yu Zuo,c Dong Liua and Fuan Yana
aKey Laboratory for Green Chemical Process of Ministry of Education,
Wuhan Institute of Technology, 430205 Wuhan, China
bGuangxi Key Laboratory of Agricultural Resources Chemistry and Biotechnology,
College of Chemistry and Food Science, Yulin Normal University, 537000 Yulin, China
cBeijing Key Laboratory of Electrochemical Process and Technology for Materials,
Beijing University of Chemical Technology, 100029 Beijing, China
For carbon steels immersed in CO2 saturated solutions at different temperatures, the structure and the composition of corrosion product film formed on the steel surface were studied by scanning electron microscope (SEM), X-ray diffraction (XRD) and X-ray photoelectron spectroscopy (XPS). The corrosion rate of the steel was evaluated by potentiodynamic polarization, and the relation between the corrosion rate and the film property was discussed. The corrosion rate of the steel was very closely associated with the structure and the composition of corrosion product film, which were affected significantly by the solution temperature. From 30 to 60 °C, the corrosion product film composed of FeCO3 was porous and poorly adherent, and the corrosion rate increased with the rise of temperature. At 70 and 80 °C, the corrosion product film was also composed of FeCO3 and presented a compact and dense cubic crystal structure, resulting in the decrease on the corrosion rate. The corrosion rate increased once again when the temperature was up to 90 °C, which was attributed to the negative effect of high temperature water vapor corrosion on the grain coarsening and the part exfoliation for the FeCO3 film.
Keywords: carbon steel, corrosion product film, CO2 saturated solution, temperature, corrosion resistance
Introduction
Carbon dioxide (CO2) corrosion is one of the most
typical and universal material corrosion failure for carbon
steels in oil and gas industries.1-3
At present, studies involving CO2 corrosion for carbon
steels are mainly focused on CO2 saturated brine in order
to simulate actual CO2 corrosion environments, and the
corrosion behavior of carbon steels is mainly dependent
on the following factors: temperature, CO2 partial pressure,
aggressive or inhibitive species, pH and flow rate.4-9
Zhu et al.4 studied the corrosion behavior of the N80
carbon steel in oil field formation water containing CO2
and reported that the temperature variation played a critical role in the corrosion rate of the N80 steel. The film on the N80 steel surface was mainly composed of iron carbonate
(FeCO3). The temperature rise not only accelerated the steel
dissolution but also promoted to the formation of FeCO3
film. Further, the authors reported that the addition of acetic acid promoted the cathodic process and inhibited the anodic process. However, the detailed effect of temperature on the
microstructure of FeCO3 film was not discussed. Gao et al.5
studied the mechanical property of CO2 corrosion film and its
relationship to the general and localized corrosion rates for the X65 carbon steel in simulated stratum water containing Ca2+, Mg2+, Cl-, SO
42- and HCO3-. The authors reported that
under static conditions from 0.1 to 1.0 MPa CO2 partial
pressure, the film on the X65 steel surface was composed of
FeCO3, MgCO3 and CaCO3; under dynamic conditions, the
film composition was FeCO3 and CaCO3 mainly. At the same
time, the presence of chloride anions induced the initiation of localized corrosion, and the corrosion rates of both the general corrosion and the localized corrosion increased with
Gao et al.6 also studied the growth mechanism of CO 2
corrosion film on the X65 steel surface and reported that
the crystal growth controlled the formation of FeCO3 film at
the initial stage when the relative supersaturation of FeCO3
was low. The nucleation process was accelerated at the high
FeCO3 supersaturation, and the high nucleation rate resulted
in the formation of relatively compact film. Unfortunately,
in the studies of Gao et al.,5,6 the effect of CO
2 corrosion
film on the corrosion rate was not discussed in detail. Cui
and co-workers7 studied the chemical composition and
the microstructure of CO2 corrosion film for the N80 steel
exposed to simulated stratum water containing CaCl2 15 g L-1
and NaHCO3 1.1 g L-1. The authors reported that the film
was composed of a complex carbonate FeCO3 and CaCO3
and of a limited amount of α-FeOOH mainly. The complex
carbonate was unstable and could be partially decomposed
to α-FeOOH in dry air. However, the relation between the
corrosion rate and the film property was not discussed. Sun et al.8 studied the formation mechanism of CO
2 corrosion
film and the electrochemical characteristic of the low alloy
steel in CO2 saturated solution containing Mg2+, Ca2+, Cl-,
SO42- and HCO3-. The authors reported that the film on the
steel surface was composed of FeCO3, CaCO3 and MgCO3,
which presented the different formation mechanism. As
the main component, the precipitation of FeCO3 might be
very closely related to cementite Fe3C. At the initial stage,
the steel substrate dissolved preferentially and left Fe3C
behind, resulting in a high concentration of Fe2+ between
lamellar Fe3C. This condition promoted the precipitation of
FeCO3 until the whole steel surface was covered by FeCO3.
However, the effect of temperature on the precipitation of
FeCO3 was not discussed. Yang and co-workers9 studied the
corrosion behavior of the pipeline steel in simulated produced
water saturated with supercritical CO2 and reported that
the film on the steel surface, which significantly affected the corrosion behavior of the pipeline steel, was mainly
composed of FeCO3, CaCO3 and α-FeOOH. The element
distribution of Fe, Ca, C and O was inhomogeneous, and the film formed at a low temperature was more stable than that formed at a high temperature. According to the above
reports,4-9 CO
2 corrosion film on the surface of carbon steels
is relatively complicated on the chemical composition and composed of two components mainly: one is the corrosion
product composed of FeCO3 attributed to the dissolution of
iron element from the carbon steel substrate, and the other
is the salt scale composed of CaCO3 and MgCO3 mainly
due to the combined action of Ca2+, Mg2+ and CO
32- in CO2
corrosion environments.
However, CO2 saturated brine containing Ca2+, Mg2+, Cl-,
HCO3- and SO42- is very close to the actual component of
CO2 corrosion environments, but it is difficult to study the
property of corrosion product film in CO2 saturated brine.
The main reason can be attributed to the following two aspects: the precipitation of salt scale and the occurrence of
localized corrosion.10-15 In contrast, the chemical component
of CO2 saturated solution is relatively simple compared with
that of CO2 saturated brine, in which the effects of salt scale
and localized corrosion can be neglected. In this work, the structure and the composition of corrosion product film
formed on the surface of carbon steels immersed in CO2
saturated solutions at different temperatures are studied by scanning electron microscope (SEM), X-ray diffraction (XRD) and X-ray photoelectron spectroscopy (XPS), and the corrosion rate of the steel is evaluated by potentiodynamic polarization test. At the same time, the relation between the corrosion rate and the film property is also discussed in detail.
Experimental
The studied material was Q235 carbon steel with the following chemical composition (wt.%): C, 0.16; Mn, 0.53; Si, 0.30; S, 0.045; P, 0.015; and Fe, 98.95. Specimens were manually abraded up to 1000 grit with SiC abrasive papers, rinsed with de-ionized water and degreased in alcohol. For the electrochemical measurement, the specimens with the dimension of 1 × 1 × 0.3 cm were coated with epoxy
resin, leaving 1.0 cm2 exposed to solution as the working
electrode. For the immersion test, the specimens with the dimension of 5 × 1 × 0.3 cm were suspended with PTFE rubber belt completely exposed to the solution.
The studied solution was CO2 saturated solutions
at different temperatures. The pH value and the CO2
concentration for the studied solution were 3.7 and
0.4 mol L-1 analyzed with short range pH paper and by
the MT/T 257-2000 standard,16 respectively. The solution
temperature was controlled with an electro-thermostatic water bath.
The potentiodynamic polarization tests were performed using a CS350 electrochemical workstation (China). A typical three electrode system was applied for all the polarization tests. The system was composed of a saturated calomel electrode (SCE) as reference electrode, a platinum sheet as counter electrode and the carbon steel specimen with the dimension of 1 × 1 × 0.3 cm as working electrode. Before each polarization test, the working electrode was immersed in the tested solution for 60 min to ensure the open circuit potential (OCP) to be stable. The potential
scanning rate was 0.5 mV s-1, and the potential scanning
range was from −0.3 to 0.3 VOCP.
The carbon steel specimens with the dimension of
5 × 1 × 0.3 cm were immersed in CO2 saturated solutions
and surface morphologies were observed by a SU1510 SEM instrument (Japan). The surface composition was analyzed by a Kevex SuperDry energy dispersion X-ray spectroscopy (EDS) instrument attached on the SEM system, a D8-Advance XRD instrument (Germany) and an ESCALAB-250 XPS instrument (USA).
Results and Discussion
Cross-sectional microstructure
Figure 1 shows the cross-sectional SEM morphologies
of the carbon steel specimens immersed in CO2 saturated
solutions at different temperatures for 1 h. There is a continuous and intact film on the surface of each specimen. However, the effect of temperature on the film microstructure is very prominent. Table 1 shows the relative atom abundance of Fe, C and O in the surface film
formed on the specimen surface immersed in CO2 saturated
solutions at different temperatures by EDS analysis.
From Figure 1a, for the specimen immersed in the solution at 30 °C, a film with the average thickness about 0.78 µm is observed on the specimen surface. EDS analysis revealed that Fe, C and O were present in the film, and the relative atom abundance of Fe, C and O is, respectively, 19.37, 18.82 and 61.81% (shown in Table 1), which is very close to 1:1:3, suggesting that the film formed at 30 °C
is mainly composed of FeCO3. Nesic et al.1,17,18 reported
that when carbon steels were exposed in CO2 corrosion
environments, the formation of CO2 corrosion film was
dominated by the following two reverse processes: the precipitation process and the undermining process. At low temperature, the kinetics of undermining process was faster than that of precipitation process, resulting in that a porous and non-protective film was obtained on the
surface of carbon steels.1 At the same time, Schmitt19 and
Dugstad et al.20 reported that when the temperature was
less than 70 °C, the corrosion product film was porous as well as poorly adherent and could not provide the effective corrosion resistance for the steel substrate. Similar results
Table 1. Relative atom abundance of Fe, C and O in surface film formed on specimen surface immersed in CO2 saturated solutions at different temperatures by EDS analysis
Temperature / °C Fe / % C / % O / %
30 19.37 18.82 61.81
40 20.17 19.92 59.91
50 20.61 19.73 59.66
60 19.87 20.21 59.92
70 20.73 19.25 60.02
80 19.27 20.15 60.58
90 32.92 10.27 56.81
are also observed in the present study. From Figure 1a,
there are some cracks and pores within the FeCO3 film, and
the presence of gap between the FeCO3 film and the Q235
substrate is observed, indicating that the FeCO3 film formed
at 30 °C is poorly compact and adherent. From Figures 1b to 1d, the microstructure of the film formed from 40 to 60 °C is similar to that of the film formed at 30 °C: the presence of cracks, pores and gaps is also observed. Further, from the results of EDS shown in Table 1, the film formed from
40 to 60 °C is also composed of FeCO3. Besides, Figure 1
also illustrates that the film thickness increases slightly with the rise of temperature from 30 to 60 °C, which will be discussed in detail later.
From Figure 1e, for the specimen immersed in the solution at 70 °C, a compact and dense film with the average thickness about 2.84 µm is observed on the specimen surface. EDS analysis revealed that the main composition
of the film is also FeCO3, as shown in Table 1. Compared
with the microstructure of the FeCO3 film formed at the low
temperature, for the FeCO3 film formed at 70 °C, there is no
pore and crack within the FeCO3 film and no gap between
the FeCO3 film and the Q235 substrate, indicating the good
corrosion resistance. From Figure 1f, the film formed at 80 °C is similar to that formed at 70 °C, which is also composed
of FeCO3 according to the EDS results shown in Table 1.
For the specimen immersed in the solution at 90 °C, as shown in Figure 1g, although the microstructure of the film formed at 90 °C is also similar to that of the film formed at 70 or 80 °C, EDS analysis revealed that the relative atom ratio of Fe, C and O is far away from 1:1:3 shown in Table 1, suggesting that the composition of the film formed at 90 °C may be complicated in comparison with that of the film formed at the low temperature, which will be confirmed by XRD and XPS later.
Film thickness
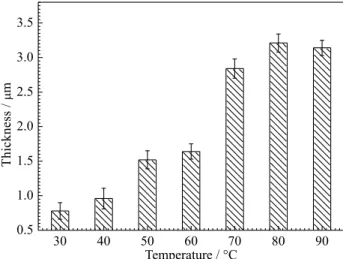
Figure 2 shows the effect of temperature on the thickness for the corrosion product film formed on the
specimen surface immersed in CO2 saturated solutions
at different temperatures for 1 h, where each datum is the average value of ten randomly selected sites at the surface film on the cross-sectional SEM morphology, and the error ranges are also shown. From Figure 2, the film thickness increases slightly with the rise of temperature from 30 to 60 °C. Afterwards, the film thickness shows very sharp increase from 1.64 to 2.84 µm between 60 and 70 °C. Finally, when the temperature is up to 70 °C, the film thickness shows slight variation with the rise of temperature.
The thickness variation of corrosion product film may be attributed to the effect of temperature on the solubility
product constant (Ksp) and the solubility temperature
coefficient.21-23 Nesic and co-workers21 studied the effects
of temperature and ionic strength on the solubility limit of
iron carbonate. The authors reported that the Ksp value of
FeCO3 could be described as follows:
log Ksp = −59.3498 − 0.041377 × Tk− 2.1963 / Tk +
24.5724 × log Tk + 2.518 × I0.5− 0.657 × I (1)
According to the above equation, the Ksp value decreases
with the rise of temperature, which is consistent with
the experimental results.21 Waard et al.23 reported that
the solubility temperature coefficient of FeCO3 showed
a negative value, indicating that the solubility of FeCO3
decreased with the rise of temperature. Therefore, it can
be inferred that the FeCO3 crystal formed at the high
temperature is more stable than that formed at the low temperature. On the other hand, it was reported that the undermining process and the precipitation process owned
the different temperature susceptibility.1,17,18 At high
temperature, the kinetics of precipitation process could be accelerated quickly and was more prominent than that
of undermining process,1 which is also favorable for the
formation of corrosion product film. The above two aspects can be responsible for the thickness variation of corrosion product film.
Surface microstructure
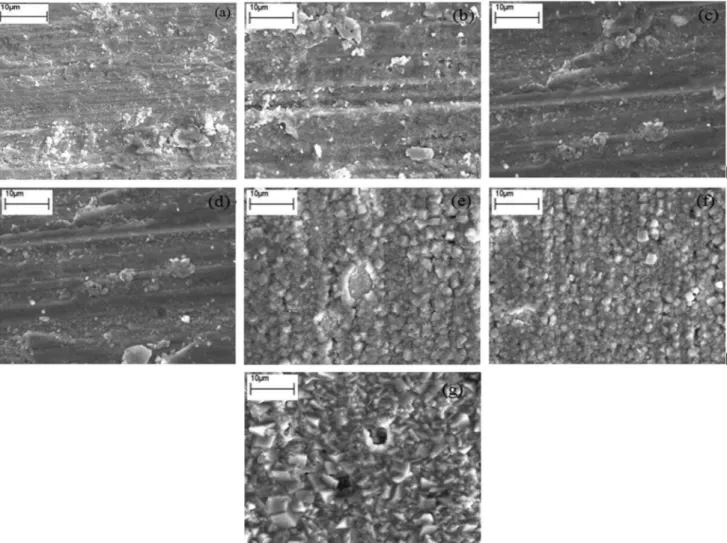
Figure 3 shows the surface SEM morphologies of
the carbon steel specimens immersed in CO2 saturated
solutions at different temperatures for 1 h. Like the results of cross-sectional microstructure shown in Figure 1, Figure 3 illustrates that the effect of temperature on the
crystal structure of FeCO3 is also prominent.
From Figures 3a to 3d, for the specimens immersed in the solutions from 30 to 60 °C, there is no obvious crystal shape on the specimen surface, whereas some scratches due to mechanical action of abrasive paper are observed. On the other hand, EDS analysis revealed that the relative atom
abundance of Fe for the four specimens was more than 60%.
The above results indicate that the FeCO3 film formed at the
low temperature is relatively thin, which is in agreement with the results of cross-sectional SEM morphology. It was reported that when the temperature was low, the negative effect of undermining process were prominent compared
with the positive effect of precipitation process,1,17,18 which
is adverse to the formation of CO2 corrosion film.
However, for the specimens immersed in the solutions at 70 and 80 °C shown in Figures 3e and 3f, the surface
microstructure of FeCO3 film shows an obvious cubic
crystal shape. Gao et al.5,6,24 reported that the corrosion
product film consisted of cubic crystals provided good
corrosion resistance for the steel substrate against CO2
corrosion. Zhu et al.4 also reported that the cubic structure
could effectively resist the diffusion/permeation of aggressive species reaching the film/substrate interface. Further, for the specimen immersed in the solution at 70 °C, EDS analysis revealed that Fe, C and O were present in the film, and the relative atom abundance of Fe, C and O was
19.63, 20.16 and 60.21%, respectively. The relative atom ratio of Fe, C and O is approximately 1:1:3, suggesting
that the thickness of FeCO3 film formed at 70 °C increases
compared with that of FeCO3 film formed from 30 to 60 °C,
which is consistent with the results shown in Figure 2. From Figure 3g, for the specimen immersed in the solution at 90 °C, the surface film also shows the cubic crystal structure. However, the crystals formed at 90 °C are obviously more coarse and bulky than those formed at 70 or 80 °C. It was reported that the surface film consisted of exquisite crystals could provide better corrosion resistance
than that consisted of coarse crystals,25 indicating that the
corrosion rate of the steel in the solution at 90 °C is higher than that of the steel in the solution at 70 or 80 °C. Later, the relation between the film property and the corrosion rate will be discussed.
Film composition
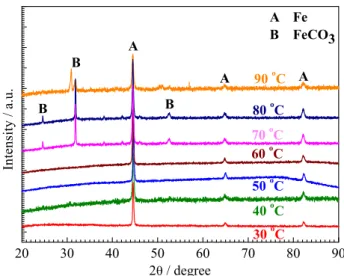
Figure 4 shows the XRD patterns of the carbon
steel specimens immersed in CO2 saturated solutions
at different temperatures for 1 h. For the specimens immersed in the solutions from 30 to 60 °C, there are only three main peaks visible on the patterns at about 45°,
65° and 82°, corresponding to α-Fe. However, the above
XRD results seem to contradict the results of SEM and
EDS shown in Figure 1 and Table 1: the FeCO3 film has
been formed but cannot be detected by XRD analysis. Because the measuring depth of XRD is beyond 10 µm,
the FeCO3 film formed from 30 to 60 °C is too thin to be
detected. For the specimens immersed in the solutions at 70 and 80 °C, besides three diffraction peaks at 45°, 65° and 82°, other three diffraction peaks at about 24°,
32° and 53° corresponding to FeCO3 were detected by
XRD analysis, suggesting that the FeCO3 film formed
at the high temperature is thicker than that formed at the low temperature. However, for the specimen immersed in the solution at 90 °C, the diffraction peaks at 24° and 53° become no obvious, and the diffraction peak at 32° moves a little to the low angle direction, which may be due to the composition of the film formed at 90 °C is more complicated than that of the film formed from 30 to 80 °C.
Figure 5 shows the wide-scan XPS spectrum of the
carbon steel specimen immersed in CO2 saturated solution
at 30 °C for 1 h. There are three main peaks visible on the spectrum at about 711, 531 and 285 eV corresponding, respectively, to Fe 2p, O 1s and C 1s. The XPS result provides evidence for the presence of Fe, C and O, which is in agreement to the results of EDS and XRD. The wide-scan XPS spectra of the specimens immersed in the solutions from 40 to 90 °C are similar to that of the
specimen immersed in the solution at 30 °C: only Fe 2p, C 1s and O 1s were detected by XPS analysis.
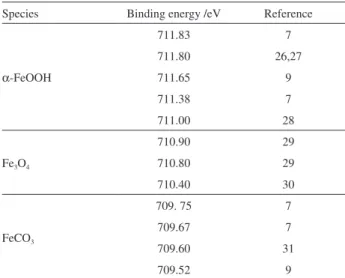
Figure 6 shows the high-resolution XPS spectra of Fe 2p
for the carbon steel specimens immersed in CO2 saturated
solutions at 30 and 90 °C for 1 h. Table 2 summarizes the reported binding energy values for Fe 2p in various model compounds from literature.
According to the reported data in Table 2, for the specimen immersed in the solution at 30 °C, the Fe 2p spectrum reveals two peaks at 711.70 and 709.70 eV,
corresponding to Fe element in α-FeOOH and FeCO3,
respectively. The high-resolution XPS spectra of Fe 2p for the specimens immersed in the solutions from 40 to 80 °C are similar to that for the specimen immersed in the solution
at 30 °C: only the presence of α-FeOOH and FeCO3 was
detected by XPS analysis. In contrast, for the specimen immersed in the solution at 90 °C, the high-resolution Figure 4. XRD patterns of carbon steel specimens immersed in CO2 saturated solutions at different temperatures for 1 h.
XPS spectrum of Fe 2p is obvious different, as shown in Figure 6b. The Fe 2p spectrum reveals three peaks at 711.95, 710.90 and 709.80 eV, respectively corresponding
to Fe element in α-FeOOH, Fe3O4 and FeCO3.
FeCO3 is the carbonate corrosion product for carbon
steels exposed to CO2 corrosion environments, and the
mechanism for the precipitation of FeCO3 is as follows:4,32
Fe2+ + CO
32-→ FeCO3 (2)
Fe2+ + 2HCO
3-→ Fe(HCO3)2 (3)
Fe(HCO3)2→ FeCO3 + CO2 + H2O (4)
For α-FeOOH, Heuer and Stubbins27 reported that the
exposure of FeCO3 to air could result in hydrolysis and
oxidation to FeO/FeOOH. Cui and co-workers7 reported
that the presence of α-FeOOH was attributed to the
temporary storage of the tested specimen in desiccated air before XPS analysis. Similar results are also reported by
Zhao and Chen26 and Zhou and Zuo.33 Fe
3O4 is the oxide
corrosion product for iron-based metal materials exposed to high temperature water vapor environments, and the
formation mechanism of Fe3O4 is as follows:34,35
3Fe + 4H2O (g) → Fe3O4 + 4H2 (g) (5)
Electrochemical behavior
Figure 7 shows the polarization curves of the carbon
steel specimens in CO2 saturated solutions at different
temperatures. Regardless of the solution temperature, all of the specimens presented the electrochemical characteristic of active dissolution in the tested electrolyte. However, the
effect of temperature on the corrosion current density (icorr)
is very prominent, as shown in Figure 7. Table 2. Reported binding energy values for Fe 2p in various model
compounds from literature
Species Binding energy /eV Reference
α-FeOOH
711.83 7
711.80 26,27
711.65 9
711.38 7
711.00 28
Fe3O4
710.90 29
710.80 29
710.40 30
FeCO3
709. 75 7
709.67 7
709.60 31
709.52 9
Figure 6. High-resolution XPS spectra of Fe 2p for carbon steel specimens immersed in CO2 saturated solutions for 1 h at (a) 30 and (b) 90 °C.
From the values of icorr, the corrosion rate (VL) can be
calculated according to the following equations:
Vcorr = (A × icorr × 104) / (n × F) (6)
VL = (8.76 × Vcorr) / ρ (7)
In the above two equations, A represents the relative
atomic weight (g), A = 56 g; icorr represents the corrosion
current density (A cm-2), which can be obtained from Figure 7;
n represents the chemical valence, n = 2; F represents the
Faraday constant (A h), F = 96500 C = 26.8 A h; Vcorr
represents the weight corrosion rate (g m-2 h-1), which can be
calculated by equation 6; ρ represents the material density
(g cm-3),
ρ = 7.8 g cm-3; VL represents the corrosion rate
(mm y-1), which can be calculated by equation 7.
Relation between corrosion rate and corrosion product film
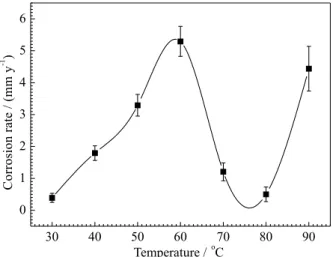
Figure 8 shows the effect of temperature on the corrosion rate for the carbon steel specimens immersed in
CO2 saturated solutions, where each datum is the average
value of five parallel polarization tests, and the error ranges are also shown. From Figure 8, the corrosion rate increases gradually with the rise of temperature from 30 to 60 °C and shows a peak value at 60 °C. However, when the temperature is up to 70 °C, the corrosion rate decreases and shows a least value at 80 °C. Finally, the corrosion rate increases once again when the temperature is 90 °C.
From the above results of SEM, XRD and XPS, a corrosion product film with different structure and composition is formed on the steel surface when the
studied steel is exposed in CO2 saturated solution, and the
property of corrosion product film is affected significantly by the solution temperature. It is generally accepted that
the corrosion behavior of carbon steels in CO2 corrosion
environments is very closely associated with the presence
of corrosion product film.17,18,24 The relation between the
corrosion rate and the film property is discussed as follows. It was reported that the corrosion resistance of
CO2 corrosion film was mainly attributed to its role of
mechanical barrier to restrain the diffusion/permeation of aggressive species reaching the substrate surface, so a
protective film should have very few film defects.5,6 Because
of the different temperature susceptibility between the precipitation process and the undermining process, at low temperature, the undermining rate was usually faster than the precipitation rate, resulting in that the undermining process controlled the film-formed kinetics on the surface
of carbon steels.17,18 In this case, a porous, poorly adherent
and non-protective film would be obtained on the steel surface, and the film was almost no diffusion/permeation
resistance to restrain the cathodic species, such as H+, H
2O
and H2CO3, reaching the film/substrate interface.1 The
corrosion rate was dominated by the electrochemical step, and the following cathodic reactions occurred on the steel
surface readily:36-40
H+ + e
→ H (8)
H2O + e → H + OH- (9)
H2CO3 + e → H + HCO3- (10)
In this work, from 30 to 60 °C, although the thickness
of FeCO3 film increases with the rise of temperature as
shown in Figure 2, the presence of pores and cracks within
the FeCO3 film and the presence of gap between the FeCO3
film and the Q235 substrate are observed, as shown in
Figure 1, indicating that the FeCO3 film formed from 30 to
60 °C cannot provide the good physical barrier to the steel
substrate. At the same time, Nesic et al.38 reported that the
kinetics of cathodic reactions was accelerated significantly with the rise of temperature from 20 to 80 °C. Ogundele and
White39 reported the similar results on the cathodic kinetics
in the temperature range from 25 to 95 °C. Therefore, in this work, the increased corrosion rate from 30 to 60 °C is attributed to the combined effects of temperature and
non-protective FeCO3 film.
However, with the rise of temperature, the high temperature accelerated the kinetics of precipitation process, and the precipitation rate would exceed the undermining rate, resulting in a dense, compact and
protective film formed on the surface of carbon steels.17,18
In the present study, similar results are also observed in Figures 1 and 3. From Figures 1e and 1f, there is no pore
and crack within the FeCO3 film and no gap between the
FeCO3 film and the Q235 substrate, indicating the good
function of mechanical barrier for the FeCO3 film. On
the other hand, from Figures 3e and 3f, the FeCO3 film
shows the cubic crystal structure, which can effectively restrain the diffusion/permeation of aggressive species to the film/substrate interface. In this case, the reactant supply for electrochemical reactions shown in equations 8 to 10 become more difficult, and the corrosion rate is dominated by the step of mass transfer. Therefore, the decreased
corrosion rate at 70 to 80 °C is due to the protective FeCO3
film. Besides, the fact that the corrosion rate at 80 °C is slightly lower than that at 70 °C may be attributed to that
the FeCO3 film formed at 80 °C is thicker than that formed
at 70 °C, as shown in Figure 2.
The composition and the structure of corrosion product film formed at 90 °C are obviously different from
those of FeCO3 film formed from 30 to 80 °C. Figure 6b
illustrates that the signal of Fe3O4 was detected by XPS
analysis. However, according to the XRD result for the specimen immersed in the solution at 90 °C, except the
diffraction peaks corresponding to α-Fe and FeCO3, no
peak corresponding to Fe3O4 was detected by XRD analysis,
suggesting the content of Fe3O4 on the steel surface is
relatively few. The presence of a small amount of Fe3O4 can
increase the relative atom abundance of Fe and decrease the corresponding values of C and O, which is consistent with the EDS results shown in Table 1. Therefore, it can be inferred that the corrosion product film formed at 90 °C
is composed mainly of FeCO3 and of a small amount of
Fe3O4. The presence of Fe3O4 is attributed to the occurrence
of high temperature water vapor corrosion.34,35 Further,
Han et al.34 reported that a limited amount of Fe
3O4 was
distributed discontinuously between the FeCO3 film and the
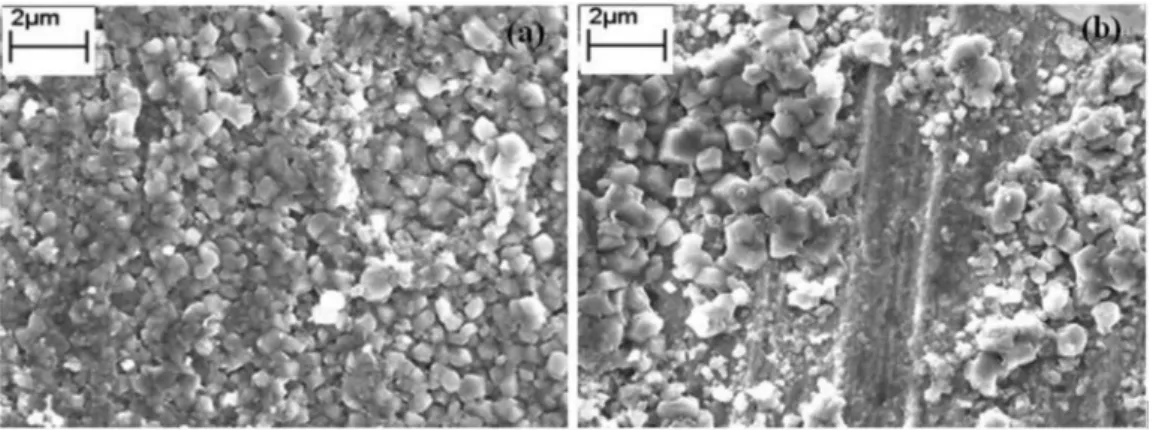
steel substance. Figure 9 shows the enlarged surface SEM morphologies of the carbon steel specimens immersed in
CO2 saturated solutions at 80 to 90 °C for 1 h.
Comparing Figures 9a and 9b, the cubic crystals formed at 90 °C are more coarse and bulky than those formed at 80 °C, indicating that the corrosion resistance of the film
formed at 80 °C is greater than that of the film formed 90 °C. On the other hand, from Figure 9b, some cubic crystals have been peeled off from the steel surface, which is
also attributed to the presence of Fe3O4 on the steel surface.
According to the report of Han et al.,34 the discontinuous
Fe3O4 film not only could not provide the corrosion
resistance for the steel substrate but also decreased the
adhesive force of FeCO3 film to the steel surface. Therefore,
the increased corrosion rate at 90 °C is attributed to the combined effects of the grain coarsening and the part
exfoliation on the FeCO3 film, which is derived from the
occurrence of high temperature water vapor corrosion.
Conclusions
In this work, the relation between the evolution of corrosion rate and the property of corrosion product film
for carbon steels immersed in CO2 saturated solutions at
different temperatures was studied and discussed. The corrosion rate of the studied steel was very closely related to the structure and the composition of corrosion product film, which were affected significantly by the solution temperature. From 30 to 60 °C, the corrosion product film
composed of FeCO3 was porous and poorly adherent, and
the corrosion rate increased with the rise of temperature. At 70 and 80 °C, the corrosion product film was also composed
of FeCO3 and showed a compact and dense cubic crystal
structure, resulting in the decrease on the corrosion rate. The corrosion rate increased once again when the temperature was up to 90 °C, which was attributed to the negative effect of high temperature water vapor corrosion on the grain
coarsening and the part exfoliation for the FeCO3 film.
Acknowledgments
This work is supported by the National Nature Science Foundation of China (contract 51601133, 51210001 and 51401150).
References
1. Nesic, S.; Corros. Sci.2007, 49, 4308.
2. Usher, K. M.; Kaksonen, A. H.; Bouquet, D.; Cheng, K. Y.; Geste, Y.; Chapman, P. G.; Johnston, C. D.; Corros. Sci.2015,
98, 354.
3. Nesic, S.; Nordsveen, M.; Maxwell, N.; Vrhovac, M.; Corros. Sci.2001, 43, 1373.
4. Zhu, S. D.; Fu, A. Q.; Miao, J.; Yin, Z. F.; Zhou, G. S.; Wei, J. F.; Corros. Sci.2011, 53, 3156.
5. Gao, K. W.; Yu, F.; Pang, X. L.; Zhang, G. A.; Qiao, L. J.; Chu, W. Y.; Lu, M. X.; Corros. Sci.2008, 50, 2796.
6. Gao, M.; Pang, X.; Gao K.; Corros. Sci.2011, 53, 557. 7. Wu, S. L.; Cui, Z. D.; He, F.; Bai, Z. Q.; Zhu, S. L.; Yang, X.
J.; Mater. Lett.2004, 58, 1076.
8. Sun, J. B.; Zhang, G. A.; Liu, W.; Lu, M. X.; Corros. Sci.2012,
57, 131.
9. Cui, Z. D.; Wu, S. L.; Zhu, S. L.; Yang, X. J.; Appl. Surf. Sci.
2006, 252, 2368.
10. Xiong, Q. Y.; Zhou, Y.; Xiong, J. P.; Int. J. Electrochem. Sci.
2015, 10, 8454.
11. Ko, M.; Ingham, B.; Laycock, N.; Williams, D. E.; Corros. Sci.
2015, 90, 192.
12. Farelas, F.; Galicia, M.; Brown, B.; Nesic, S.; Castaneda, H.;
Corros. Sci.2010, 52, 509.
13. Fatah, M. C.; Ismail, M. C.; Ari-Wahjoedi, B.; Kuinia, K. A.;
Mater. Chem. Phys.2011, 127, 347.
14. Zhang, Y. C.; Pang, X. L.; Qu, S. P.; Li, X.; Gao, K. W.; Corros. Sci.2012, 59, 186.
15. Zhou, Y.; Yan, F. A.; Int. J. Electrochem. Sci.2016, 11, 3976. 16. MT/T 257-2000, Determination of Free Carbon Dioxide in
Coal Mine Water, The Coal Industry Standard of the People’s Republic of China, Beijing, 2000-2001.
17. Nesic, S.; Lee, K. L. J.; Corrosion2003, 59, 616.
18. Nesic, S.; Solvi, G. T.; Enerhaug, J.; Corrosion1995, 51, 773. 19. Schmitt, G.; Corrosion1991, 47, 285.
20. Dugstad, A.; Hemmer, H.; Seiersten, M.; Corrosion2001, 57, 369.
21. Sun, W.; Nesic, S.; Woollam, R. C.; Corros. Sci.2009, 51, 1273. 22. Smith, H. J.; J. Am. Chem. Soc.2002, 40, 879.
23. Waard, C. D.; Lotz, U.; Milliams, D. E.; Corrosion1991, 47, 976.
24. Li, T.; Yang, Y. J.; Gao, K. W.; Lu, M. X.; J. Univ. Sci. Technol. Beijing2008, 15, 702.
25. Li, Q.; Xu, S. Q.; Hu, S. Y.; Zhang, S. Y.; Zhong, X. K.; Yang, X. K.; Electrochim. Acta2010, 55, 887.
26. Zhao, J. M.; Chen, G. H.; Electrochim. Acta2012, 69, 247. 27. Heuer, J. K.; Stubbins, J. F.; Corros. Sci.1999, 41, 1231. 28. Zhang, J.; Wang, Z. L.; Wang, Z. M.; Han, X.; Corros. Sci.
2012, 65, 397.
29. Wilson, D.; Langell, M. A.; Appl. Surf. Sci.2014, 303, 6. 30. Wang, J. Q.; Wu, W. H.; Feng, D. M.; Electron Spectroscopy
(XPS/XAES/UPS) Introduction; National Defence Industry Press: Beijing, China, 1992.
31. Lopez, D. A.; Schreiner, W. H.; Sanchez, S. R.; Simison, S. N.;
Appl. Surf. Sci.2004, 236, 77.
32. Linter, B. R.; Burstein, G. T.; Corros. Sci.1999, 41, 117. 33. Zhou, Y.; Zuo, Y.; J. Electrochem. Soc.2015, 162, C47. 34. Han, J. B.; Nesic, S.; Yang, Y.; Brown, B. N.; Electrochim. Acta
2011, 56, 5396.
35. Cheng, Y. F.; Steward, F. R.; Corros. Sci.2004, 46, 2405. 36. Xiong, Q. Y.; Xiong, J. P.; Zhou, Y.; Yan, F. A.; Int. J.
Electrochem. Sci.2017, 12, 4238.
37. Mishra, B.; Hassan, S. A.; Olson, D. L.; Salama, M. M.;
Corrosion1997, 53, 852.
38. Nesic, S.; Postlethwaite, J.; Olsen, S.; Corrosion1996, 52, 280. 39. Ogundele, G. I.; White, W. E.; Corrosion1986, 42, 71. 40. Waaed, C. D.; Milliams, D. E.; Corrosion1975, 31, 177.