André Filipe de Oliveira Almeida
[Nome completo do autor]
[Nome completo do autor]
[Nome completo do autor]
[Nome completo do autor]
[Nome completo do autor]
[Nome completo do autor]
[Nome completo do autor]
Mestre em Engenharia Civil
[Habilitações Académicas] [Habilitações Académicas] [Habilitações Académicas] [Habilitações Académicas] [Habilitações Académicas] [Habilitações Académicas] [Habilitações Académicas] Setembro, 2019
PUNCHING IN FLAT SLABS SUBJECTED TO
CYCLIC HORIZONTAL LOADING
[Título da Tese]
Dissertação para obtenção do Grau de Doutor em
Engenharia Civil
Dissertação para obtenção do Grau de Mestre em
[Engenharia Informática]
Orientador: Prof. Doutor António Manuel Pinho Ramos Professor Auxiliar, FCT/UNL
Co-orientador: Prof. Doutor Válter José da Guia Lúcio Professor Associado, FCT/UNL
Júri:
Presidente: Prof. Doutor Fernando M. A. Henriques
Arguentes: Prof. Doutor Carlos Manuel Chastre Rodrigues Prof. Doutor Mário Jorge de Seixas Pimentel
Vogais: Prof. Doutor António Manuel Pinho Ramos Prof. Doutor Rui Pedro César Marreiros
Profª Doutora Ana Rita Faria Conceição de Sousa Gião Prof. Doutor Manuel José Andrade Loureiro Pipa
PUNCHING IN FLAT SLABS SUBJECTED TO CYCLIC HORIZONTAL LOADING
Copyright © André Filipe de Oliveira Almeida, Faculdade de Ciências e Tecnologia, Universidade Nova de Lisboa.
A Faculdade de Ciências e Tecnologia e a Universidade Nova de Lisboa têm o direito, perpétuo e sem limites geográficos, de arquivar e publicar esta dissertação através de exemplares impressos reproduzidos em papel ou de forma digital, ou por qualquer outro meio conhecido ou que venha a ser inventado, e de a divulgar através de repositórios científicos e de admitir a sua cópia e distribuição com objetivos educacionais ou de investigação, não comerciais, desde que seja dado crédito ao autor e editor
This dissertation would not have been possible without the strength of God and the support of those who were by my side, helping me going through the difficult times and being responsible by the good ones. My most profound thanks to all those extraordinary people. I am grateful for the best team of supervisors that I could ever had, Professor António Pinho Ramos and Professor Válter Lúcio. Thank you for the best scientific guidance, for the support, for the limitless patience and for the immense trust that allowed me to go ahead with the oddest ideas.
To my dear friend Micael Inácio, my research companion, a brilliant investigator, tireless worker, who lift me up and pushed me forward in the most difficult periods of this work, my thoughtful thanks.
I would like to thank my friends Rui Marreiros and Carla Marchão for the scientific guidance, true friendship and therapy sessions.
To my friends and office colleagues Ana Rita, Nuno Mamede, Noel Franco and Alessia Masini for all the laughs, technical support and help in random tasks whenever I need them. I truly thank the help of Eng. Ricardo Faria, Eng. Nuno Ornelas, Eng. Bruno Alcobia and Eng, Gonçalo Antunes for their collaboration with both labour and data that enriched this work.
I would like to thank the laboratory technicians Jorge Silvério, José Gaspar and Vitor Silva for all the labour and technical support.
This work received the support from the Fundação para a Ciência e a Tecnologia - Ministério da Ciência, Tecnologia e Ensino Superior through scholarship number SFRH/BD/119772/2016.
A special thanks to Concremat - Soluções de Betão, S.A. Precast Facility for making possible the fabrication of the specimens. To all their work team, namely Eng. Romeu Reguengo, Eng. José and Eng. David, thank you.
I would like to thank TECNO2004 Lda for the fabrication of the steel elements of the test setup. A special thanks to José Carlos Carmo.
and many more, that were always by my side, a very special thank you.
I thank my dear friends Pe. Ricardo Jacinto and the late D. Sebastião Perestrello, for the spiritual guidance and for helping me growing up to be the person I am today.
I would like to thank my close family for all the support. To my late grandparents José de Oliveira and Brígida Rosa. I miss you every day.
A very special thank you to Joana Reis, for all the love we shared, for picking me up when I most needed, for showing me the way, for all the wonderful moments we shared and for being the most wonderful person.
To Noémia and Diamantino, the best parents that I could hope for. All this is a result of your wok. Thank you for the superhuman effort that you have to go through to allowing me to continue to pursuit this goal. I hope I am the son you hoped for. Love you both.
The most special acknowledge to Inês Almeida. You are the best sister that I could ever wish. You lift me when, you lectured me and you let me stumble and learn by myself, when I needed. I will always be in debt to you for everything you did for me. Love you to eternity.
The aim of this work is to study the behaviour of reinforced concrete flat slab structures under combined vertical and horizontal cyclic loading. A total of eleven similar reinforced concrete slabs were cast and tested, measuring 4.25x1.85x0.15m³.
The cyclic tests were performed using an innovative test setup that aimed to simulate the boundary conditions of a flat slab, representing the slab between middle spans in one direction and between zero bending moment points in the other direction. It was designed to allow bending moment redistribution, mobility of the line of inflection, assure equal vertical displacements and rotations at the opposite free borders, and, therefore, symmetrical shear forces and equal bending moments, as expected in a real structure.
The slab specimens were connected to two steel half columns, by 0.25x0.25m² rigid steel plates prestressed against the slab using steel bolts, to ensure monolithic behaviour. The slabs were divided in groups, according to the characteristics of the test protocol and the tested variables. A reference specimen was subjected to centred punching, and the results were used to predict the punching capacity of the remaining slabs. One specimen was tested under constant vertical loading and monotonically increased eccentricity until failure. In the cyclic tests, the vertical load was first applied and kept constant during the test, while the cyclic horizontal loading, was increased, in steps of three cycles, until failure. Three specimens were tested under constant vertical load, at different shear ratios, and cyclic increasing horizontal loading. Two slabs were tested using post installed shear bolts arranged in two different solutions, one using a radial distribution around the column and another using a cross distribution. Four slab specimens with shear reinforcement were tested with different shear reinforcement ratios and number of stirrup layers.
Results show that cyclic horizontal actions are very harmful to the slab-column connection, resulting in low horizontal drift, if no adequate shear reinforcement is provided, and low energy dissipation. The post installed steel bolts were proven to be an efficient solution for strengthening existing structures, improving the structural behaviour and the punching resistance. Also, the use of steel stirrups as shear reinforcement is very effective, increasing shear, drift and energy dissipation capacities. Finally, design recommendations and a proposition for the calculation of a minimum shear reinforcement are suggested.
Flat slab, reinforced concrete, cyclic, shear ratio, punching stirrups, bolts, shear reinforcement
Este trabalho teve como objetivo estudar o comportamento de lajes fungiformes de betão armado sujeitas a cargas verticais gravíticas combinadas com cargas horizontais cíclicas. Foram ensaiadas onze lajes de características semelhantes com dimensões de 4.25x1.85x0.15m³.
Nos ensaios realizados foi usado um sistema de ensaio inovador, concebido para aplicar as condições de fronteira de uma laje fungiforme real, num modelo de uma laje truncado entre meios-vãos numa das direções e entre pontos de inflexão para cargas gravíticas na direção perpendicular. Este sistema de ensaio foi concebido para permitir redistribuição de momento positivo, mobilidade da linha de inflexão e permitir deslocamentos verticais iguais e rotações iguais nos bordos opostos, assegurando assim, esforço transverso simétrico e momentos iguais, como esperado no meio vão de uma laje real.
Os modelos foram ligados a dois meios pilares metálico por meio de chapas metálicas rígidas de dimensões 0.25x0.25m², pré-esforçadas contra a laje por varões roscados de aço, para garantir um comportamento monolítico. Os modelos foram agrupados de acordo com as variáveis estudadas e as caraterísticas do protocolo ed ensaio utilizado. Foi ensaiada uma laje de referência ao punçoamento centrado, cujos resultados foram usados para extrapolar a capacidade de carga das restantes lajes. Um dos modelos foi ensaiado sob carga vertical constante e excentricidade unidirecional crescente até à rotura. Nos ensaios cíclicos, a carga vertical foi mantida constante, enquanto se aplicaram ciclos de drift crescente até se atingir a rotura. Foram ensaiadas três lajes com diferentes valores de shear ratio e incrementos de drift alternados. Em duas lajes foram testados parafusos pós-instalados como armadura de punçoamento em disposições radial e cruciforme. Nas últimas quatro lajes, utilizaram-se estribos com duas taxas de armaduras com disposições de três e cinco perímetros.
Os resultados mostraram que as ações cíclicas horizontais são gravosas para as ligações laje-pilar o que apresentam capacidades de drift reduzidas. O uso de armadura de punçoamento pré e pós instalada mostrou-se eficaz no aumento da capacidade de drift e ductilidade da ligação pilar-laje. Por fim, são feitas recomendações de projeto e é proposta uma armadura mínima a utilizar em zonas sísmicas.
Laje fungiforme, betão armado, cíclico, shear ratio, punçoamento, estribos, parafusos, armadura de punçoamento
Chapter 1. Introduction ... 1
1.1 Background ... 1
1.2 Motivation and objectives ... 2
1.3 Dissertation organization... 3
Chapter 2. Literature Review ... 5
2.1 Experimental tests using simplified setups ... 5
2.2 Experimental tests in multi-frame specimens... 31
2.3 Codes and standards... 35
2.3.1 ACI 318 and ACI 421.2R ... 35
2.3.2 Eurocode 2 - EN 1992-1-1 ... 40
2.3.3 Model Code 2010 ... 44
2.4 Final remarks ... 50
Chapter 3. Description of the Experimental Campaign ... 53
3.1 Development of the test setup ... 53
3.1.1 Analysis and conceiving of the test setup elements ... 53
3.1.2 Design of the test specimens ... 57
3.1.3 Design of the test setup ... 60
3.2 Test specimens and materials ... 68
3.3 Test instrumentation and procedures ... 74
3.3.1 Instrumentation ... 74
3.3.2 Test assembly ... 79
3.3.3 Test protocols ... 81
Chapter 4. Experimental Test Results ... 85
4.1 Tests without horizontal displacement ... 85
x
4.2.2 Specimens C-50, C-40 and C-30 ... 91
4.2.3 Specimens C-50 BR and C-50 BC ... 100
4.2.4 Specimens C-50 STR1, C-50 STR2, C-50 STR3 and C-50 STR4 ... 112
4.3 Comparison between specimens from different groups ... 132
Chapter 5. Design considerations ... 141
5.1 Gravity shear ratio values predicted by the codes ... 141
5.2 Factors that influence the experimental results ... 143
5.3 The case of the tested slabs... 144
5.4 Use of shear reinforcement ... 145
5.5 Minimum shear reinforcement ... 145
Chapter 6. Summary, conclusions and future works ... 151
6.1 Conclusions ... 151
6.2 Future works ... 154
Figure 2.1: Test setup adapted from Hanson [1]. ... 6
Figure 2.2: Test setup used by Hawkins (adapted from Hawkins [40]). ... 8
Figure 2.3: Test setup adapted from Ghali [42]. ... 10
Figure 2.4: Test setup adapted from Morrison [43]. ... 11
Figure 2.5: Test setup adapted from Pan [10]. ... 12
Figure 2.6: Test setup used by Soares (adapted from Soares [44]). ... 15
Figure 2.7: Test setup adapted from Tegos [11]... 16
Figure 2.8: Test setup used by Robertson (adapted from Robertson [45]). ... 17
Figure 2.9: Test setup adapted from Ritchie [15]. ... 19
Figure 2.10: Test setup used by Prawatwong (adapted from Prawatwong [47]). ... 21
Figure 2.11: Test setup used by Cheng (adapted from Cheng [31])... 27
Figure 2.12: Test setup used by El-Salakawy (adapted from El-Salakawy [36]). ... 30
Figure 2.13: Test setup adapted from Robertson [50]. ... 32
Figure 2.14: Test setup used by Dechka (adapted from Dechka [6]). ... 34
Figure 2.15: Punching control perimeter according to ACI 318 [51]. ... 36
Figure 2.16: Punching control perimeter for shear reinforced slabs, according to ACI 421 [52]. ... 38
Figure 2.17: Requirement for shear reinforcement criterion [51][52]. ... 40
Figure 2.18: Punching control perimeter according to EC2 [54]. ... 41
Figure 2.19: Punching control perimeter and shear reinforcement detail guidelines according to EC2 [54]. ... 43
Figure 2.20: Punching resistance as a function of slab rotation [57]. ... 45
Figure 2.21: Control perimeter as suggested by Muttoni, [57] adopted by MC2010 [56]. .. 46
Figure 2.22: Control perimeter outside the shear reinforced area as from MC2010 [56]. .. 49
Figure 3.1: Scheme of elevation of a typical flat slab structure. ... 53
Figure 3.2: Scheme of a typical flat slab structure under vertical loading. ... 54
Figure 3.3: Scheme and detail of a typical flat slab building under vertical and horizontal loading. ... 55
Figure 3.4: Scheme and detail of the rotation compatibilization system. ... 56
xii
Figure 3.8: Fabrication of the test specimens. ... 60
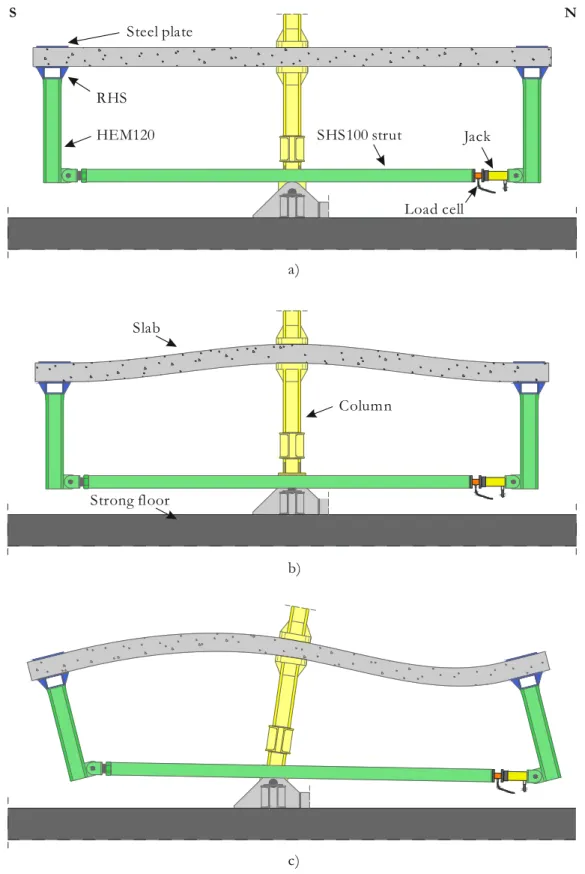
Figure 3.9: Scheme and detail of the rotation compatibilization system. a) Unloaded specimen; b) Vertically loaded specimen; c) Vertical and horizontally loaded specimen. .... 62
Figure 3.10: Detail of the struts with the load cells and hydraulic jacks. ... 63
Figure 3.11: Scheme and detail of the vertical displacement compatibilization system. a) Unloaded specimen; b) Vertically loaded specimen; c) Vertical and horizontally loaded specimen. ... 64
Figure 3.12: Scheme and detail of the vertical load system. Unloaded specimen. a) Side view; b) Front view. ... 65
Figure 3.13: Perspective of the test setup. ... 66
Figure 3.14: Scheme and detail of the complete test setup. Unloaded specimen. a) Side view; b) Front view. ... 67
Figure 3.15: Arrangement and details of the post installed shear bolts. Dimensions in millimetres. ... 70
Figure 3.16: Detail of the Shear bolts in the C-50 BR slab. ... 71
Figure 3.17: Arrangement and details of the stirrups. Dimensions in millimetres. ... 72
Figure 3.18: Positioning of the stirrups in the C-50 STR2. ... 73
Figure 3.19: Arrangement of the displacement transducers and loading points. Dimensions in millimetres. ... 75
Figure 3.20: Strain gauge LDT and wire LDT. ... 76
Figure 3.21: Instrumentation of the top flexural reinforcement. Dimensions in millimetres. ... 77
Figure 3.22: Instrumentation of the bottom flexural reinforcement. Dimensions in millimetres. ... 78
Figure 3.23: Instrumentation of the shear reinforcement. ... 78
Figure 3.24: Test setup ready for the test specimen. ... 79
Figure 3.25: Assembly of the column. ... 80
Figure 3.26: Cyclic horizontal displacement protocol. ... 83
Figure 3.27: Failure criterion for the cyclic tests. ... 84
Figure 4.1: Saw cut of the MLS specimen. ... 85
Figure 4.2: Vertical deformation of the MLS specimen. ... 86
Figure 4.6: Vertical displacement of the N-S axis of the E-50 specimen. ... 89
Figure 4.7: Position of the zero moment point in the N-S axis of the MLS specimen. ... 90
Figure 4.8: Strains in the top flexural reinforcement of the E-50 specimen. ... 91
Figure 4.9: Saw cut (N-S) of the C-50 specimen. ... 92
Figure 4.10: Saw cut (N-S) of the C-40 specimen. ... 92
Figure 4.11: Saw cut (N-S) of the C-30 specimen. ... 92
Figure 4.12: Top view of the failure of the C-50 specimen. ... 92
Figure 4.13: Hysteretic chart of the C-50 specimen. ... 93
Figure 4.14: Hysteretic chart of the C-40 specimen. ... 94
Figure 4.15: Hysteretic chart of the C-30 specimen. ... 94
Figure 4.16: Vertical displacement of the N-S axis of the C-50 specimen. ... 95
Figure 4.17: Vertical displacement of the N-S axis of the C-40 specimen. ... 96
Figure 4.18: Vertical displacement of the N-S axis of the C-30 specimen. ... 96
Figure 4.19: Position of the zero moment point in the N-S axis of the C-50 specimen. .... 97
Figure 4.20: Position of the zero moment point in the N-S axis of the C-30 specimen. .... 98
Figure 4.21: Strains in the top flexural reinforcement of the C-50 specimen. ... 99
Figure 4.22: Strains in the top flexural reinforcement of the C-40 specimen. ... 100
Figure 4.23: Strains in the top flexural reinforcement of the C-30 specimen. ... 100
Figure 4.24: Saw cut (N-S) of the C-50 BR specimen. ... 101
Figure 4.25: Saw cut (N-S) of the C-50 BC specimen. ... 102
Figure 4.26: Hysteretic chart of the C-50 BR specimen. ... 102
Figure 4.27: Hysteretic chart of the C-50 BC specimen. ... 103
Figure 4.28: Post failure at the vicinity of the column of the C-50 BR specimen... 103
Figure 4.29: Post failure at the vicinity of the column of the C-50 BC specimen. ... 104
Figure 4.30: Vertical displacement of the N-S axis of the C-50 BR specimen. ... 105
Figure 4.31: Vertical displacement of the N-S axis of the C-50 BC specimen. ... 105
Figure 4.32: Position of the zero moment point in the N-S axis of the C-50 BR specimen. ... 106
Figure 4.33: Position of the zero moment point in the N-S axis of the C-50 BC specimen. ... 107
Figure 4.34: Bending cracks at the bottom side of the C-50 BR specimen. ... 107
xiv
Figure 4.38: Strains in the shear reinforcement bolts of the C-50 BC specimen. ... 111 Figure 4.39: Saw cut (N-S) of the C-50 STR1 specimen. ... 112 Figure 4.40: Saw cut (N-S) of the C-50 STR2 specimen. ... 113 Figure 4.41: Saw cut (N-S) of the C-50 STR3 specimen. ... 113 Figure 4.42: Saw cut (N-S) of the C-50 STR4 specimen. ... 113 Figure 4.43: Hysteretic chart of the C-50 STR1 specimen. ... 114 Figure 4.44: Hysteretic chart of the C-50 STR2 specimen. ... 115 Figure 4.45: Hysteretic chart of the C-50 STR3 specimen. ... 115 Figure 4.46: Hysteretic chart of the C-50 STR4 specimen. ... 116 Figure 4.47: Vertical displacement of the N-S axis of the C-50 STR1 specimen. ... 117 Figure 4.48: Vertical displacement of the N-S axis of the C-50 STR2 specimen. ... 117 Figure 4.49: Vertical displacement of the N-S axis of the C-50 STR3 specimen. ... 118 Figure 4.50: Vertical displacement of the N-S axis of the C-50 STR4 specimen. ... 118 Figure 4.51: Position of the zero moment point in the N-S axis of the C-50 STR1 specimen. ... 119 Figure 4.52: Position of the zero moment point in the N-S axis of the C-50 STR2 specimen. ... 120 Figure 4.53: Position of the zero moment point in the N-S axis of the C-50 STR3 specimen. ... 120 Figure 4.54: Position of the zero moment point in the N-S axis of the C-50 STR4 specimen. ... 121 Figure 4.55: Strains in the top flexural reinforcement of the C-50 STR1 specimen. ... 122 Figure 4.56: Strains in the top flexural reinforcement of the C-50 STR2 specimen. ... 123 Figure 4.57: Strains in the top flexural reinforcement of the C-50 STR3 specimen. ... 124 Figure 4.58: Strains in the top flexural reinforcement of the C-50 STR4 specimen. ... 125 Figure 4.59: Strains in the bottom reinforcement of the C-50STR3 specimen. ... 126 Figure 4.60: Strains in the bottom reinforcement of the C-50STR4 specimen. ... 126 Figure 4.61: Positive bending moment at the South edge of the C-50STR3 specimen. ... 127 Figure 4.62: Strains in the shear reinforcement stirrups of the C-50 STR1 specimen. ... 128 Figure 4.63: Strains in the shear reinforcement stirrups of the C-50 STR2 specimen. ... 129 Figure 4.64: Strains in the shear reinforcement stirrups of the C-50 STR3 specimen. ... 130 Figure 4.65: Strains in the shear reinforcement stirrups of the C-50 STR4 specimen. ... 131
C-50. ... 134 Figure 4.68: Envelope curves of the specimens with stirrups and the reference specimen C-50. ... 135 Figure 4.69: Envelope curves of the specimens that avoided punching failure and the reference specimen C-50. ... 135 Figure 4.70: Equivalent viscous damping for asymmetric hysteretic loops (adapted from Marreiros [62]). ... 137 Figure 4.71: Equivalent viscous damping for slabs without shear reinforcement. ... 138 Figure 4.72: Equivalent viscous damping for slabs with bolts as shear reinforcement, compared with the reference specimen C-50. ... 138 Figure 4.73: Equivalent viscous damping for slabs with stirrups as shear reinforcement, compared with the reference specimen C-50. ... 139 Figure 4.74: Equivalent viscous damping for slabs that avoided punching failure, compared with the reference specimen C-50. ... 139 Figure 5.1: Drift as a function of the vertical shear ratio (EC2). Ramos et all [59]. ... 142 Figure 5.2: Drift as a function of the vertical shear ratio (MC2010 LoA III). Ramos et all [59]. ... 142 Figure 5.3: Shear reinforcement ratio (Asw/Acw) versus experimental shear ratio (Vexp/Vc.)
from slabs from the literature. ... 147 Figure 5.4: Influence area of the first layer of shear reinforcement (Acw) ... 148 Figure 5.5: Proposed stirrup arrangement... 149
Table 2.1: Characteristics of the specimens, test protocol and failure (adapted from Hanson [1]). ... 7 Table 2.2: Characteristics of the specimens and failure modes (adapted from [40], [24] and [41]). ... 9 Table 2.3: Characteristics of the specimens and test protocol (adapted from Pan [10]). .... 14 Table 2.4: Characteristics of the specimens (adapted from Robertson [45] [13]). ... 17 Table 2.5: Characteristics of the specimens and test parameters (adapted from Megally [26], Ritchie [15] and Gayed [14]). ... 20 Table 2.6: Characteristics of the specimens (adapted from Anggadjaja [21] and Himawan [23]). ... 24 Table 2.7: Characteristics of the specimens (adapted from Polak [37], El-Salakawy [36] and Bu [49]). ... 31 Table 2.8: Characteristics of the specimens (adapted from. Durrani [5] and Robertson [2], [3], [50]). ... 33 Table 2.9: Values for the kc parameter. ... 44 Table 3.1: Effective depth of the top flexural reinforcement. ... 69 Table 3.2: Reinforcement characterization. ... 73 Table 3.3: Concrete characterization. ... 74 Table 3.4: Details of the experimental tests. ... 82 Table 4.1: Failure details of all tested specimens ... 136 Table 5.1: Details of the considered tested specimens ... 146
Roman letters
a constant
Acw influence area of the first layer of shear reinforcement
Asw sum of the cross-section areas from all the steel reinforcement that efficiently contribute to punching resistance (well anchored and crossing a 45º crack)
Aw, s the area of the cross section of the shear reinforcement in a single perimeter around the column to be used for seismic actions
b constant
b0, ACI control perimeter of the punching failure zone in ACI 318 b0, EC2 control perimeter of the punching failure zone
b0, MC2010 control perimeter according to MC2010
b1 dimension of the perimeter b0 in the direction of the application of the
horizontal loading
b1, red reduced control perimeter due to non uniform stress distribution b2 dimension of the perimeter b0 in the direction of the application of the
horizontal loading
bs width of the slab strip according to MC2010
bu diameter of circle with an area equal to the area of the control perimeter by maximum dimension of the control perimeter in the direction of the
application of the horizontal loading
bz maximum dimension of the control perimeter in the direction perpendicular to the application of the horizontal loading
c constant
c1 column dimension in the direction of the horizontal loading
c2 column dimension in the direction perpendicular to the horizontal loading cL distance from the centre of the column to the line of the control perimeter
xx d average effective depth of the slab dg maximum dimension of the aggregates dg0 reference aggregate size equal to 16 mm dr inter-story drift
dv effective depth of the slab considering support penetration E Modulos of Elasticity (Young)
eL distance parallel to the eccentricity from each point of the control perimeter to the bending moment action axis
Es modulus of elasticity of the flexural reinforcement Es modulus of elasticity of the shear reinforcement
eu eccentricity of the shear force relative to the centroid of the control perimeter
fbd design bond strength
fc average concrete compressive strength in cylinders fc,cube average concrete compressive strength in cubes fcd design compressive strength of the concrete fck characteristic compressive strength of the concrete fct,sp average concrete traction strength by splitting test fy average yield strength of the flexural reinforcement
fyt characteristic value of the yield stress of the shear reinforcement fywd,ef effective stress in the shear reinforcement
Jc parameter analogous to the moment of inertia k factor that takes size effect into account
kc factor that takes into account the ratio of the dimensions of the column ke eccentricity coeficiente
MEd design unbalanced moment in the column region
Mf, ACI parcel of the unbalanced moment transferred by flexure from the column to the slab
mRd average design flexural strength per unit of length
Ms, ACI parcel of the unbalanced moment transferred by shear from the column to the slab
Msc total unbalanced moment to be transferred from the column to the slab msd average distributed bending moment
rs distance from the centre of the column to the counter-flexure point
rs, x distance from the centre of the column to the counter-flexure point in the x direction
rs, y distance from the centre of the column to the counter-flexure point in the y direction
SR vertical shear ratio
s0 distance from the face of the column to the first shear reinforcement layer sr distance between shear reinforcement perimeters
V shear force
Vc value for the concrete contribution for the punching resistance
Vc, ACI ACI 318 value for the concrete contribution for the punching resistance Vc, EC2 EC2 value for the concrete contribution for the punching resistance
Vc,MC2010 MC2010 value for the concrete contribution for the punching resistance Vcrush, ACI ACI 318 concrete crushing resistance near the column
Vcrush, EC2 EC2 concrete crushing resistance near the column Vcrush, MC2010 MC2010 concrete crushing resistance near the column VEd design shear force
xxii
Vflex shear force associated to the failure of the slab by flexure Vout, ACI ACI 318 provision of the punching resistance outside the shear
reinforcement
Vout, EC2 EC2 provision of the punching resistance outside the shear reinforcement VR CSCT provision of the punching resistance
VRd EC2 provision of the punching resistance
Vs, ACI ACI 318 provision of the shear reinforcement contribution in the punching resistance
Vs, MC2010 MC2010 provision of the shear reinforcement contribution in the punching resistance
Vsr, ACI ACI 318 provision of the punching resistance for slabs with shear reinforcement
Vsr, EC2 EC2 provision of the punching resistance for slabs with shear reinforcement
W1 function of the distance between each point of the control perimeter and the axis of action of the unbalanced moment
Greek letters
εy average yield strain
εyk, w design yield strain of the shear reinforcement
w, max maximum allowed strain for the shear reinforcement
Ø reduction factor
Øw diameter of the shear reinforcement
l weighted flexural reinforcement ratio of the slab
y flexural reinforcement ratio of the slab in the longitudinal direction z flexural reinforcement ratio of the slab in the transverse direction swd average design flexural strength per unit of length
towards the column)
αs parameter that takes into account the position of the column within the slab (40 for interior columns, 30 for edge columns and 20 for corner columns β magnifying factor due to moment eccentricity
βc ratio of the longest over the shortest column side
γc reduction factor for the concrete according to the ruling regulation γf fraction of the total moment to be transferred by flexure
δcol horizontal displacement due to the flexibility of the column
λ parameter that takes into account the type of concrete (1 for regular concretes)
υu shear stress at the control perimeter
γc reduction factor to be applied in the calculation of the concrete crushing resistance near the column
Chapter 1
Introduction
1.1 Background
Earthquakes can be devastating events with numerous losses both human and economical. To minimize those losses, special cares must be taken by civil engineers when designing structures in seismic zones. Flat slab structures have been widely used lately. Its architectural and economic advantages made them a top choice for both office and residential buildings. Its main advantage, the beam absence, leads to one of its main weakness: the punching failure. Although this is a reasonably well-known phenomenon for monotonic vertical loading, flat slab punching failure under cyclic horizontal loads is not yet sufficiently understood. Being a quite complex case study, with a large number of variables to consider, the amount of experimental information regarding the behaviour of flat slabs under reversed cyclic horizontal loading is clearly insufficient.
To study this subject, various methods were used by researchers. The first approach was to try to create a simplified experimental model of the slab-column connection. This simplification was introduced by Hanson [1] and inspired all the simplified test setups used in future works. Some researchers opted to follow a multi frame experimental approach (eg. Robertson [2], [3], Durrani [4], [5], Dechka [6], Hwang [7], Rha [8]). The multi frame test setup has the main advantage of being more faithful to the real structure, however, it is more expensive and difficult to implement in a laboratorial context. Other researchers such as Hawkins [9], Pan [10], Tegos [11], Warnitchai [12], Robertson [13], Gayed [14], Ritchie [15], Han [16], Park [17], Benavent-Climent [18], [19], [20], Anggadjaja [21], Eder [22] and Himawan [23] continued working in the subject of flat slabs under vertical and seismic actions, using variations of the simplified test setup, progressively changing details trying to overcome the limitations of the simplified approach. All tests led to the conclusion that flat slabs are susceptible to fail by punching under seismic actions, leading in some cases to progressive collapse as documented in recent events.
2
Researchers started to test ways to improve the behaviour of flat slab structures by adding various types of shear reinforcement such as steel stirrups (Hawkins [24], Robertson [25]), shear studs (Megally [26] and Isufi [27]), and other methods (Park [28], Esfahani [29], Kang [30], Cheng [31], Song [32], Al-Nasra [33]) with satisfactory results. For existing structures, there is the need to strength them. Two main methods were tested for this purpose: Fiber Reinforced Polimer (FRP) bands (Stark [34], Widianto [35]) and shear bolts (El-Salakawy [36]. Polak [37], Lawler [38], Topuzi [39]). The various shear reinforcement methods enhanced the behaviour of the flat slabs by increasing drift capacity, moment transfer capacity and energy dissipation.
1.2 Motivation and objectives
Throughout the years, researchers have studied the subject of the behaviour of flat slabs under gravity and horizontal cyclic loads using, mostly, simplified test setups that fail to replicate the real boundary conditions at the borders of the truncated models used as test specimens. The complexity of the deformed shape of flat slab structures when subjected to seismic loads is difficult to replicate in a simplified system, which results in a progressive search for improvements by the researchers introducing variations to the test setups when developing and implementing their own. The improvements done along the last decades although important, did not solve all the problems associated with the simplified test setups. The objective of this dissertation is to contribute to the research on this topic by introducing a new and improved approach to the simplified test setup, as well as contribute with experimental test results regarding the influence of parameters such as shear ratio, shear reinforcement ratio, shear reinforcement arrangement and post installed shear reinforcement. A test setup with passive real time systems to approximate the real force distribution and therefore, the real deformed shape was developed and used to test eleven specimens, that were grouped as follows: one monotonic centred, one monotonic eccentric, three cyclic tests with different shear ratios, four with steel stirrups as shear reinforcement and two cyclic tests with steel bolts as post installed shear reinforcement. By using test specimens with similar characteristics as well as the same test setup and test protocol, it was possible to directly compare the influence of each studied parameter, with minimal unknown variables.
1.3 Dissertation organization
This dissertation is organized in five chapters, including the present one.
Chapter 2 summarizes the experimental tests performed in flat slabs subjected to horizontal cyclic actions, through the last decades. Special importance was given to the test setups developed and used by the authors that have been constantly evolving in order to achieve in the laboratory environment, the most accurate approximation to the behaviour of the real slabs. Tests in slabs without shear reinforcement, slabs with stirrups and slabs with post-installed reinforcement are shown and the obtained results are presented. The methodology proposed by three building codes for the design of flat slabs with and without shear reinforcement are presented.
Chapter 3 describes the thought process behind the development of the test setup used in the experimental campaign. The predesign and the design of the test setup and the test specimens is shown, followed by the production of the specimens and the results of the characterization tests of the used materials. The different test specimens are presented, as well as the details of the test assembly, instrumentation, protocols and proceedings.
Chapter 4 is where the results of the experimental campaign are shown, compared and discussed. The specimens are presented arranged in groups, sorted by type of test (with or without eccentricity) and studied variable. Results of the hysteretic response, stress distribution, slab deformation and energy dissipation are shown for each tested specimen. In Chapter 5, the tested slabs and the obtained results are applied in a real design situation. The difficulties in the quantification of the vertical shear ratio, the scattering of the test results from literature and the need for shear reinforcement are addressed. Finally, a minimum shear reinforcement is proposed.
Chapter 6 presents the conclusions of the dissertation, a synthesis of the design proposals and suggestions for future researches on this dissertation scope.
Chapter 2
Literature Review
In this chapter, a review of a number of studies about the subject of this dissertation is presented, and arranged by authors. The first sub-chapter approaches studies where smaller simplified specimens were used. The second sub-chapter describes tests on larger multi frame specimens. Lastly, the specifications from Eurocode, ACI, and Model Code 2010 for punching, eccentric punching and, when applicable, punching under cyclic horizontal actions are presented.
2.1 Experimental tests using simplified setups
The transference of unbalanced moment from the column to the slab has been studied since the 1960s, however, the amount of experimental studies in this subject is massively small when compared to the number of tests on flat slabs subjected to centred punching.
Hanson and Hanson, 1968
The first studies where an unbalanced moment was considered consisted in the application of a monotonic eccentricity which prompted an unbalanced moment to be absorbed by the slab through the slab-column connection. The studies of Hanson [1], published in the decade of 1960, presented experimental tests using three types of loading: horizontal displacement without vertical load (with reversed cycles in some cases), vertical load without eccentricity and vertical load with eccentricity.
Sixteen specimens representing an interior slab-column connection were tested, as well as one specimen with an edge column. The dimensions of the slab were 2135 mm by 1220 mm (1143 mm by 1220 mm in the case of the slab with edge column) and the thickness of the slab was 76 mm. The top and bottom reinforcement consisted in a mesh of 9.5 mm diameter reinforcement bars spaced 76 mm from each other. The clear cover was 10 mm and the higher effective depth was parallel to the longitudinal axis. The columns were made of reinforced concrete with a steel plate welded to the reinforcement bars at the bottom end, to further be connected to a hinged support. The top end of the column was pinned to four
6
braces that were also fixed to the strong floor. A scheme of the test setup can be seen in Figure 2.1.
Figure 2.1: Test setup adapted from Hanson [1].
The parameters under consideration were, the type of loading, the geometry of the column, the position of the column and the existence of holes (25 mm by 152 mm) in opposite sides of the slab-column connection. All the details are summarized in Table 2.1.
The loading was applied as line forces by means of two steel spreader beams with two steel rods each. In the Type I test, antisymmetric forces were applied in the opposite borders to simulate eccentricity without vertical load. The Type II test consisted in symmetric vertical forces simulating the action of vertical loading only. Only one side was loaded in the Type III protocol in order to simulate both eccentricity and vertical load. The eccentric cyclic action was applied by load control, making it impossible to accurately measure the corresponding inter-story drift. Failure modes are also shown in Table 2.1.
Table 2.1: Characteristics of the specimens, test protocol and failure (adapted from
Hanson [1]).
Specimen Column (mm²) Load Type Holes fc (MPa) fy (MPa) Failure
A1 152x152 Interior Eccentric without vertical load. A2, A4L and A6C were Cyclic - 30.3 365.4 Shear A2 31.3 375.8 A3L //Long 37.0 364.0 A4L 33.4 373.7 A5C //Short 35.0 371.6 A6C 34.9 368.2 B7 152x305 Interior - 33.0 354.4 C8 305x152 Interior 32.8 410.9 A9 152x152 Interior Vertical load only 34.7 368.9 A10L //Long 30.9 354.4 Flexure A11C //Short 33.4 348.2 A12 Eccentric with vertical load. - 33.2 372.3 A13L //Long 32.8 370.2 Shear A14C //Short 35.6 372.3 D15 152x152 Edge - 31.1 365.4 B16 152x305 Interior 30.4 3340.6 C17 305x152 Interior 36.0 341.3
Hawkins, Mitchell et al, 1974-1976
In the late 1970s, Hawkins [24], [40] acknowledged the importance of the capacity of the flat slab structures to convey the designed deformations without shear failure. With the recent Alaska (1964), Caracas (1967) and San Fernando (1971) earthquakes in mind, the author studied the behaviour of slabs with and without shear reinforcement. During the development of the studies, ten specimens designed to simulate full scale interior slab-column connections representative of a prototype building. This work was followed by Symonds [41], that tested 5 five additional slabs, using the same test setup and type of specimens with the same geometry and dimensions.
The specimens measured 3962 mm by 2134 mm with a thickness of 152 mm. The column consisted in two halves, with 1067 mm length each and a square cross section of 305 mm width. Both top and bottom extremities of the column were pinned to tie rods and to the
8
strong floor, respectively, in order to prevent them from moving while allowing rotation as seen in Figure 2.2. The vertical load was applied by hydraulic jacks with shared hoses assure balanced forces. The eccentric load was applied as a line load, along the most distant opposite borders, by push-pull jacks at a distance of 1829 mm from the centre of the column. From a total of fifteen specimens, eight had no shear reinforcement (S1, S2, S3, S4, S5 [40] [24], S6, S7 and S8 [41]) and seven had two legged steel stirrups as shear reinforcement (SS1, SS2, SS3, SS4, SS5 [40] [24], SS6 and SS7 [41]) displaced along the orthogonal axis with a spacing of 38 mm, varying the distance from the column to the last layer (shear reinforcement radius).
Figure 2.2: Test setup used by Hawkins (adapted from Hawkins [40]).
The flexural reinforcement was also a tested variable, both in ratio and arrangement of the reinforcement bars. The clear cover was 19 mm and the higher effective depth was parallel to the longer sides of the specimens. Details of the specimens are depicted in Table 2.2.
Vertical Loading Points
Table 2.2: Characteristics of the specimens and failure modes (adapted from [40], [24] and [41]). Name fc (MPa) Flexural reinforcement
ratio (%) load (kN) Gravity
Shear
reinforcement Failure Top Bottom (mm) Ø Radius* (mm)
S1 30.3 1.29 0.59 128.1 - - Punching S2 30.7 0.90 0.49 142.3 - - Punching S3 31.4 0.57 0.40 138.8 - - Punching S4 54.7 1.29 0.59 149.9 - - Punching S5 - 1.10 0.56 Unknown - - Unknown S6 23.2 1.10 0.56 271.3 - - Punching S7 26.5 0.90 0.49 271.3 - - Punching S8 30.8 0.57 0.40 235.8 - - Flexure SS1 27.6 1.29 0.59 133.0 9.5 400 Crushing SS2 25.7 0.90 0.49 126.3 6.4 286 ** SS3 25.9 1.10 0.56 126.8 9.5 362 Punching (out) SS4 27.6 1.10 0.56 127.7 9.5 362 Punching (out) SS5 32.2 0.90 0.49 125.9 6.4 324 Punching (out) SS6 24.2 0.90 0.49 271.3 9.5 324 Punching (out) SS7 26.9 1.10 0.56 271.3 6.4 514 Punching (out)
*radius of the reinforced area
**premature failure due to malfunction.
The lateral loading cycles were given in order to achieve a target load or a target ductility, therefore, because of the way the test setup was conceived and due to the non-linearity of the deformed shape, an accurate measurement of the drift was not possible. The authors used different test protocols varying the number of cycles and the target loads. When failure was not achieved, a monotonic centred load was applied until failure.
The authors observed that the reinforcement bars that pass through the column, as well as the ones right next to it, were the most stressed due to the moment transfer from the column to the slab, however, yielding was reached for the top reinforcement later in the test and it never occurred for the bottom reinforcement. The authors concluded that stirrups are effective if well detailed and applied [24] resulting in an increase in ductility, energy absorption, shear capacity and moment transfer.
Ghali and Dilger, 1976
A different test setup was used by Ghali [42] to compare the behaviour of slab-column connections subjected to cyclic horizontal loads to the specimens under quasi-static eccentricity, along with different flexural reinforcement ratios. The test setup had the specimen held along the two edges perpendicular to the eccentricity direction. To facilitate
10
the test assembly, the specimens were placed with a 90 degree angle from the normal position (the slab rests vertically and the column, horizontally). Both the vertical and horizontal loading were applied in the column. The eccentric load consisted in applying antisymmetric forces in both column edges while the gravity load resulted from compression in the bottom column edge, as shown in Figure 2.3.
Figure 2.3: Test setup adapted from Ghali [42].
A total of six specimens were tested. The specimens, representing square slabs with 1830 mm width and 152 mm thick, were truncated at the theoretical inflection line for the vertical load. From end to end, the column measured 1170 mm divided in two halves in each side of the slab and its square cross section was 305 mm width. Three different flexural reinforcement ratios were used (0.5%, 1.0% and 1.5%) with a clear cover of 19 mm. For each reinforcement ratio, two tests were performed: a quasi-static horizontal loading combined with vertical load and a cyclic eccentric loading combined with vertical load.
All specimens failed by punching in the slab-column connection however, the specimen with the smaller reinforcement ratio presented generalized reinforcement yielding. Among the main findings of this work, the test speed was shown to influence the response of the materials that show an increase in strength for faster actions. The increase in the flexural reinforcement ratio, resulted in an increased strength, but reduced ductility and energy abortion capacity.
Morrison et al, 1983
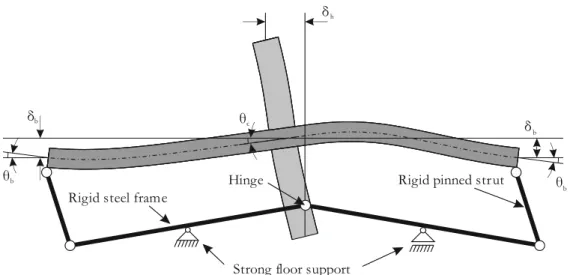
To study the influence of the dynamic horizontal actions on the slab-column connection with and without vertical load, Morrison [43] used a different approach regarding the test setup. The specimen was supported by a hinged support at the bottom of the column and double pinned struts at the borders perpendicular to the imposed displacement. The struts
Lateral Load
Vertical Load
worked as a simple support that prevented vertical displacements only at the supported borders while an imposed displacement was applied at the top edge of the column. Some specimens were loaded vertically in four equidistant points at a distance of 467 mm from the closest corner of the column, as shown in Figure 2.4.
Figure 2.4: Test setup adapted from Morrison [43].
All slabs had similar geometry and were designed to be a reduced scale model of 1/3 of a typical flat slab structure, cut at mid-span. This resulted in square specimens with 1829 mm width and a thickness of 76 mm. The column had a total length of 1118 mm and a 305 mm width square cross section.
The flexural reinforcement ratios of 0.65 %, 0.98 % and 1.31 % were used for S1, S2 and S3 specimens (no vertical load), respectively. The S4 and S5 specimens had a flexural reinforcement ratio of 0.98% and were subjected to vertical loads of 14.3 kN and 28.6 kN respectively. The effective depth along the direction of the imposed displacement was 64 mm. The concrete compressive strength for the S1 specimen was 45.8 MPa while for the remaining ones, it averaged 34.8 MPa.
The cyclic imposed displacement protocol consisted in ten reversed complete cycles in each drift step, increasing the imposed displacement in each step, until a total of thirty cycles were achieved. Then, two more cycles with a higher displacement were applied followed by a non-cyclic increasing displacement until failure. The author also used an analytical model based in beams to approximate the behaviour of the experimental models.
The failures occurred by yielding of the flexural reinforcement and, for reinforcement ratios over 1.0 %, it happened for loads lower than provisioned, which means that the results were against safety. The specimens with higher reinforcement ratios showed less ductility. The
Lateral Load Vertical Load Vertical Load
12
experimental results showed that the vertical load had little influence on the strength of the specimens. The beam based analytical model was a good approximation for this case. Pan and Mohele, 1993
A different test setup was used by Pan [10] in order to study the effect of bi-directional cyclic horizontal loading in interior slab-column connections of flat slab structures. The specimens were supported by bi-directional bearings at both ends of the column and at the edges, representing the mid-span of the slab (where the inflection point for the horizontal loading was assumed), as detailed in Figure 2.5.
Figure 2.5: Test setup adapted from Pan [10].
To apply the horizontal displacements at the top of the column in two orthogonal directions two actuators were used, as well as a vertical jack, under the column, to apply the vertical
Vertical load weights N-S actuator E-W actuator Reaction wall Reaction frame Instrumentation frame Torsion restriction frame
Reaction frame E-W actuator Instrumentation frame Vertical load weights Steel strut
Vertical load jack
Elevation view Plan view
load. To better approximate the theoretical shear distribution curve, weights were added at the top of the slab. A restraining frame was used to prevent torsion during the test. A total of five tests were performed on four specimens, as summarized in Table 2.3.
The slabs were 3/5 reduced models of a typical flat slab building, and consequentially square 3.97 m width slabs, with 122 mm of thickness, with an 1.83 m length column with a square cross section with 274 mm width. All specimens had similar flexural reinforcement ratio of 0.76 % in the column region.
14
Table 2.3: Characteristics of the specimens and test protocol (adapted from Pan
[10]).
Specimen fc (MPa) Test Vertical Load (MPa)
1 33.3 Uniaxial 0.7
2 33.3 Biaxial 0.7
3 31.4 Uniaxial 0.4
4 31.4 Biaxial 0.4
5* 51.0** Biaxial 0.4
*Specimen 4 after failure and being repaired by cleaning and adding grout. **Mean compressive strength of the repair grout.
The obtained results indicate that the vertical load has a central role in the resistance of the specimens. The slabs with the smaller vertical load presented increased stiffness and strength to the horizontal load. The biaxial action reduced the ductility, drift capacity and the overall strength. The use of bottom reinforcement bars that pass though the column is essential for post failure behaviour, to prevent progressive collapse. The repaired specimen presented satisfactory ductility but was not able to mobilize as much horizontal load that the other specimens did.
Soares, 1993
In 1993, Soares [44] assessed the suitability of the ruling codes regarding monotonic eccentric horizontal loads in reinforced concrete flat slabs. Two monotonic eccentric tests were performed in 3.00 m width square specimens with a thickness of 100 mm. The concrete columns had a cross section of 200 mm by 200 mm and a total length of 1700 mm from top to bottom, that represented the distance between inflection points.
The test setup, showed in Figure 2.6, had the specimens supported by steel tendons at the free borders perpendicular to the eccentricity direction and a passive system to impose positive bending moments in all free borders. Because the free borders represented the mid-span of the slab, under vertical load, the behaviour of the specimen would be similar to a cantilever, resulting in higher bending moments in the column region. Thus, a system consisting in four pinned struts (two in each direction) connected to hanging steel profiles solidly connected to the slab was used. The length of the struts was adjusted for each slab prior to the application of the vertical load. The vertical load was applied in sixteen equidistant points by means of spreader beams connected to two hydraulic jacks by steel tendons.
Figure 2.6: Test setup used by Soares (adapted from Soares [44]).
A flexural reinforcement ratio of 1.0 % was used for both slabs with the higher effective depth in the direction of the horizontal loading. The test protocol was different for both specimens. The specimens were first subjected to a vertical load of 140.9 kN. Then, a horizontal displacement at the top of the column was applied to the JS2 specimen until failure. The JS3 specimen was unloaded until a vertical load of 97.3 kN was reached and then, a horizontal displacement at the top of the column was applied until failure.
The author concluded that the moment imposition system worked well, however, the border restraining system had to be improved in order to control the transverse loads applied to the specimens. The codes predictions showed dispersion regarding slabs under eccentric loading. Tegos and Tsonos, 1996
Using a similar approach to Ghali [42], Tegos [11] developed a test setup that consisted in a slab specimen rotated ninety degrees and supported at the borders being the horizontal and vertical loads applied at the end of the column. The supports prevented displacements on the borders perpendicular to the horizontal action while allowing rotations. The slabs were squares with 1.60 m width and 120 mm thick with a column 650 mm long and 200 mm width square cross section. The column was hanged from the bottom of the slab, as depicted in
16
Figure 2.7: Test setup adapted from Tegos [11].
Three specimens, with an average cylinder concrete compressive strength of 25 MPa, were cast and tested: L1 had no shear reinforcement; S1 had six 8 mm diameter reinforcement bars going through the column and bent down with a 45º angle; in specimen F1 a fiber reinforced concrete was used, with 30 kg/m³ of 50 mm long steel fibers. The flexural reinforcement was similar for all specimens and consisted in 8 mm diameter reinforcement bars spaced of 100 mm with a higher concentration in the column region (ten bars spaced of 50 mm) and an effective depth of 100 mm.
The test protocol consisted in loading the specimen vertically with 75 kN and kept constant, followed by reversed cyclic horizontal loads at the end of the column.
Both L1 and F1 failed by punching, however the presence of steel fibres changed the failure from brittle to gradual. The S1 specimen developed significant cracking over the column and presented a mix of flexural and punching failure. In this test, inclined reinforcement bars performed better than steel fibres but both solutions enhanced the performance of the specimens.
Robertson et al, 2002-2006
Robertson tested the efficiency of three different types of shear reinforcement [45] and the influence of vertical shear ratio and continuous flexural reinforcement [13] in the load capacity of flat slab interior column connections subjected to seismic and gravity loading. The test setup approach was similar to the one used by Morrison [43]. The specimens were supported by double pinned steel struts at the edges perpendicular to the horizontal load direction, representing the mid-span of the slab, and by the bottom column. The column consisted in two elements, being the horizontal load applied at the top one, as shown in Figure 2.8. Lateral Load Vertical Load Lateral Load Slab Column Support
Figure 2.8: Test setup used by Robertson (adapted from Robertson [45]).
All specimens were similar in dimensions, measuring 2743 mm by 3048 mm, in plan, supported on the shorter edges. The thickness was 114 mm and the reported effective depth was 100 mm. The distance between both ends of the column, representing the inflection points of the column, was 1372 mm and it had a square cross section of 254 mm width. The first batch of specimens had eleven layers of eight 6 mm diameter bars as shear reinforcement, spaced of 65 mm in the radial direction, and continuous flexural reinforcement while the second set had discontinuous flexural reinforcement with different ratios as well as different vertical shear ratios. All the details of the specimens are summarized in Table 2.4
Table 2.4: Characteristics of the specimens (adapted from Robertson [45] [13]). Specimen (%) fc
(MPa) reinforcement Shear
Average vertical load (kN) Drift (%) Failure 1C 0.80 35.4 - 38.9 3.5 Punching 2CS 0.80 31.4 Closed stirrups 33.7 8.0 -
3SL 0.80 43.4 Single leg stirrups 24.9 8.0 -
4HS 0.80 38.2 Shear studs 35.4 8.0 - ND1C 0.53 29.6 - 60.8 8.0 Flexure/Punching ND4LL 0.53 32.3 - 93.4 4.0 Flexure/Punching ND5XL 0.53 24.1 - 104.8 2.0 Punching ND6HR 0.93 26.3 - 67.2 4.5 Punching ND7LR 0.39 18.8 - 68.5 4.5 Flexure/Punching ND8BU 0.93 39.2 - 65.3 4.5 Flexure/Punching The vertical load was applied using concrete blocks suspended from underneath the slab while the horizontal load was imposed at the top of the column by an actuator, in increasing
Load cells Load cell Reaction frame
Actuator
18
drift steps up to 4.0 %, of three cycles per drift step. Afterwards, increasing positive only steps of three cycles per step were imposed until a maximum of 8.0 %.
The obtained results showed that the three types of shear reinforcement were equally efficient in preventing failure until the end of the test protocol for the considered vertical load and increased the horizontal peak load by 22 %. Specimens with discontinuous bottom flexural reinforcement presented a similar behaviour to the ones with continuous bars, however, the lack of inferior reinforcement bars passing through the column lead to full loss of load transmission from the slab to the column, what may lead to progressive collapse in a real structure. The author concluded that increased gravity load reduced the drift capacity and, slabs with higher flexural reinforcement ratio, may suffer from premature punching failure due to increased moment transfer.
Megaly, Ritchie, Gayed et al, 1998-2006
Following the studies performed by Ghali and Dilger [42], similar specimens and the same test setup were used by Megally [46] [26], Ritchie [15] and Gayed [14]. Edge and interior connections were tested using several variables, to be detailed further. The test setup was an upgrade of the one used by Ghali [42]. The specimens were rotated 90º (with the slab plan in the vertical position) and were supported by the edges (at quarter-span lines) with neoprene supports. The gravity load was imposed by a horizontal actuator while two vertical actuators applied the horizontal loading at both ends of the column. An elevation view of the test setup is presented in Figure 2.9.
Two sets of specimens were cast: interior slab-column connections and edge slab-column connections some of which were prestressed. The interior column-slab connection specimens measured 1.90 m by 1.90 m with the edge ones measuring 1.90 m by 1.35 m. All specimens were 150 mm thick. The column consisted in two 700 mm long half columns with a 250 mm width square cross section.
Figure 2.9: Test setup adapted from Ritchie [15].
Details on the flexural reinforcement are presented in Table 2.5. The reported effective depth was 114 mm for the non prestressed bars. The prestress strands were bonded. Each strand had a dead-end anchorage inside the slab and a stressing anchor were the prestress was applied. The flexural resistance was kept similar by reducing the number of ordinary reinforcement bars when the number of prestress strands increased. The shear reinforcement consisted in eight single legged studs by layer, with 9.5 mm diameter each. Details on the number of layers and stud spacing are presented in Table 2.5. A vertical load was applied and kept constant during the test for a combined action of gravity and horizontal loads. The cyclic loading followed a protocol comprised of increasing drift steps of four cycles per step, until a total of eight steps were completed. Then, increasing cycle steps were performed until failure was achieved.
20
Table 2.5: Characteristics of the specimens and test parameters (adapted from
Megally [26], Ritchie [15] and Gayed [14]).
Specimen (%) (MPa) fc Type Prestress (kN) Studs load (kN) Vertical x y x y layers; spacing MG-2A 1.66 1.69 32 Edge - - - 120 MG-3 1.66 1.69 34 - - 7; 0.75d 120 MG-4 1.66 1.69 32 - - 7; 0.75d 180 MG-5 1.66 1.69 28 - - 7; 0.75d 60 Mg-6 1.66 1.69 30 - - 5; 0.44d 120 EC0C 1.39 1.43 28 - - 8; 0.48d 110 EC3C 1.02 0.78 26 3x35 1x10⁵ 8; 0.48d 110 EC5C 0.92 0.65 26 5x35 2x88 8; 0.48d 110 EC7C 0.74 0.52 29 7x35 2x82 8; 0.48d 110 EC9C 0.37 0.26 28 9x35 2x10⁵ 8; 0.48d 110 IPS-9 0.37 0.37 23 Interior 9x35 3x10⁵ 8; 0.48d 240 IPS-9R 0.37 0.37 26 9x35 3x10⁵ 8; 0.48d 240 IPS-7 0.55 0.46 31 7x35 3x82 8; 0.48d 240 IPS-5 0.65 0.46 29 5x35 3x88 8; 0.48d 240 IPS-5R 0.65 0.46 28 5x35 3x88 8; 0.48d 240 IPS-3 0.83 0.65 27 3x35 3x10⁵ 8; 0.48d 240 IPS-0 1.11 0.83 26 - - 8; 0.48d 240 x represents the horizontal loading direction
d is the effective depth (d=114 mm)
All the edge slab-column connection specimens failed by punching near the column, while the interior ones, failed by punching outside the shear reinforced area. The MG-2A specimen achieved a maximum drift of 1.25%. The use of shear studs increased the drift capacity by 450%. The use of prestress does not affect adversely the drift capacity of the specimens. Prestressed slabs presented less stiffness loss and less energy dissipation capacity.
Warnitchai and Prawatwong, 2004-2012
Warnitchai [12] and Prawatwong [47] Used a test setup similar to the one used by Robertson [45], schematized in Figure 2.10, by using vertical double pinned struts to fasten the borders of the slab. Similar specimens were used to test the effect of post-tension in the behaviour of flat slab structures under seismic actions [12] and the efficiency of a drop panel in the column region [47].
Figure 2.10: Test setup used by Prawatwong (adapted from Prawatwong [47]). Two specimens (S1 and S2) with a square plan view with 5700 mm width and a thickness of 120 mm were tested. The cross section of the column was rectangular with 500 mm by 250 mm sides, being the higher dimension aligned with the imposed displacement direction. The column had a total length of 1.80 m between the top and bottom hinges that simulate its inflection points.
The top regular flexural reinforcement was placed in the column region only, and consisted in bars of 10 mm diameter and 2.00 m long, of which eight were parallel to the longer column width and ten were arranged in the perpendicular direction, spaced of 80 mm. The bottom reinforcement was a mesh of 10 mm diameter bars with 550 mm spacing. The specimens were post-tensioned with eight 12.7 mm diameter strands in each direction, spaced of 350 mm in the horizontal loading direction and 700 mm in the transverse direction and with a 147.2 kN effective prestress force.
A square drop panel of 1.60 m width and 80 mm thick, reinforced with a mesh of 10 mm diameter bars anchored in the slab and spaced of 200 mm was used. The drop panel influenced the effective depth of the S2 specimen, resulting in an average effective depth of 70 mm for S1 and 150 mm for S2. The concrete cylinder compressive strength at the date of the test was 41.1 MPa and 45.9 MPa for S1 and S2, respectively. The test protocol comprised two cycle drift steps, increasing each step by 0.25 % up to 3.00 % and, after, a 1.00 % increase for each step up to failure. Throughout the test, a non-specified vertical load was imposed by means of weights laid on the surface of the specimen in order to achieve an average shear ratio for a representative building.
Actuator
Load cell
Drop panel
Steel strut Slab
22
The presence of prestress did not avoid a brittle punching failure for the S1 specimen for a 2.0 % drift while, the use of a drop panel, increased the drift capacity up to 6.0 % and the ductility of specimen S2.
Benavent-Climent et al, 2008-2009
Both edge and interior slab-column connections were tested, using a test setup similar to the one used by Robertson [45]. Waffle flat slab structures were the subject of a series of studies by Benavent-Climent [18] [19] in order to assess how structures designed according to old European standards perform in an earthquake situation. A prototype building was designed and specimens of interior and edge columns were scaled down from it. The specimens corresponding to interior column connections measured 1.74 m by 3.85 m, with the smaller side coinciding with the width of the solid square area in the column region. The webs width was 60 mm and 360 mm clear distance between ribs. The depth of the rib and the slab measured 180 mm and 36 mm, respectively.
Specimens representing edge connections share the same dimensions except for the span length in the loading direction that was 2.08 m long. The top flexural reinforcement consisted in one 12 mm bar in each outer web and grouped in pairs in the three middle webs. Along the webs, two legged stirrups with a diameter of 6 mm and spaced of 130 mm were used. The solid zone had additional reinforcement in both directions, passing through the column, by means of two beam like element of four 8 mm diameter bars at the corners of 6 mm diameter two legged closed stirrups, spaced of 45 mm. A mesh of 6 mm diameter bars spaced of 60 mm was placed on top of the flexural reinforcement all across the slab. The reported effective depth was 160 mm. The column was a squared section with 270 mm width (240 mm in the edge connection specimen) and 1450 mm long double hinged concrete element. The concrete cylinder compressive strength for both specimens was 19.4 MPa. To simulate the vertical load of the prototype building, weights were placed on top of the slab specimen, 40 kN and 20 kN, together with a prestress load applied to the column of a magnitude of 335 kN and 287 kN, for the interior and edge specimen, respectively. The vertical loading was followed by the imposition of increasing cyclic horizontal displacements at the top of the column. The displacements summed up as series of three cycles per step. In the first step, the drift increased in each cycle, however, in the following steps were equal within the same drift step.
![Figure 2.19: Punching control perimeter and shear reinforcement detail guidelines according to EC2 [54]](https://thumb-eu.123doks.com/thumbv2/123dok_br/15605361.1052766/75.892.168.769.116.390/figure-punching-control-perimeter-shear-reinforcement-guidelines-according.webp)