Joana Lisboa da Silva Gonçalves
Degree in Biochemisty
Molecular and Cellular Investigation of Malate:quinone
oxidoreductases from Staphylococcus aureus
Dissertation to obtain the Master degree in Biochemistry for Health
Supervisor: Dr Manuela M. Pereira
Jury:
President: Dr Pedro Matias Opponent: Dr Lígia O. Martins Members of the jury: Dr Margarida Archer
Instituto de Tecnologia Química e Biológica, António Xavier
III
Molecular and Cellular Investigation of Malate:quinone
oxidoreductases from Staphylococcus aureus
Copyright
O Instituto de Tecnologia Química e Biológica António Xavier e a Universidade Nova de Lisboa têm o direito, perpétuo e sem limites geográficos, de arquivar e publicar esta dissertação através de exemplares impressos reproduzidos em papel ou de forma digital, ou por qualquer outro meio conhecido ou que venha a ser inventado, e de a divulgar através de repositórios científicos e de admitir a sua cópia e distribuição com objetivos educacionais ou de investigação, não comerciais, desde que seja dado crédito ao autor e editor.
V
Agradecimentos
O condicionado espaço destinado a esta secção, não me permite agradecer como devia a todas as pessoas que, direta ou indiretamente, me ajudaram a caminhar e a concretizar esta etapa na minha vida. Assim, desde já deixo um profundo sentimento de agradecimento perante todos vós.
Primeiro que tudo à minha orientadora Dra. Manuela Pereira, a quem expresso o meu profundo agradecimento pela orientação e apoio incondicionais durante todo este caminho, que muito elevaram os meus conhecimentos, e que acima de tudo estimularam a minha vontade e o meu desejo de querer sempre mais, de lutar e de acreditar nas minhas capacidades. Obrigada pela responsabilidade e pela confiança que depositou em mim, desde o início. É para mim, um enorme privilégio ter tido a oportunidade de integrar o seu Grupo de Investigação, e com enorme gratidão que reconheço que tive a possibilidade de começar esta minha caminhada com um excelente acompanhamento, que não só me enriqueceu a nível profissional, como também a nível pessoal.
Esta experiência permitiu-me também conhecer pessoas fantásticas. Quero desde já agradecer a todo o Grupo de Investigação, Biological Energy Transduction, com quem tive a oportunidade de aprender e conviver durante este ano. Essencialmente à Patrícia Refojo e ao Filipe Sousa que sempre se prontificaram para me ajudar, em tudo o que precisasse. Obrigada Patrícia, pela motivação e por cada conselho que sempre me deste. Obrigada Filipe por todo o teu espírito crítico que tanto me ajudou, e esclareceu tantas vezes. Em especial, o meu agradecimento é dirigido à Filipa Sena, que foi uma pessoa fundamental no meu percurso. A Filipa foi um pilar imprescindível, foi acima de tudo uma amiga, uma irmã, que vou levar comigo desta experiência. A sua preocupação constante e o seu apoio incondicional em todos os passos deste projeto, foram essenciais. Obrigada por todas as vezes que exigiste o máximo de mim, pela oportunidade de aprender contigo e por todos os conhecimentos que partilhaste comigo. És um exemplo de persistência, de força e de dedicação, que são exatamente os valores pelos quais eu me rejo na minha vida. Um obrigado profundo por cada gargalhada, por todos os momentos partilhados, e principalmente, por ter tido a brilhante oportunidade de partilhar contigo um dos momentos mais bonitos da tua vida.
Quero também agradecer ao Professor Miguel Teixeira, como responsável da Metalloproteins and Bioenergetics Unit.
Ao ITQB, por me ter proporcionado todas as condições necessárias para a elaboração do meu projeto, e por permitir a minha integração num centro de investigação tão conceituado e de tão elevado prestígio. Um especial obrigada a todos os colaboradores, que de uma forma ou outra, contribuíram para a concretização deste projeto, desde as funcionárias da sala de lavagens, até ao admirável João Carita, que apesar de tanto trabalho, conseguiu sempre atender aos meus pedidos. À extraordinária Isabel Pacheco, que foi sempre incansável comigo e por quem eu tenho uma grande estima, um grande obrigado por todo o apoio e preocupação. À
VI
CERMAX, e ao Dr. Pedro Lamosa, pela disponibilidade e ajuda prestada no âmbito das experiências de RMN.Às minhas colegas de Mestrado, e amigas, que viveram comigo esta aventura e que diariamente realizaram esta caminhada comigo, em especial à Bárbara, à Diana e à Lucie, e claro, à minha melhor amiga, a Catarina, que já me acompanha há 5 anos neste percurso de vida académica, sempre a meu lado, ultrapassando todos os obstáculos juntas. Obrigada por aturares todos os meus dias menos bons, e obrigada por mais uma etapa concluída a teu lado, estou muito orgulhosa de nós. Aos meus grandes amigos Gigi e João Paredes, que mesmo à distância estiveram sempre presentes.
Não posso deixar de agradecer ao meu namorado, ao Francisco, por todo o apoio, por todas as palavras de confiança e por ter acreditado em mim em todos os momentos, sem nunca duvidar das minhas capacidades. Obrigada por teres estado comigo desde o início e por toda a paciência e compreensão, mesmo nos meus dias mais difíceis, obrigada por tudo.
E por último, mas claramente o mais importante, à minha família. Obrigada Mãe e Pai por tudo o que me proporcionaram até hoje, tudo. Não há palavras para agradecer todo o vosso esforço. Obrigada por terem feito de mim a pessoa que sou hoje, por me terem transmitido todos os valores e princípios pelos quais eu me guio diariamente. Obrigada por me terem ensinado a lutar, sem nunca desistir dos meus sonhos. Obrigada por acreditarem em mim todos os dias. Ao meu irmão, Tiago, que é, e sempre será, o meu maior orgulho. Obrigada pela vossa paciência nos meus momentos mais complicados.
A todos os que perdi durante o meu percurso académico, aos meus quatro Avós, que são o verdadeiro motivo da minha força, e que eu sei que me acompanham lá de cima. Espero que estejam orgulhosos, hoje é para vocês.
“A vida deve ser enfrentada como os cavalos, saltando e derrubando cada obstáculo.” Obrigada Avô
VII
Resumo
Staphylococcus aureus são agentes patogénicos oportunistas e representam uma das causas mais frequentes de infeções adquiridas na comunidade e nosocomiais. S. aureus tem desenvolvido vários mecanismos que conduziram à seleção de estirpes mais resistentes. Estas bactérias potencialmente letais constituem uma grande ameaça para a saúde pública, sendo que o desenvolvimento de novos fármacos para combater este problema mundial é prioritário. No entanto, diversos aspetos referentes a esta bactéria têm escapado à atenção, tais como o seu metabolismo energético e os seus enzimas respiratórios. Assim, visando alargar este conhecimento, as proteínas malato:quinona oxidoreductases foram exploradas a níveis moleculares e celulares.
As malato:quinona oxidoreductases são proteínas membranares, envolvidas no ciclo do ácido cítrico e na cadeia respiratória. Estas proteínas catalisam a oxidação de malato a oxaloacetato e a concomitante redução da quinona a quinol, fornecendo eletrões à cadeia respiratória. S. aureus possui dois genes anotados que codificam duas malato:quinona oxidoreductases, MQO I e MQO II, no entanto as diferenças entre ambas são desconhecidas. Uma caracterização bioquímica preliminar foi realizada bem como uma extensa investigação celular. Pela primeira vez, estas duas proteínas de S. aureus foram purificadas. A MQO I apresentou atividade malato:quinona oxidoreductase, contrariamente à MQO II que revelou atividade com lactato. O impacto da MQO I no metabolismo de S. aureus foi avaliado, através de crescimentos bacterianos com diferentes fontes de carbono, da estirpe selvagem e de um mutante. Os metabolitos extracelulares, recolhidos ao longo dos diversos crescimentos, foram analisados por espectroscopia RMN, que revelou a incapacidade da estirpe mqoI::Tn em catabolizar acetato. Esta abordagem possibilitou também pela primeira vez, uma profunda caracterização do comportamento de S. aureus sob diferentes fontes de carbono. Em suma, os nossos resultados sugerem que a MQO II, é uma lactato:quinona oxidoreductase, e revelaram a importância da MQO I neste patogénico, indicando-a como possível alvo terapêutico.
Palavras-chave: Metabolismo energético; enzimas respiratórios; malato:quinona oxidoreductases; cadeia respiratória; espectroscopia RMN.
IX
Abstract
Staphylococcus aureus are opportunistic pathogens and represent one of the most frequent causes for community acquired and nosocomial infections. Over time, S. aureus has developed several mechanisms which led to the selection of increasingly resistant strains. These potentially lethal bacterial pathogens have become a major public health threat, being urgent the development of new drugs against this worldwide problem. However, and intriguingly many fundamental aspects of S. aureus have escaped attention, such as its energy metabolism and respiratory enzymes. We aim to contribute to this knowledge by exploring malate:quinone oxidoreductases at molecular and cellular levels.
Malate:quinone oxidoreductases are membrane-bound proteins, involved in both the citric acid cycle and in the respiratory chain. These proteins catalyse the oxidation of malate to oxaloacetate and the reduction of quinone to quinol, providing electrons to the respiratory chain. S. aureus has two annotated genes encoding for two malate:quinone oxidoreductases, MQO I and MQO II, although the differences between these proteins are not known. Preliminary biochemical characterization and a thorough cellular investigation were performed in this work. For the first time, both proteins from S. aureus were purified. MQO I presented malate:quinone oxidoreductase activity, contrarily to MQO II which showed activity with lactate. The impact of the role of MQO I in S. aureus metabolism was evaluated by growths of a wild-type strain and of one mutant strain under different carbon sources. An NMR metabolomics approach was used to analyse the excreted metabolites along the growths, suggesting the inability of mqoI::Tn to catabolize acetate. This approach also provided, for the first time, a deep characterization of the wild-type strain, under different carbon sources. Our results suggest a misassignment of MQO II, being probably a lactate:quinone oxidoreductase and highlight the relevance of MQO I in this pathogen, making it an attractive candidate for targeted therapeutics.
Keywords: Energy metabolism; respiratory enzymes; malate:quinone oxidoreductases; respiratory chain; NMR metabolomics.
XI
Table of Contents
Resumo ... VII Abstract ... IX Table of contents of figures ... XIII List of abbreviations ... XXI
1. Introduction ... 1
1.1. Energetic Metabolism ... 1
1.1.1. Energy at the basis of Life ... 1
1.1.2. Metabolic pathways ... 1 1.1.3. Respiratory chains ... 4 1.1.4. Malate:quinone oxidoreductase ... 6 1.2. Staphylococcus aureus ... 7 1.2.1. General characteristics... 7 1.2.2. Virulence mechanism ... 8
1.2.3. Metabolic pathways of S. aureus ... 9
1.2.4. Respiratory chain of S. aureus ... 9
1.2.5. Malate:quinone oxidoreductases ... 10
2. Aims ... 13
3. Materials and Methods ... 15
3.1. Molecular Studies ... 15
3.1.1. Cloning and Protein Expression ... 15
3.1.2. Protein Purification ... 15
3.1.3. Biochemical and Biophysical Characterization ... 16
3.1.3.1. Protein purity assessment ... 16
3.1.3.2. Absorption spectroscopy ... 17
3.1.3.3. Protein quantification ... 17
3.1.3.4. Enzymatic studies ... 17
3.1.3.5. Protein stability analyses ... 18
3.2. Functional Characterization ... 18
3.2.1. Enzymatic activity pH profile ... 18
3.2.2. Mass Spectrometry analysis ... 18
3.3. Cellular Studies ... 18
3.3.1. Bacterial Strains ... 19
3.3.2. Confirmation of the Mutation mqoI::Tn ... 19
3.3.3. Cell Growth ... 19
3.3.4. NMR-based Metabolomics ... 20
3.3.4.1. Sample preparation ... 20
3.3.4.2. NMR data collection ... 20
XII
4. Results and Discussion ... 23
4.1. Malate:quinone oxidoreductase I ... 23
4.1.1. Protein expression and purification ... 23
4.1.1.1. First purification trial ... 23
4.1.1.2. Second purification trial ... 30
4.2. Malate:quinone oxidoreductase II ... 35
4.2.1. Protein expression and purification ... 35
4.2.2. Protein identification ... 38
4.2.3. Absorption spectroscopy ... 39
4.2.4. Enzymatic studies and substrate affinity ... 39
4.2.5. Enzymatic activity pH profile ... 40
4.2.6. Protein stability analysis ... 41
4.3. Staphylococcus aureus behaviour with Different Carbon Sources ... 42
4.4. Impact of MQO I in the Energetic Metabolism of Staphylococcus aureus ... 49
5. Conclusion ... 65
6. References ... 67
XIII
Table of contents of figures
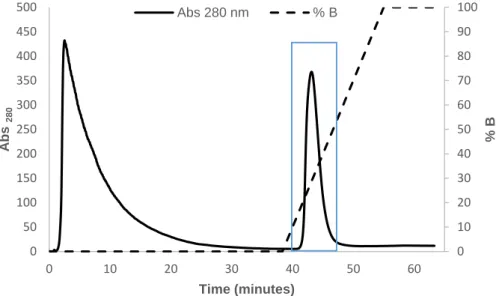
Figure 1. 1 - Schematic representation of catabolism of proteins, fatty acids and carbohydrates of cellular respiration adapted from Nelson MC. Lehninger Principles of Biochemistry. ... 3 Figure 1. 2 – Schematic representation of the citric acid cycle reactions, adapted from Nelson MC. Lehninger Principles of Biochemistry. ... 4 Figure 1. 3 – Schematic representation of proteins and electron carriers involved in respiratory chains, adapted from Marreiros et al, 2016. A - Transmembrane proteins with X:quinone oxidoreductase activity, B - Cytoplasmic facing monotopic proteins with X:quinone oxidoreductase activity. C - Periplasmic facing monotopic proteins with X:quinone oxidoreductase activity. D - Transmembrane proteins with quinol:soluble electron carrier oxidoreductase activity. E - Soluble electron carrier that is reduced by D and is oxidized by F. F - Transmembrane proteins with quinol:terminal electron acceptor or soluble electron carrier:terminal acceptor (Y) oxidoreductase activity. G - Transmembrane proteins with oxidoreductase activity with no interaction with quinones. (+ and – indicate the positive and negative sides of the transmembrane difference in electrochemical potential, respectively). ... 5 Figure 1. 4 – Schematic representation of malate:quinone oxidoreductase, a monotopic protein facing the periplasm, that catalyses the oxidation of malate into oxaloacetate and reducing the quinone to quinol. FAD is represented by the three rings. (+ and – indicate the positive and negative sides of the transmembrane difference in electrochemical potential, respectively). Adapted from Marreiros et al, 2016. ... 7 Figure 1. 5 - Brief schematic representation of quinone reductases present in S. aureus’ respiratory chain and metabolic pathways, adapted from Marreiros et al, 2016. In the grey box is represented the membrane, with the monotopic quinone reductases. 1 – NDH-2-A; 2 – PQO; 3 – MQO; 4 – DHODH; 5 – SQR; 6 – SDH; 7 – LQO; 8 – G3PDH; 9 – NDH-2-B; 10 – MPS. ... 10 Figure 4. 1 - SDS-PAGE of cells expressing MQO I. SDS-PAGE: Stacking Gel – 4 % acrylamide; Resolving Gel – 15 % acrylamide; Lane 1 – E. coli C43 cell extract before IPTG addition (OD600 = 0.6); Lane 2 – E. coli C43 cell extract after overnight (16 h) induction. Theoretical molecular mass of MQO I: ~ 57 kDa. Low molecular weight (LMW) protein marker was used (M). ... 23 Figure 4. 2 - Calibration curve (dotted line) was calculated by a linear regression equation. The absorbance was measured at 540 nm. The error bars are relative to triplicate assays. ... 24 Figure 4. 3 - A) UV-Visible absorption spectrum of the solubilized membrane fraction. B) Malate:quinone oxidoreductase activity of the solubilized membrane fraction, using 15 mM L-malic acid and 150 µM DMN. The wavelength was monitored at 270 nm, 30 ⁰C. C) Enzyme activity of the solubilized membrane fraction, using 15 mM L-malic acid and 100 µM DCPIP, as electron acceptor. This activity was monitored at 600 nm, 30 ⁰C. ... 25 Figure 4. 4 - Chromatogram obtained in the purification of MQO I from S. aureus, by a Q-Sepharose HP column 74 mL. Flux = 3 mL/min. In black filled line is represented the absorbance at 280 nm, in dashed line is represented the % of 1 M NaCl, 20 mM Tris-HCl buffer pH 7.8, 10 % glycerol (buffer B). The protein eluted approximately at 30 % of B (blue). ... 26 Figure 4. 5 - Chromatogram obtained in the purification of MQO I from S. aureus in a S200 column 300 mL, with 20 mM Tris-HCl buffer pH 7.8, 10 % glycerol, 150 mM NaCl. Flux = 0.5 mL/min. In black filled line is represented the absorbance at 280 nm. The protein eluted around 150 mL (blue). ... 27 Figure 4. 6 - Chromatogram obtained in the purification of MQO I from S. aureus, by Hi Trap IMAC HP column 5 mL charged with Zn2+. Flux = 3 mL/min. In black filled line is represented the
XIV
absorbance at 280 nm and in dashed line the % of 250 mM L-Histidines, 20 mM Tris-HCl buffer pH 7.8, 250 mM NaCl, 10 % glycerol (buffer B). The protein eluted approximately at 28 % of B (blue). ... 28 Figure 4. 7 - A) UV-Visible absorption spectrum of MQO I from S. aureus partially purified. The inset expands the absorption spectrum in the 250–550 nm region. B) The respective SDS-PAGE with MQO I expression (highlighted in red) – lane 1. SDS-PAGE: Stacking Gel – 4 % acrylamide; Resolving Gel – 15 % acrylamide; Theoretical molecular mass of MQO I: ~ 57 kDa. Precision plus protein dual colour standard was used as marker (M). ... 29 Figure 4. 8 - SDS-PAGE showing MQO I expression (highlighted in red). SDS-PAGE: Stacking Gel – 4 % acrylamide; Resolving Gel – 15 % acrylamide; Lane 1 – E. coli Rosetta cell extract before IPTG addition (OD600 = 0.6); Lane 2 – E. coli Rosetta cell extract after 4 h of induction. Theoretical molecular mass of MQO I: ~ 57 kDa. Precision plus protein dual colour standard was used as marker (M). ... 30 Figure 4. 9 - A) UV-Visible absorption spectrum of the membrane fraction washed with 100 mM K2HPO4/KH2PO4 pH 7.0, 2 M NaCl. The inset expands the absorption spectrum in the 250–550 nm region. B) Comparison of the absorption spectra of the membrane fractions solubilized with detergent (dashed line) and washed with 2 M NaCl (filled line). ... 31 Figure 4. 10 - A) Chromatogram obtained in the purification of MQO I from S. aureus, by a Q-Sepharose HP column 74 mL. Flux = 3 mL/min. In black filled line is represented the absorbance at 280 nm, in black dashed line is represented the % of 1 M NaCl, 100 mM K2HPO4/KH2PO4 pH 7.0 (buffer B). The protein eluted approximately at 35 % of B (blue). B) UV-Visible absorption spectrum of the selected fraction from the Q-Sepharose HP column (blue box in (A)) containing MQO I. The inset expands the absorption spectrum in the 270–570 nm region. ... 32 Figure 4. 11 - Chromatogram obtained in the purification of MQO I from S. aureus by a S200 column 300 mL, with 100 mM K2HPO4/KH2PO4 pH 7.0, 250 mM NaCl. Flux = 0.5 mL/min. In black filled line is represented the absorbance at 280 nm. The protein eluted around 125 mL (blue). 33 Figure 4. 12 - Chromatogram obtained in the purification of MQO I from S. aureus, by a Mono Q 5/50 GL column. Flux = 1 mL/min. In black filled line is represented the absorbance at 280 nm, in black dashed line is represented the % of 1 M NaCl, 100 mM K2HPO4/KH2PO4 pH 7.0 (buffer B). The protein eluted approximately at 35 % of B (blue). ... 33 Figure 4. 13 - A) UV-Visible absorption spectrum of MQO I from S. aureus purified. The inset expands the absorption spectrum in the 250–550 nm region. B) The respective SDS-PAGE with MQO I protein (highlighted in red) – lane 1. SDS-PAGE: Stacking Gel – 4 % acrylamide; Resolving Gel – 15 % acrylamide; Theoretical molecular mass of MQO I: ~ 57 kDa. Precision plus protein dual colour standard was used as marker (M). ... 34 Figure 4. 14 - Specific MQO I Activity. 1: Malate:quinone oxidoreductase activity; 2: MQO I activity in the presence of 0.15 mM HQNO. Enzymatic activities were performed under anaerobic conditions, in an anaerobic chamber with O2 levels below 1 ppm. Each assay was performed in triplicate at 30 ⁰C and following the quinone reduction (DMN) by absorption spectroscopy at 300 nm, using 15 mM Malate (L-malic acid) as electron donor and 0.15 mM DMN as electron acceptor, in 100 mM phosphate buffer pH 7.0, 250 mM NaCl. HQNO was used in a proportion 1:1 to the quinone. Total enzyme activity and specific activity were both calculated based on the Beer-Lambert law and according to a molar extinction coefficient of DMN of 15.2 mM-1 cm-164. ... 35 Figure 4. 15 - A) Chromatogram obtained in the purification of MQO II from S. aureus, by a Q-Sepharose HP column 74 mL. Flux = 3 mL/min. In black filled line is represented the absorbance at 280 nm, in dashed line is represented the % of 1 M NaCl, 20 mM Tris-HCl buffer pH 7.8, 10 % glycerol (buffer B). The protein eluted approximately at 30 % of B (blue). B) UV-Visible absorptionXV
spectrum of the selected fraction from the Q-Sepharose HP column (blue box in (A)) containing MQO II. The inset expands the absorption spectrum in the 270–570 nm region. ... 36 Figure 4. 16 - Chromatogram obtained in the purification of MQO II from S. aureus by a S200 column 300 mL, with 100 mM K2HPO4/KH2PO4 pH 7.0, 250 mM NaCl. Flux = 0.5 mL/min. In black filled line is represented the absorbance at 280 nm. The protein eluted around 260 minutes (130 mL) (blue). ... 37 Figure 4. 17 - A) UV-Visible absorption spectrum of MQO II from S. aureus purified. The inset expands the absorption spectrum in the 250–550 nm region. B) The respective SDS-PAGE with the MQO II protein (highlighted in red) – lane 1. SDS-PAGE: Stacking Gel – 4 % acrylamide; Resolving Gel – 15 % acrylamide. Theoretical molecular mass of MQO II: ~ 56 kDa. Low molecular weight (LMW) protein marker was used (M). ... 38 Figure 4. 18 - Absorption spectrum of MQO II from S. aureus oxidized (black filled line) and reduced (black dashed line) with sodium dithionite, in 100 mM phosphate buffer pH 7.0, 250 mM NaCl. Spectra were acquired under anaerobic conditions, on a spectrophotometer placed inside an anaerobe chamber with O2 levels below 1 ppm. The inset expands the absorption spectrum in the 250–650 nm region. ... 39 Figure 4. 19 - Specific MQO II activity. Enzymatic activities were performed under anaerobic conditions, in an anaerobic chamber with O2 levels below 1 ppm. Each assay was performed in triplicates at 30 ⁰C and following the DCPIP spectroscopically at 600 nm, using 15 mM Malate (L-malic acid) or 15 mM Lactate (L-lactate) as electron donors and 0.1 mM DCPIP as electron acceptor, in 100 mM phosphate buffer pH 7.0, 250 mM NaCl. Total enzyme activity and specific activity were both calculated based on the Beer-Lambert law and according to a molar extinction coefficient of DCPIP at 600 nm (ε600) equivalent to 20.7 mM-1cm-150. ... 40 Figure 4. 20 - pH-dependent enzyme activity of MQO II from S. aureus. Each point is representative of three experiments (respective error bars), using 0.1 mM DCPIP as electron acceptor and 15 mM L-lactate as electron donor, and with a protein concentration of 0.92 µM MQO II. Assays were measured in an anaerobe chamber with O2 levels below 1 ppm, at 30 ᵒC and 600 nm, with different pH buffer solutions 50 mM MES, 50 mM Bis Tris Propane, 250 mM NaCl buffer. Specific enzyme activity was calculated based on the Beer-Lambert law and according to a molar extinction coefficient of DCPIP at 600 nm (ε600) equivalent to 20.7 mM-1 cm -150. ... 40 Figure 4. 21 - Thermal denaturation curve of the purified MQO II from S. aureus. In black dots are represented: (A) the fluorescence emission intensity at 530 nm (excitation at 450 nm). In filled lines is represented the corresponding sigmoid fit; (B) the fluorescence emission intensity at 355 nm (excitation 280 nm), both in function of the temperature, between 25 and 90 ºC, to 2 µM MQO II. ... 41 Figure 4. 22 - Logarithmic representation of S. aureus JE2 growth in TSB medium (initial OD 0.15, in aerobic conditions). The absorbance at 600 nm and the pH values were measured at 1 h intervals. The results presented are representative of three independent experiments (respective error bars). Comparison of the growths of S. aureus wild-type (blue) and mqoI::Tn (yellow) strains by optical density (A) and pH (B)... 42 Figure 4. 23 – Logarithmic representation of S. aureus JE2 growth in CDM supplemented with 5 mM glucose (initial OD 0.05, in aerobic conditions). The absorbance at 600 nm and the pH values were measured at 1 h intervals. The results presented are representative of three independent experiments (respective error bars). Comparison of the growths of S. aureus wild-type (blue) and mqoI::Tn (yellow) strains by optical density (A) and pH (B). ... 43XVI
Figure 4. 24 – Logarithmic representation of S. aureus JE2 growth in CDM supplemented with 5 mM acetate (initial OD 0.05, in aerobic conditions). The absorbance at 600 nm and the pH values were measured at 1 h intervals. The results presented are representative of three independent experiments (respective error bars). Comparison of the growths of S. aureus wild-type (blue) and mqoI::Tn (yellow) strains by optical density (A) and pH (B). ... 46 Figure 4. 25 - Logarithmic representation of S. aureus JE2 growth in CDM supplemented with 5 mM lactate (initial OD 0.05, in aerobic conditions). The absorbance at 600 nm and the pH values were measured at 1 h intervals. The results presented are representative of three independent experiments (respective error bars). Comparison of the growths of S. aureus wild-type (blue) and mqoI::Tn (yellow) strains by optical density (A) and pH (B). ... 47 Figure 4. 26 – Logarithmic representation of S. aureus JE2 growth under different carbon sources (initial OD 0.05, in aerobic conditions). The results presented are representative of three independent experiments (respective error bars). Comparison of S. aureus wild-type growths in CDM supplemented with 5 mM glucose (red), 5 mM acetate (orange) or 5 mM lactate (green), by optical density (A) and pH (B). ... 47 Figure 4. 27 - Representative1H-NMR spectra of samples collected from a S. aureus growth, in TSB medium (A) and in CDM supplemented with 5 mM glucose (B). Standard metabolite peaks are evidenced, in the respective frequencies. Compound identification was performed with Chenomx Nmr Suite Version 8.12 software. ... 50 Figure 4. 28 - Example of raw data spectra showing the variation of glucose (panel (A)), acetate (panel (B)), alanine and lactate (panel (C)) at different times of the growth (top). Respective bar graph showing [glucose], [acetate], [alanine] and [lactate] for different growth points. Each bar is representative of triplicate assays (bottom). ... 51 Figure 4. 29 - Bar Graph representing the concentration of the metabolites along the growth of S. aureus wild-type in CDM supplemented with 5 mM glucose. ... 52 Figure 4. 30 – Metabolomic analyses of S. aureus JE2 wild-type (filled bars) and mqoI::Tn (dashed bars) growths under aerobic conditions, monitored by 1H-NMR. In the red box is represented MQO I. S. aureus strains grew aerobically in TSB medium, at 37 ⁰C. Samples were collected every 2 h of growth, centrifuged and the supernatant was stored. Extracellular metabolite concentrations were measured (milimoles). The results are representative of three independent experiments. The respective growth curves are shown in Figure 7.4 in Supplemental Material.53 Figure 4. 31 - Metabolomic analyses of S. aureus JE2 wild-type (filled bars) and mqoI::Tn (dashed bars) growths under aerobic conditions, monitored by 1H-NMR. In the red box is represented MQO I. S. aureus strains grew aerobically in CDM supplemented with 5 mM glucose, at 37 ⁰C. Samples were collected every 1.5 h of growth, centrifuged and the supernatant was stored. Extracellular metabolite concentrations were measured (milimoles). The results are representative of three independent experiments. The respective growth curves are shown in Figure 7.5 in Supplemental Material. ... 55 Figure 4. 32 – Metabolomic analyses of S. aureus JE2 wild-type (filled bars) and mqoI::Tn (dashed bars) growths under aerobic conditions, monitored by 1H-NMR. In the red box is represented MQO I. S. aureus strains grew aerobically in CDM supplemented with 5 mM acetate, at 37 ⁰C. Samples were collected every 1.5 h of growth, centrifuged and the supernatant was stored. Extracellular metabolite concentrations were measured (milimoles). The results are representative of three independent experiments. Please note missing bars relative to 6.5 h of S. aureus mqoI::Tn growth. The respective growth curves are shown in Figure 7.6 in Supplemental Material. ... 60XVII
Figure 4. 33 - Metabolomic analyses of S. aureus JE2 wild-type (filled bars) and mqoI::Tn (dashed bars) growths under aerobic conditions, monitored by 1H-NMR. In the red box is represented MQO I. S. aureus strains grew aerobically in CDM supplemented with 5 mM lactate, at 37 ⁰C. Samples were collected every 1.5 h of growth, centrifuged and the supernatant was stored. Extracellular metabolite concentrations were measured (milimoles). The results are representative of three independent experiments. The respective growth curves are shown in Figure 7.7 in Supplemental Material. ... 63 Figure 7. 1 - Flavin UV-Visible absorption spectrum. ... 71 Figure 7. 2 – Absorption spectra of cytochrome c in its oxidized (dashed line) and reduced (solid line) form. Adapted from Matsuno et al, 200949. ... 71 Figure 7. 3 - 1 % Agarose gel of the confirmation of mutation mqoI::Tn. Lane 1 - PCR product (1,106 bp). GeneRuler DNA Ladder Mix (Fermentas) was used (M). ... 73 Figure 7. 4 – Logarithmic representation of S. aureus JE2 growth (wild-type and mqoI::Tn strains) in TSB medium (initial OD 0.15, in aerobic conditions). The absorbance at 600 nm and the pH values were measured and samples were collected every 2 h of growth. The results presented are representative of three independent experiments (respective error bars). ... 74 Figure 7. 5 – Logarithmic representation of S. aureus JE2 growth (wild-type and mqoI::Tn strains) in CDM supplemented with 5 mM glucose (initial OD 0.05, in aerobic conditions). The absorbance at 600 nm and the pH values were measured and samples were collected every 1.5 h of growth. The results presented are representative of three independent experiments (respective error bars). ... 74 Figure 7. 6 – Logarithmic representation of S. aureus JE2 growth (wild-type and mqoI::Tn strains) in CDM supplemented with 5 mM acetate (initial OD 0.05, in aerobic conditions). The absorbance at 600 nm and the pH values were measured and samples were collected every 1.5 h of growth (excepting the first point of the growth). The results presented are representative of three independent experiments (respective error bars). ... 74 Figure 7. 7 – Logarithmic representation of S. aureus JE2 growth (wild-type and mqoI::Tn strains) in CDM supplemented with 5 mM lactate (initial OD 0.05, in aerobic conditions). The absorbance at 600 nm and the pH values were measured and samples were collected every 1.5 h of growth. The results presented are representative of three independent experiments (respective error bars). ... 74XIX
Index of tables
Table 4. 1 - Purification of MQO I from S. aureus. Enzymatic activities were measured at 30 ⁰C and 600 nm, following the change of absorbance of DCPIP by absorbance spectroscopy, using 15 mM Malate (L-malic acid) as electron donor and 0.1 mM DCPIP as electron acceptor. Total and specific enzymatic activities were calculated based on the Beer-Lambert law, following DCPIP at 600 nm using ε = 20.7 mM-1 cm-150. Kinetic assays were performed under anaerobic conditions, in an anaerobic chamber with O2 levels below 1 ppm. ... 29 Table 7. 1 - Composition of TSB medium (pH 7.3 ± 0.2) (Difco) used for Staphylococcus aureus growths. The medium was prepared in bi-distilled water (Millipore E-POD) sterile. ... 71 Table 7. 2 – Composition of CDM for Staphylococcus aureus growths. Salt solution, vitamin solution and trace elements solution were performed, the amino acids and bases were made separately to maximize the longevity of storage. All the solutions were stored at 4 ⁰C. Per each 100 mL of CDM medium prepared, were added 10 mL of the salt solution, 1 mL of each amino acid, 1 mL of each base, 0.1 mL of the vitamin solution and 0.1 mL of the trace elements solution. The medium was prepared in bi-distilled water (Millipore E-POD) sterile and the pH adjusted to 7.4 using sterile 10 M NaOH solution. ... 72 Table 7. 3 – Compounds analysed by 1H-NMR in the respective analysed peaks (approximated chemical shifts) and the number of protons responsible for each signal in the defined ppm. Assignment performed based on the Chenomx Nmr Suite software and on the Biological Magnetic Resonance Data Bank. ... 73
XXI
List of abbreviations
Δѱ – transmembrane difference in electrical potential ε - extinction coefficient
ATP - adenosine triphosphate ADP – adenosine diphosphate BCA – bicinchoninic acid assay BSA – bovine serum albumine CcpA – catabolite control protein A CCR – carbon catabolite repression CDM – chemically defined medium CpI – complex I
CpII – complex II CpIII – complex III CpIV – complex IV cyt c – cytochrome c
DDM - n-Dodecyl-β-D-maltoside
DHODH – dihydroorotate:quinone oxidoreductase DLD – dihydrolipoyl dehydrogenase
DMN - 2,3-dimethyl-1,4-naphthoquinone DCPIP - 2,6-dichloroindophenol
E. coli - Escherichia coli
EDTA - ethylenediaminetetraacetic acid ETC – electron transfer chain
FAD - flavin adenine dinucleotide FADH2 – reduced state of FAD
G3PDH – glycerol-3-phosphate:quinone oxidoreductase HQNO - 2-n-Heptyl-4-hydroxyquinoline N-oxide
IMAC - immobilized metal ion affinity chromatography IPTG - isopropyl-β-D-1-thiogalactopyranoside
LMW - low molecular weight Ldh – lactate dehydrogenase
LQO – lactate:quinone oxidoreductase
MDH – malate:NAD+ oxidoreductase; malate dehydrogenase MES - 2-(N-morpholino) ethanesulfonic acid
XXII
MS – mass spectrometryMSSA – methicillin-susceptible Staphylococcus aureus MQO – malate:quinone oxidoreductase(s)
MQO I – malate:quinone oxidoreductase I
mqoI::Tn – strain with a transposon in the gene coding for malate:quinone oxidoreductase I MQO II – malate:quinone oxidoreductase II
MPS – membrane potential-generating system MT - melting temperature
NAD+ - oxidized nicotinamide adenine dinucleotide NADH - nicotinamide adenine dinucleotide
NDH-2 – type II NADH:quinone oxidoreductase NMR – nuclear magnetic resonance
OD600 – optic density at 600 nm OR - oxidoreductase
PCR – polymerase chain reaction ppm - parts per million
PQO – pyruvate:quinone oxidoreductase PVL - Panton–Valentine leukocidin Q - quinone
QH2 - quinol
S. aureus - Staphylococcus aureus S200 - Superdex 200
SDH – succinate:quinone oxidoreductase
SDS-PAGE - sodium dodecyl sulphate – polyacrylamide gel electrophoresis SQR – sulphide:quinone oxidoreductase
TCA – tricarboxylic acid Tn – transposon
TSA – tryptic soy agar TSB – tryptic soy broth
TSP - 3-trimethylsilyl-[2,2,3,3-D4]-1-propionic acid UQ – ubiquinone
1
1. Introduction
1.1. Energetic Metabolism
1.1.1. Energy at the basis of Life
The study of Life Sciences requires the knowledge of Bioenergetics. Life is nothing less than a result of energy changes. Energy is the main requirement for survival, and the evidence is that all biochemical processes involve energy transfer.
Living cells exchange matter and energy with their surroundings, obtaining and conserving energy in order to survive, grow, reproduce and preserve their structures, maintaining the dynamic equilibrium.
Bioenergetics is an extensive scientific domain, which concerns the study of energy transformations in living systems.
In vertebrates, energy is obtained by oxidative phosphorylation in the mitochondria. The Chemiosmotic theory, postulated by Sir Peter Mitchel in 19611 (Nobel Prize for Chemistry, 1978), enabled the understanding of many biological energy transduction reactions and processes, such as the oxidative phosphorylation, in which the energy of electron flow is conserved by the translocation of protons across the membrane, leading to the establishment of a transmembrane electrochemical potential – the proton-motive force1,2,3.
The proton-motive force comprises two different components: the different chemical concentrations between both sides of the membrane, and the charge distribution (Δѱ) across the inner mitochondrial membrane. Thus, the inherent electrochemical potential is further used by ATP synthase for the synthesis of ATP2,4.
Science is the poetry of reality in which Energy plays the central role. As Albert Einstein once said: “Everything is energy and that’s all there is to it”.
1.1.2. Metabolic pathways
Energy is required for the maintenance of life, reproduction and for the synthesis of cell components. This energy is provided by carbohydrates, fatty acids, proteins and vitamins, among others. Metabolism is the sum of all the chemical transformations, taking place in a cell or organism, through successive enzymatic reactions via specific metabolic pathways. Cellular metabolism can be divided into catabolic and anabolic reactions. In the first one (catabolism) complex molecules with high energetic value, such as proteins, carbon hydrates and fatty acids, are degraded into structurally simpler molecules in a thermodynamically favourable process. In anabolic reactions the same molecules are combined and transformed, with energy consumption, in higher components2,5. Following the origin of cells, microbial life experienced a long period of metabolic diversification, exploiting the various resources available on Earth.
2
In the course of evolution, organisms have acquired a remarkable collection of regulatory mechanisms to maintain the homeostasis at the molecular, cellular and organism level. Cells and organisms do not live in a static environment; in fact, they exist in a dynamic equilibrium, meaning that for each metabolic reaction in a pathway, the substrate produced by the preceding reaction is then converted to product2,5,6. However, cells do not live in equilibrium with their surroundings, but tend to keep a steady state. Thus, when this is disrupted due to external factors, regulatory mechanisms are triggered in order to compensate this disruption. Metabolic pathways are regulated at several levels, from within the cell and from outside. This regulation occurs essentially at two levels: the control of enzyme synthesis and the variation of enzyme activity. The control of enzyme synthesis is due to the availability of substrate, while the second one is relative to the allosteric regulation, by metabolic intermediates or coenzymes that signal the cell’s internal metabolic state. These signals allow the allosteric inhibition of one or more enzymes involved in the respective metabolic pathway, when its consumption is not needed2,5,3.Glucose has a central role in the metabolism of animals, plants and many organisms. Besides being an excellent source of energy used to produce ATP, glucose is also an important precursor, able to supply an extensive array of metabolic intermediates for biosynthetic reactions. A molecule of glucose is converted into two molecules of pyruvate by a series of enzyme-catalysed reactions, in a metabolic process denominated as glycolysis. Glycolysis is the central pathway of glucose catabolism, presenting the largest flux of carbon in most cells. In this process, some of the free energy released from glucose degradation is conserved in the form of ATP and NADH2,5,6,7.
𝐺𝑙𝑢𝑐𝑜𝑠𝑒 + 2𝑁𝐴𝐷++ 2𝐴𝐷𝑃 + 2𝑃
𝑖→ 2 𝑝𝑦𝑟𝑢𝑣𝑎𝑡𝑒 + 2𝑁𝐴𝐷𝐻 + 2𝐻++ 2𝐴𝑇𝑃 + 2𝐻2𝑂
Equation 1 – Overall equation for glycolysis. For each molecule of glucose degraded to pyruvate, are
generated two molecules of ATP.
The conversion into pyruvate represents a fundamental step in the intermediary metabolism, because it corresponds to the branch point for synthetic and catabolic reactions2,7. Pyruvate produced from glycolysis can be further metabolized by different catabolic routes. It can be reduced to lactate, accepting electrons from NADH and thus regenerating NAD+, in a process named lactic acid fermentation. This process occurs under anaerobic conditions but it can be even observed under aerobiosis, depending on the microorganisms and cell types2,5. Ethanol and CO2 can also be generated from pyruvate under hypoxic or anaerobic conditions, via alcohol fermentation. Under aerobic conditions, pyruvate is oxidized to produce the acetyl group of acetyl-coenzyme A which is further oxidized to CO2 by the enzymes of the citric acid cycle, where the energy released is temporarily conserved in the electron carriers – nicotinamide adenine dinucleotide (NADH) or quinones. These are oxidized, and their respective electrons pass through a chain of electron-carrying molecules in the mitochondria (respiratory chain) to the final electron acceptor, oxygen (Figure 1.1).
3
The citric acid cycle (Figure 1.2) is a key metabolic pathway that takes place in the matrix of the mitochondria in eukaryotic organisms or in the cytosol of prokaryotes. Acetyl-CoA enters in this cyclic pathway through its condensation with oxaloacetate, by citrate synthase, producing citrate. This process represents the first of eight sequential reactions that characterize the citric acid cycle. For each molecule of Acetyl-CoA oxidized, the pathway produces three molecules of NADH, one molecule of quinol and one of ATP2,5,6. The citric acid cycle also provides precursors for many biosynthetic pathways, playing an important role in the metabolism. For example, α-Ketoglutarate and oxaloacetate are able to serve as precursors of aspartate and glutamate2,6.e
-Glucose Fatty acids Amino acids Pyruvate Acetyl-CoA Citric acid cycle CO2 CO2Electron Transfer Chain
[H+] in [H+]out CO2 𝐻2𝑂 2𝐻++1 2𝑂2
e
-e
-e
-e
-e
-e
-e
-Figure 1. 1 - Schematic representation of catabolism of proteins, fatty acids and carbohydrates of cellular respiration adapted from Nelson MC. Lehninger Principles of Biochemistry.
4
1.1.3. Respiratory chains
As the diversity of Life, respiratory chains also present a large diversification depending on the organism and on its respective metabolic needs. Thus, evolution has witnessed changes in the respiratory chains8.
The respiratory chain is composed of a number of protein complexes capable of transport electrons. In addition, some complexes also translocate protons across the membrane against the electrochemical gradient (Figure 1.3). These respiratory chain proteins differ according to the organism. In prokaryotic organisms the expression occurs in the cellular membrane, while in the eukaryotes the proteins are expressed in the inner mitochondrial membrane. In the first case, the proteins translocate protons from cytoplasm to periplasmic space, and in the second the protons are translocated from the mitochondrial matrix to the inter-membrane space8.
The best characterized Electron Transfer Chain (ETC) is the mammalian one. The respiratory chain of mammalian mitochondria is an assembly of several electron carriers that are mainly grouped into multi-polypeptide complexes. It is described as comprising four complexes (Complex I, II, III and IV) and the mobile electron carriers, ubiquinone and cytochrome c (cyt c), that guarantee the electron transfer between the complexes3,4.
NADH:ubiquinone oxidoreductase (Complex I, CpI) is one of the enzymes that provides electrons to the respiratory chain of mitochondria and several bacteria. This complex (EC:1.6.5.3) is also the largest one, with approximately 1 MDa and constituted by 44 subunits. CpI catalyses the transfer of two electrons between NADH and ubiquinone (UQ), which is reduced to ubiquinol Figure 1. 2 – Schematic representation of the citric acid cycle reactions, adapted from Nelson MC. Lehninger
5
(UQH2). The complex also functions as a proton pump, thus this redox transfer is coupled to the translocation of protons across the membrane, from the mitochondrial matrix to the intermembrane space, contributing in this way to the maintenance of the transmembrane electrochemical potential2,9,10.Complex II (CpII), also called succinate:quinone oxidoreductase (EC 1.3.5.1) catalyses the two-electron oxidation of succinate to fumarate, and subsequently the reduction of the ubiquinone to ubiquinol, similarly to Complex I. However, unlike CpI the catalytic reaction performed by CpII is not coupled to charge translocation4,11.
Electrons are further transferred from ubiquinol to cytochrome c, by Complex III (CpIII, ubiquinol:cytochrome c oxidoreductase), in a reaction coupled to the transport of protons from the matrix to the intermembrane space. Translocation of protons occurs through a Q-cycle mechanism, which accommodates the switch between the two-electron carrier, ubiquinone, and the one-electron carrier, cytochrome c. One electron is provided, per ubiquinol molecule oxidized, through an iron sulphur cluster, to reduce cytochrome c. The second electron is used to reduce ubiquinone. Thus, a complete Q-cycle requires the oxidation of two ubiquinol molecules, resulting in the translocation of four protons to the positive side of the membrane, contributing to the generation of the membrane potential: 2 protons per each reduced cytochrome. This dimeric transmembrane protein complex III (EC:1.10.2.2), also called cytochrome bc1 complex, presents
11 subunits per monomers and is composed of a cytochrome c1, a cytochrome b and a Rieske iron-sulfur subunit2,12. After accepting an electron from the CpIII, the reduced cytochrome c donates electrons to Complex IV (cytochrome c oxidase).
Complex IV (EC:1.9.3.1) performs the oxidation of four cytochrome c molecules, reducing oxygen and leading to the production of H2O. During the reduction of O2 to H2O, this large complex with 13 subunits pumps four protons across the membrane, to the intermembrane space3,13.
Figure 1. 3 – Schematic representation of proteins and electron carriers involved in respiratory chains, adapted from Marreiros et al, 2016. A - Transmembrane proteins with X:quinone oxidoreductase activity, B - Cytoplasmic facing monotopic proteins with X:quinone oxidoreductase activity. C - Periplasmic facing monotopic proteins with X:quinone oxidoreductase activity. D - Transmembrane proteins with quinol:soluble electron carrier oxidoreductase activity. E - Soluble electron carrier that is reduced by D and is oxidized by F. F - Transmembrane proteins with quinol:terminal electron acceptor or soluble electron carrier:terminal acceptor (Y) oxidoreductase activity. G - Transmembrane proteins with oxidoreductase activity with no interaction with quinones. (+ and – indicate the positive and negative sides of the transmembrane difference in electrochemical potential, respectively).
6
Prokaryotic organisms have the ability to survive under different conditions, due to the diversity of their energetic metabolism that allows the capability of living even in primitive environments. The respiratory chains of prokaryotes may include similar complexes to the mammalian ones but different in several points, for example in the respiratory proteins, presenting fewer polypeptide chains. However, prokaryotes are able to use oxygen, iron, sulphur, nitrogen compounds or even organic metabolites as final electron acceptors. Respiratory chains of prokaryotes show thus remarkable diversity, flexibility and robustness, containing several electron entry branch points and comprising enzymes with apparently the same functions, such as malate:quinone oxidoreductases (MQO), the focus of this thesis4,8.1.1.4. Malate:quinone oxidoreductase
Several bacteria possess membrane-bound dehydrogenases other than cytosolic dehydrogenases in their respiratory chains, such as the membrane-bound malate:quinone oxidoreductase (MQO) which has a fundamental role for bacterial growth. According to the literature, this protein is described in the three domains of life, Eukarya (5%), Bacteria (27%) and Archaea (9%)4.
Malate:quinone oxidoreductase (EC 1.1.5.4), like CpII, is part of both citric acid cycle and of the respiratory chain4. Malate:NAD+ oxidoredutase (EC 1.1.1.37), MDH catalyses the same reaction as MQO in the TCA cycle14.
MQO was first described by David Cohn in Micrococcus lysodeikticus, in 195815 and, since then, it has been described in several other prokaryotic organisms, namely in Bacillus sp. PS316, Helicobacter pylori 17, Corynebacterium glutamicum18,19 and E. coli14.
MQO is a membrane bound protein, encoded by the gene mqo, and contains a Flavin adenine dinucleotide (FAD) as prosthetic group (Figure 1.4). As MDH, this protein catalyses the oxidation of malate to oxaloacetate, but in contrast to MDH, it donates electrons from malate oxidation to quinones, reducing quinone to quinol, providing directly electrons to the Electron Transfer Chain3,4,16,17,14.
MQO has been overlooked, although it has been described as a monotopic enzyme localized at the surface of the lipid bilayer through electrostatic or hydrophobic interactions17. Presenting a FAD as a prosthetic group, the oxidized flavin accepts two electrons from the substrate (malate) yielding the reduced state, FADH2. The presence of FAD gives the characteristic yellow color to the protein, corresponding to a maximum absorption at 450 nm in the absorption UV Visible spectrum (Figure 7.1 in Supplemental Material) with an extinction coefficient (ε) of 11.3 mM-1 cm-120.
7
The absence of MQO in mammalian cells makes this protein a potential drug target for the production of pharmaceutical agents against some pathogenic microorganisms, in which MQO is the only malate oxidase present16. For that reason, it is also important to understand the mechanism of this protein, its interaction with the substrates and its impact on microorganisms’ metabolism.MQOs from Staphylococcus aureus (S. aureus) were the systems under study in this thesis.
1.2. Staphylococcus aureus
1.2.1. General characteristics
Staphylococcus aureus (S. aureus) strains are potentially lethal bacterial pathogens that have been considered a serious worldwide threat to public health due to its multiple drug resistance to the antibiotics, capable to cause several infections21,22,23. For this reason, S. aureus strains have been extensively studied.
This organism belongs to the Firmicutes phylum and is a facultative anaerobic Gram-positive bacterium. Staphylococci are nonsporulating cocci with a diameter of approximately 0.5-1.5 µm, that divide in multiple planes in order to produce irregular clumps of cells6.
S. aureus are opportunistic pathogens that can be frequently found in the human respiratory tract and in the skin, representing one of the most frequent causes for community acquired and nosocomial infections6,21. The most common features caused by this pathogen are skin infections, but it also frequently to causes pneumonia, sepsis episodes, endocarditis and osteomyelitis24.
In the US more than 50 % of all S. aureus isolates causing clinical diseases are Methicillin-Resistant Staphylococcus aureus (MRSA) strains. These strains present resistance to β-lactam Figure 1. 4 – Schematic representation of malate:quinone oxidoreductase, a monotopic protein facing the periplasm, that catalyses the oxidation of malate into oxaloacetate and reducing the quinone to quinol. FAD is represented by the three rings. (+ and – indicate the positive and negative sides of the transmembrane difference in electrochemical potential, respectively). Adapted from Marreiros et al, 2016.
8
antibiotics, including methicillin, a penicillin. Resistance to methicillin occurs through the acquisition of the mecA gene, located in the staphylococcal cassette chromosome mec (SCCmec)21. MRSA is one of the major hospital-associated pathogens (HA-MRSA). Initially, these strains affected people with chronic diseases and hospitalized patients, but nowadays healthy individuals began to be affected as well in all the community (CA-MRSA) around the world22. Thus, over time these strains quickly led to epidemic CA-MRSA infections with serious consequences and high mortality rates. Currently, the existence of more than 20 distinct genetic lineages of CA-MRSA is known, but the outbreaks associated with each one varies according to the different clones. USA 300 is one of the most epidemic strains and it has already been reported in 50 different countries21,24,22. In addition, there are other types of S. aureus strains causing lower levels of mortality comparing to the MRSA ones, the methicillin-susceptible Staphylococcus aureus (MSSA).Portugal represents the country in Europe with the highest rate of MRSA in nosocomial infections22. This high frequency of MRSA seems to result mainly from dissemination from the hospitals. Data from 2013 showed that the highest prevalence was found in the northern region (Oporto and Braga) followed by the Lisbon district22.
Due to the increased incidence of S. aureus’ drug resistance, the treatment for these opportunistic pathogen infections is urgent and has become a therapeutic challenge.
1.2.2. Virulence mechanism
The pathogenicity of S. aureus is mainly determined by the secretion of several virulence factors, such as enzymes, toxins, adhesions and immunomodulators that allow the pathogen to colonize and interact with the host cells, causing cell destruction21,25.
Almost all CA-MRSA strains carry Panton-Valentine leukocidin (PVL) genes, as well as MSSA strains, but with small expression levels. PVL is a cytotoxin that forms pores in the membranes of leukocytes, specifically in neutrophils, causing cell lysis leading to a leukocyte destruction and tissue necrosis26.
Another virulence factor in S. aureus is α-toxin. This cytotoxic agent lysis immune system cells, such as macrophages and lymphocytes, and is able to modify the platelet morphology, leading to thrombotic problems21.
These are the most studied S. aureus’ virulence factors. Nonetheless, the pathogen possesses several others which are responsible for its high pathogenicity21.
9
1.2.3. Metabolic pathways of S. aureus
The major metabolic pathways are almost identical in all living organisms, but there are a few groups of bacteria in which some systems are modified2,5,6.
S. aureus is a facultative anaerobic bacteria able to perform both aerobic and anaerobic respiration. Under aerobic conditions the pathogen uses oxygen as final electron acceptor, otherwise under anaerobic environments S. aureus can grow by fermentation or nitrate respiration27. This ability to adapt to different conditions allows the colonization of the pathogen, from the skin or nasal cavity to the internal host niches, where the availability of free oxygen diminishes27,28,29. S. aureus uses the pentose phosphate and glycolytic pathways to catabolize glucose. It also uses the citric acid cycle and the amino acids catabolism to obtain energy but it is not able to metabolize fatty acids, since according to the annotated genome sequence, S. aureus lacks the enzymes necessary for β-oxidation30,31.
S. aureus must rapidly adapt to a diversity of carbon sources during host invasion. The fast metabolic adaptation of this opportunistic pathogen provides it with greater pathogenicity when compared to other innocuous staphylococci in humans32. This versatile capability to adapt to different conditions is associated with its bioenergetic metabolism. Nevertheless, even though it is a prominent human pathogen, its respiratory enzymes have been escaping attention. S. aureus expresses several quinone reductases that feed electrons to the respiratory chain at different metabolic points, whether using O2 or nitrate as electron acceptors.
1.2.4. Respiratory chain of S. aureus
The knowledge of the S. aureus respiratory chain is very limited. S. aureus is able to perform both aerobic and anaerobic respiration27,28,29.
The genome of this pathogen does not reveal any gene cluster encoding Complex I (http://www.sanger.ac.uk/resources/downloads/bacteria/staphylococcus-aureus.html). This means that NADH oxidation has to be performed by an alternative respiratory enzyme. Type 2 NADH:quinone oxidoreductase (NDH-2) plays this role33. Also, instead of reducing NADH, electrons may be fed directly to the respiratory chain, via quinones.
Besides two NDH-2, S. aureus has more genes coding for quinone reductases present in its genome, such as Malate:quinone oxidoreductase (OR), MQO; Lactate:quinone OR, LQO; Pyruvate:quinone OR, PQO; Succinate:quinone OR, SDH; Glycerol-3-phosphate:quinone OR, G3PDH; Sulfide:quinone OR, SQR; Dihidroorotate:quinone OR, DHODH and the so-called MPS (membrane potential-generating system)4. These allow a direct link between different metabolic pathways and the respiratory chain. Figure 1.5 shows a schematic representation of S. aureus cell highlighting the central carbon metabolism and the quinone reductases present in S. aureus’ respiratory chain.
10
1.2.5. Malate:quinone oxidoreductases
Several bacteria possess membrane-bound dehydrogenases instead of cytosolic dehydrogenases in their respiratory chains, such as the membrane-bound malate:quinone oxidoreductases (MQOs).
The malate:quinone oxidoreductase (EC 1.1.5.4) from S. aureus is a respiratory enzyme that catalyses the transfer of two electrons from malate to menaquinone. This pathogen presents two genes encoding two different MQOs, mqoI and mqoII, which are referred as MQO I and MQO II, respectively 34. Despite not being yet understood the differences between the two copies, the first one is described as a malate:quinone oxidoreductase, originally annotated as a MQO I, with a molecular mass equivalent to 57 kDa. Preliminary studies indicate that this S. aureus’ enzyme has a flavin adenine dinucleotide (FAD) and lipid-dependent peripheral membrane protein34,35. However, further biochemical studies are needed.
The second copy of MQO from S. aureus was originally annotated as malate:quinone oxidoreductase II with approximately 56 kDa, although its function remains unknown. Recent studies revealed that MQO II has affinity to the substrate lactate, instead to malate, suggesting a new function to the second copy34.
Despite the differences, published studies also revealed that both copies have an important role in S. aureus’ respiratory chain and survival34,35,36. Another important fact is the Figure 1. 5 - Brief schematic representation of quinone reductases present in S. aureus’ respiratory chain and metabolic pathways, adapted from Marreiros et al, 2016. In the grey box is represented the membrane, with the monotopic quinone reductases. 1 – NDH-2-A; 2 – PQO; 3 – MQO; 4 – DHODH; 5 – SQR; 6 – SDH; 7 – LQO; 8 – G3PDH; 9 – NDH-2-B; 10 – MPS.
11
absence of the gene coding for the soluble MDH in this microorganism34, which is also capable of oxidizing malate into oxaloacetate; Thus, without this enzyme the oxidation of malate is only dependent on the activity of MQO. Therefore, the study of these proteins (MQO I and II) is promising and challenging since they are poorly biochemically characterized; For example no crystallographic structure is available. Also, since S. aureus presents two copies of MQO, it is important to know the cellular role of these enzymes.13
2. Aims
This project aimed to contribute to the knowledge of S. aureus’ energetic metabolism by exploring respiratory enzymes, namely malate:quinone oxidoreductases, at molecular and cellular levels. Specifically, our objectives were:
Expression, purification and biochemical characterization of the two malate:quinone oxidoreductases, MQO I and MQO II, from S. aureus;
Investigation of the function of both MQO I and MQO II;
Explore the impact of MQO I in the metabolism of S. aureus;
15
3. Materials and Methods
3.1. Molecular Studies
3.1.1. Cloning and Protein Expression
The genes SAI6T6_1017480 and SAI6T6_1019420 encoding S. aureus ST228/18341 (MRSA) MQO I and MQO II, respectively, were individually cloned into plasmid pET-28a(+) (GenScript). The gene product MQO I corresponds to a protein of 511 amino acid residues, while MQO II presents 498 residues, with theoretical molecular masses of approximately 57 kDa and 56 kDa, respectively. The plasmid DNA was extracted using the Wizard® Plus SV Minipreps DNA Purification System (Promega) and competent cells, Escherichia coli (E. coli) C43(DE3) cells (Lucigen) and E. coli Rosetta 2 (DE3) pLysS cells (Novagen), were prepared. Transformation was achieved using a heat shock protocol37. E. coli C43 and Rosetta 2 cells, were transformed with the vector mqoI-S. aureus and grown, respectively, in Luria Bernati (LB) medium supplemented with 50 µg mL-1 kanamycin (Roth), or in 2×YT-rich medium supplemented with 100 µg mL-1 kanamycin (Roth) and 34 µg mL-1 chloramphenicol (Roth), at 37 ⁰C and 180 rpm. Several expression conditions were tested, some of which prior to the beginning of the project. Most promising gene expressions were induced with 0.5 mM or 1 mM IPTG (isopropyl β-D-1-thiogalactopyranoside) (Apollo Scientific) when the cells reached an optic density at 600 nm (OD600) of 0.6. The cells were harvested 4 h after induction or after an overnight growth, by centrifugation at 8,000 rpm for 10 min, and stored at -20 ⁰C.
For MQO II, expression tests were performed in the host lab and optimized before the beginning of the project. E. coli C43 cells were transformed with the vector mqoII-S. aureus and grown in Terrific Broth (TB) medium supplemented with 50 µg mL-1 kanamycin (Roth), at 37 ⁰C and 180 rpm. Gene expression was induced with 0.1 mM IPTG (Apollo Scientific) when the cells reached an optic density at 600 nm (OD600) of 0.6. The temperature was changed to 18 ⁰C after the induction35. Cells were harvested after an overnight growth, by centrifugation at 8,000 rpm for 10 min, and stored at -20 ⁰C.
3.1.2. Protein Purification
Cells were resuspended in 20 mM Tris-HCl buffer pH 7.8, 10 % glycerol, 250 mM NaCl, or 100 mM K2HPO4/KH2PO4 pH 7.0, 250 mM NaCl, both containing one complete protease-inhibitor cocktail tablet (Roche). Cells were disrupted in a French press at 41.4 MPa and cellular debris and undisrupted cells were separated out by centrifugation at 10,000 rpm, 10 min. The membrane fraction was ultracentrifuged at 42,000 rpm, and different times were tested: for 2 h, 4 h and overnight. Several experiments were also performed in order to remove the protein from the membrane; these included tests with sodium chloride (NaCl) and with detergent DDM (n-Dodecyl β-maltoside) (Glycon), varying the concentrations of each. In some trials, the membrane pellet was resuspended using a Potter homogenizer in 100 mM K2HPO4/KH2PO4 buffer pH 7.0, 2
16
M NaCl, and incubated overnight at 4 ⁰C, under agitation. In another approach the membrane pellet was resuspended with a Potter homogenizer in 20 mM Tris-HCl buffer pH 7.8, 10 % glycerol, 500 mM NaCl, 0.1 % ethylenediaminetetraacetic acid (EDTA). DDM was gradually added (3 g of detergent per 1 g of protein) and incubated overnight at 4 ⁰C, under agitation. The membrane fraction was further ultracentrifuged at 42,000 rpm for 1 h or 3 h, depending on the different approaches. NaCl concentration in the supernatant containing the protein of interest was decreased to approximately 50 mM NaCl at 4 ⁰C by successive additions of the same buffers used in the steps before according to the different trials, but no NaCl. The sample was concentrated in an Amicon system (30 000 MWCO).The obtained washed membrane fraction was injected in an ion-exchange Q-Sepharose High Performance 74 mL column (GE Healthcare) and eluted with a concentration gradient from 0 to 1 M NaCl in 20 mM Tris-HCl buffer pH 7.8, 10 % glycerol, or in 100 mM K2HPO4/KH2PO4 buffer pH 7.0. The fraction containing the protein of interest was then injected into a size exclusion chromatography column, Gel-filtration Superdex 200 XK 26/60 300 mL column (GE Healthcare) and eluted with 20 mM Tris-HCl buffer pH 7.8, 10 % glycerol, 150 mM NaCl or with 100 mM K2HPO4/KH2PO4 pH 7.0, 250 mM NaCl. The buffers used contained one complete protease-inhibitor cocktail tablet (Roche). These two columns were chosen as initial steps of the purifications and were common to most of the different experiments, although there were cases where more than one injection was needed, depending on the trials. Fractions containing the protein of interest, selected by absorption spectroscopy and enzymatic assays, were further injected in different columns and different procedures were tested: His-Trap HP 5 mL column (GE Healthcare) was used, since it presents affinity for histidines, using as eluent a concentration gradient from 20 mM to 300 mM imidazole (Sigma Aldrich). An affinity chromatography Hi Trap IMAC HP 5 mL column (GE Healthcare) was also tested, charged with zinc (ZnCl2; MERCK) or with cobalt (CoCl2; MERCK), and eluted with a concentration gradient from 5 mM to 250 mM of L-Histidine (Roth). An anion exchanger Mono Q 5/50 GL column (GE Healthcare) was used in some purification trials, and the elution step was performed with a concentration gradient from 0 to 1 M NaCl in 100 mM K2HPO4/KH2PO4 buffer pH 7.0. Chromatography columns were operated by an AKTA Prime Plus system (GE Healthcare) and detection was monitored by the change in absorbance at 280 nm. All the protein fractions were stored at -20 ⁰C.
The described procedures were applied to both MQO I and MQO II.
3.1.3. Biochemical and Biophysical Characterization
3.1.3.1. Protein purity assessmentProtein purity of the different samples was analysed by sodium dodecyl sulphate – polyacrylamide gel electrophoresis (SDS-PAGE) using a Mini-PROTEAN® Electrophoresis System from BIORAD. Samples were diluted in 5 µL of loading buffer (Tris-HCl 50 mM, pH 8; SDS; Bromophenol Blue; Glycerol; β-mercaptoethanol and Urea) and were subsequently injected