Characterization of
Intrabodies
Targeting the hERG
Potassium Channel
Anastasiya Siarheevna Hryshkina
Dissertação de Mestrado apresentada à
Faculdade de Ciências da Universidade do Porto e Instituto de
Ciências Biomédicas Abel Salazar
Bioquímica
2019
C ha racter izati on of Intr ab od ies T arge ting the hE R G P otass ium C ha nn el A n as tas iy a S iar h ee v n a Hry shkina FCUP ICBAS 2019 2.º CICLOIntrabodies
Targeting the hERG
Potassium Channel
Anastasiya Siarheevna Hryshkina
Mestrado em Bioquímica
Departamento de Química e Bioquímica 2019
Orientador
Carol Ann Harley, Investigadora Júnior, IBMC - Instituto de Biologia Molecular e Celular/ i3S - Instituto de Investigação e Inovação em Saúde, Universidade do Porto
Coorientador
João H. Morais Cabral, Investigador Principal, IBMC - Instituto de Biologia Molecular e Celular/ i3S - Instituto de Investigação e Inovação em Saúde, Universidade do Porto
Coorientador
Maria do Rosário Almeida, Professor Associado, ICBAS- Instituto de Ciências Biomédicas Abel Salazar; IBMC Instituto de Biologia Molecular e Celular/ i3S -Instituto de Investigação e Inovação em Saúde, Universidade do Porto
Agradecimentos
Obrigada a minha orientadora, Doutora Carol Harley, por me acompanhar neste meu percurso, e estar sempre disponível para me ajudar e ensinar sem nunca perder a paciência.
Ao meu coorientador, Doutor João Morais Cabral por me ter dado a oportunidade de trabalhar na equipa e aprender com vocês.
A minha coorientadora Professora Doutora Maria do Rosário Almeida por se ter disponibilizado para me orientar.
Obrigada a todo o grupo Andreia, Celso, João Jorge, Omar, Tatiana e Rita por me acolherem e estarem sempre disponíveis para ajudar.
As minhas amigas, obrigada por estes cinco anos. Por partilharem as minhas angústias e desesperos, mas principalmente pelos bons momentos que passamos.
Mãe, obrigada pelo teu apoio incansável. Por acreditares e esperares sempre o melhor de mim e veres sempre as minhas pequenas conquistas como algo mais.
Resumo
O “ether-à-go-go related gene” em humanos (hERG) é um canal de potássio dependente de voltagem responsável por conduzir a corrente IKr (rapid delayed rectifier
current), sendo esse essencial para a repolarização cardíaca normal. A sua disfunção pode resultar no desenvolvimento da síndrome de longo QT, enquanto que, por outro lado, sobrexpressão está frequentemente associada à progressão neoplásica. O objetivo deste projeto é diminuir a expressão do canal hERG na membrana plasmática ao afetar o seu tráfego, utilizando para isso intracorpos. Isto tem potencial em reduzir o impacto de hERG em cancro. Para isso, fragmentos variáveis de cadeia única (scFv) scFv 2.10 e scFv 2.12, específicos contra o N-terminal do canal hERG foram usados como intracorpos e modificados com diferentes sequências de localização. A ação destas moléculas foi testada em uma linha celular estável HEK293 hERG1a, onde foi monitorizado o efeito no tráfego de hERG1a para a superfície celular, primeiro através do seu padrão de glicosilação por western blot e depois, com uma análise mais quantitativa da localização do canal a superfície, por citometria de fluxo. Mostramos que, embora todos os scFvs sejam expressos nas células HEK293, apenas scFv2.10 NLS mostrou potencial impacto na redução da forma glicosilada madura do canal hERG1a. No entanto, após ensaios de citometria de fluxo, concluímos que o scFv2.10 NLS não tem efeito significativo no tráfego do canal hERG1a para a membrana, por isso, não foi prosseguida a sua investigação.
Além disso outro anticorpo, scFv 1.10, gerado anteriormente através da técnica de exibição em fagos para reconhecer e ligar ao domínio N-terminal Per–Arnt–Sim (PAS) do canal hERG, não tinha ainda sido bioquimicamente caracterizado. Para isso expressamos scFv 1.10 em Escherichia coli, purificamos a proteína usando o marcador de afinidade histidina e realizamos ensaios pull-down e ELISA na tentativa de mapear seu epítopo de ligação no domínio PAS. Mostramos que, em primeiro lugar, o anticorpo scFv 1.10 tem uma afinidade de ligação intermediária para o domínio PAS que é menor que scFv 2.10, mas maior que scFv 2.12. Além disso, o modo de ligação é diferente, sendo que observamos uma ligação de saturação (Bmax) mais elevada na titulação do domínio PAS. De acordo com isso, mostramos que o scFv 1.10 se liga à região globular do domínio PAS em um epítopo de ligação diferente do determinado para o anticorpo scFv 2.12. Será necessário realizar mais estudos para mapear esse epítopo.
Palavras chave: hERG; PAS; scFv; intracorpos; via de tráfego; epítopo de ligação; afinidade
Abstract
Human ether-à-go-go related gene (hERG) is a voltage gated potassium channel responsible for conducting the rapidly activating delayed rectifier potassium current (IKr),
essential for normal cardiac repolarization. Impairment in its function is associated with the development of long QT syndrome while, on the other hand, its overexpression is often associated with neoplastic progression. The goal of this project is to decrease the expression of hERG channel on the membrane by affecting its trafficking using intrabodies. This has potential in reducing the impact of hERG in cancer. To accomplish our goal, single-chain variable fragment (scFv) antibodies scFv 2.10 and scFv 2.12, specific against the N-terminal of hERG channel, were used as intrabodies and modified with different localization sequences. The action of the scFv’s was tested in a HEK293 hERG1a stable cell line where we monitored the effect on hERG1a trafficking to the cell surface first by monitoring its glycosylation pattern by western blot then more quantitatively the surface location by flow cytometry. We show that although all intrabody proteins expressed in HEK293 cells only scFv2.10 NLS showed a potential impact in reducing the mature glycosylation of the hERG1a channel. However, after follow up experiments using flow cytometry we concluded that the scFv2.10 NLS intrabody had no significant effect on the trafficking of hERG1a channel to the membrane, therefore, this line of research will not be pursued.
Additionally, another distinct antibody, scFv 1.10, that had previously been generated using phage display to recognize and bind to the N-terminal Per–Arnt–Sim (PAS) domain of the hERG channel, had not been biochemically characterized. To accomplish this we expressed scFv 1.10 in Escherichia coli, purify the protein using the histidine affinity tag and perform pull-down and ELISA assays in an attempt to map it´s binding epitope on the PAS domain. We show that firstly scFv1.10 antibody has an intermediate binding affinity for the PAS domain which is less than scFv2.10 but a higher affinity than scFv2.12. Also the mode of binding is distinct as we see a higher saturation binding (Bmax) on titration to the PAS domain. Consistent with these findings we show that scFv1.10 binds to the globular region of the PAS domain at a different binding epitope determined for scFv2.12 antibody. Further studies will be required to map this epitope.
Table of Contents
Agradecimentos ... I Resumo ... II Abstract ...III Table of Contents ... IV List of Tables... VI List of Figures ... VII List of Abbreviations ... IX1. Introduction ... 1
1.1 Human Ether-à-go-go-Related Gene (hERG) ... 1
1.1.1 Function and Structure ... 1
1.1.2 Biogenesis and trafficking ... 3
1.1.3 hERG in disease ... 4
1.1.3.1 Long QT Syndrome Type-2 (LQT2) ... 4
1.1.3.2 Cancer ... 5
1.2 Single-chain variable fragments (scFv) ... 6
1.2.1 Intrabodies ... 8
2. Aims ...11
3. Materials and Methods ...12
3.1 Cell culture and transfections ... 12
3.2 Western Blot ... 12
3.3 Flow Cytometry ... 13
3.4 GST Pull Down Assay ... 14
3.5 ELISA (Enzyme-Linked Immunosorbent Assay) ... 14
3.6 scFv 1.10 SNAPHis6 protein purification ... 15
3.7 GST PASmutant protein purification ... 15
3.8 Molecular Biology ... 16
4. Results and Discussion ...20
4.1 Characterization of scFv 2.10 and 2.12 Intrabody expression on hERG1a trafficking in HEK293 cells. ... 20
4.1.1 scFv Intrabodies used for relocalization ... 20
4.1.2 Mammalian Cell expression ... 21
4.1.2.1 Fluorescent Imaging ... 21
4.1.2.3 Western Blot analysis of hERG1a ion channel ... 25
4.1.2.4 Flow Cytometry analysis... 26
4.2. In vitro characterization of a novel antibody, scFv 1.10 ... 32
4.2.1 ELISA ... 32
4.2.1.1 Protein Purification of scFv 1.10 SNAPHis6 ... 32
4.2.1.2 Titration of scFv 1.10; 2.10 and 2.12 SNAPHis6 Binding to PAS Domain ... 34
4.1.2.3 Determination of the Binding epitope of scFv 1.10 SNAPHis6 ... 36
4.2.2 GST Pull Down assay ... 37
4.2.2.1 Determination of the Binding epitope of scFv 1.10 SNAPHis6 ... 37
4.2.2.2 Testing of previously purified GST-PASmutants ... 38
4.2.2.3 Expression and Purification of GST PASmutants ... 40
4.2.3. Analysis of the binding epitope with the new GST-PAS mutants by ELISA and GST Pull Down assay ... 42
5. Conclusions ...44
6. Future Perspectives ...46
7. Appendix 1 ...47
List of Tables
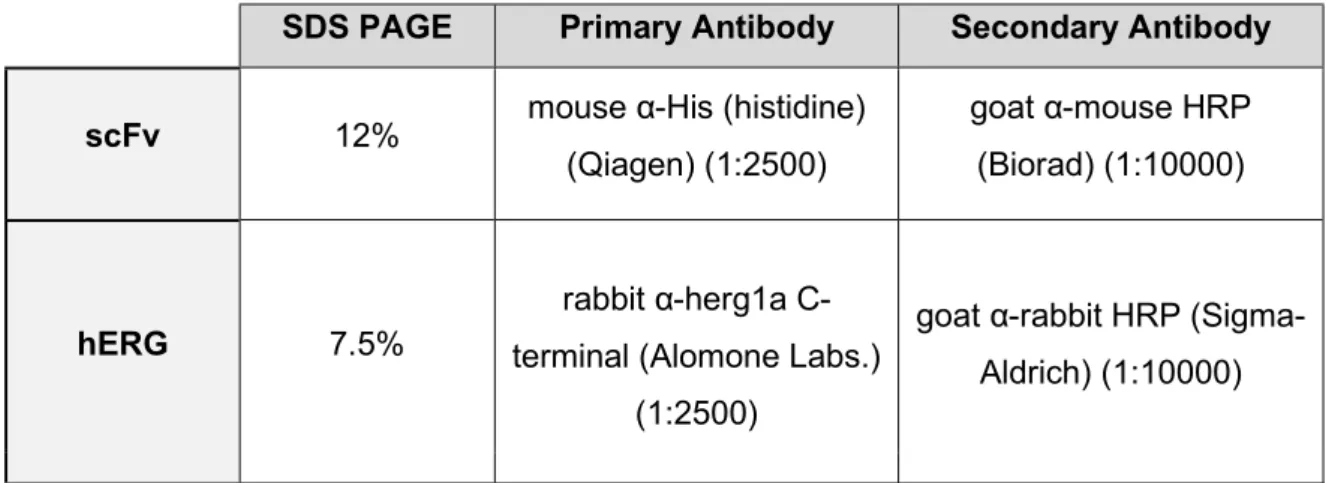
Table 1- Western Blot conditions used for detection of scFv and hERG. ...13
Table 2- Conditions of colony PCR performed with Dream TAQ DNA polymerase ..18
Table 3- Conditions of Site Directed Mutagenesis PCR performed with Pfu Turbo DNA polymerase ...18
Table 4- List of primers and vectors used to synthesize the correspondent
List of Figures
Figure 1- Representation of hERG1a subunit ... 2
Figure 2- hERG trafficking to the plasma membrane. ... 4
Figure 3- Representation of the composition of single chain variable fragment. ... 7
Figure 4- Representation of intrabodies modified with localization targets ...10
Figure 5- Schematic representation of scFv constructs and their cellular localizations.. ...21
Figure 6- ZOE microscope imaging of HEK293 hERG1a cells. ...23
Figure 7- Western blot analysis of intrabody expression. ...24
Figure 8- Western Blot analysis of hERG glycosylation pattern ...26
Figure 9- Titration of secondary antibody goat α-rabbit IgG F(ab’)2 APC. ...27
Figure 10- Titration of primary antibody rabbit α-hERG S1-S2 loop.. ...28
Figure 11- Illustrative representation of transfected cells subjected to different conditions for Flow Cytometry analysis ...29
Figure 12- Flow Cytometry analysis of hERG surface expression in HEK293 hERG1a stable cell line. ...31
Figure 13- SDS-PAGE gel of scFv 1.10 SNAPHis6 purification. ...33
Figure 14- Size-exclusion chromatography purification of 1.10 SNAPHis6. ...34
Figure 15- Comparative analysis of PAS affinity for scFv 1.10, scFv 2.10 and scFv 2.12. ...36
Figure 16- - ELISA evaluation of scFv 2.12 binding epitope vs scFv 1.10. ...37
Figure 17- GST Pull Down of scFv 1.10 with GST-PASmutants characteristic of 2.12 binding epitope. ...38
Figure 18- GST Pull Down of scFv 1.10 with different GST-PASmutants.. ...40
Figure 19- Alignment of PAS domain from hERG1a, hELK1 and hEAG1 channels. .41
Figure 20- SDS-PAGE gel of GST-PASmutants purification. ...42
List of Abbreviations
Amp100 – 100µg/ml Ampicillin
APC – Allophycocyanin
BSA – Bovine Serum Albumin
Ca2+ – Calcium
CDR – Complementarity-Determining Region
cNBD – Cyclic Nucleotide-Binding Domain
cv – Column Volumes
DMEM – Dulbecco’s Modified Eagle’s medium
DTT – Dithiothreitol
E.Coli – Escherichia coli
EAG – Ether à-go-go
EDTA – Ethylenediamine Tetraacetic Acid
eGFP– Enhanced Green Fluorescent Protein
ELISA – Enzyme-Linked Immunosorbent Assay
ER – Endoplasmic Reticulum
FBS – Fetal Bovine Serum
Fc – Fragment Crystallizable
GFP – Green Fluorescent Protein
GST – Glutathione S-Transferase
HEK 293 – Human embryonic kidney 293
hERG – Human Ether-à-go-go Related Gene
HRP – Horseradish Peroxidase-Conjugated
IPTG – Isopropyl β-D-1-thiogalactopyranoside
K+ – Potassium
LB – Luria Broth
LQTS – Long QT Syndrome
LQT2 – Long QT Syndrome Type 2
mODC – Mouse Ornithine Decarboxylase
NLS – Nuclear Localization Signal
OD – Optical Density
O/N – Overnight
OPD – o-Phenylenediamine Dihydrochloride
P – Pellet
PAS – Per–Arnt–Sim
PBS – Phosphate-Buffered Saline
PCR – Polymerase Chain Reaction
PEST – sequence rich in residues of proline (P), glutamic acid (E), serine (S), and threonine (T) PM – Plasma Membrane PMSF –Phenyl-Methylsulfonyl Fluoride PFA – Paraformaldehyde RT – Room Temperature S – Supernatant
scFv – Single Chain Variable Fragment
SDS-PAGE – Sodium Dodecyl Sulfate–Polyacrylamide Gel Electrophoresis
SEC – Size-Exclusion Chromatography
TBS – Tris-Buffered Saline
TM – Transmembrane
VEGF – Vascular Endothelial Growth Factor
VEGFR1 – Vascular Endothelial Growth Factor Receptor 1
VH – Heavy-Chain Variable Region
VL – Light-Chain Variable Region
1. Introduction
1.1 Human Ether-à-go-go-Related Gene (hERG)
The human ether-à-go-go related gene (hERG), also known as Kv11.1, is a voltage gated potassium (K+) channel that belongs to the ether à-go-go (EAG) family. Unique gating
kinetics of this channel allow it to conduct the rapidly activating delayed rectifier potassium current (IKr), essential for controlling cardiac excitability (1). In addition, hERG also has
impact on other tissues like regulation of the neuronal excitability in the nervous system, smooth muscle function and contribute to the pathogenesis of neoplastic cells (2, 3).
1.1.1 Function and Structure
The hERG channel is involved in the repolarization of the cardiac action potential (1). After initiation of the action potential in cardiomyocytes, normal functioning of the heart requires a prolonged depolarization, the plateau phase, during which calcium (Ca2+ ) enters
the cell and is stored in the sarcoplasmic reticulum for further use in contraction (4). Recovery of the resting potential is mainly accomplished by hERG channels. Those stay inactive during the plateau phase, conducting little outward current. Impact of hERG channels is felt with recovery from inactivation followed by a slow deactivation, generating a large inward K+ current that repolarizes the cell (5, 6).
The hERG channel is a tetramer with each subunit containing six transmembrane (TM) domains and two cytoplasmic regions (Figure 1). The first four transmembrane domains (S1-S4) on each subunit form the voltage sensor which regulate opening and closing of the pore, formed by the fifth and sixth domains (S5-S6) (7, 8).
Figure 1- Representation of hERG1a subunit. hERG protein is formed by 6 TM domains, with S1-S4 forming the voltage sensor (green) and S5-S6 the pore (yellow). The channel is inserted at the plasma membrane and the intracellular region contains an N-terminal with the PAS domain (pink) and a C-terminus holding a cNBD domain (blue).
The intracellular N-terminal and C-terminal domains include a conserved coiled-coil domain designated TCC and cyclic nucleotide-binding domain (cNBD) at the C terminus (8, 9). The cNBD is homologous to cyclic nucleotide binding domains however, the residues necessary for nucleotide binding are not conserved and addition of nucleotide has little impact on hERG gating (unlike in cyclic nucleotide-gated channels). Therefore, the functional role of this structural domain is uncertain (6).
The N terminus contains a Per–Arnt–Sim (PAS) domain, highly conserved in the EAG channel family. The PAS domain can be divided in two regions: the first 25 amino acid residues form the PAS-Cap domain while residues 26 to 135 form the PAS globular domain (6, 10). While PAS is implicated in protein–protein interactions that mediate environmental sensing in prokaryotes and regulation of transcription in eukaryotes, in hERG its role is less clear (9, 11).
Several studies suggest that the PAS domain may have an important role in channel deactivation kinetics since mutations or deletions of regions in the PAS domains result in acceleration of deactivation of hERG (12, 13). Evidence show that the PAS-Cap is the main regulator of channel gating, stabilizing the open conformation by interaction with the S4-S5 linker region (10, 14). The cNBD domain was also shown to be necessary for the deactivation process of the gate since its deletion lead to similar accelerated deactivation (15). Structural studies demonstrated that the cNBD domain and the globular PAS region interact (16).
1.1.2 Biogenesis and trafficking
Expression of different isoforms of hERG, hERG1a and hERG1b, has been detected in the heart, neurons and smooth muscle. hERG1a and hERG1b differ only in the N-terminal region; hERG1b lacks the PAS domain and has a unique N-terminal sequence of 35 residues (17). Both hERG1a and hERG1b can form functional homotetrameric channels however, while hERG1a is expressed at the plasma membrane (PM), hERG1b homotetramers are retained in the endoplasmic reticulum (ER) due to the existence of the ER retention RXR (Arginine – X – Arginine, with X being any amino acid) sequence at the N-terminus. Therefore, many studies involve only the hERG1a isoform, usually designated only as hERG (18).
Co-assembly of the two isoforms occurs in vivo and results in masking of the RXR retention site of hERG1b via co-translational interaction of the N-terminus and enables the export of the channel to the PM (19, 20). Heterotetramers hERG 1a/1b have increased rates of activation, recovery from inactivation, and deactivation in comparison with channels of hERG 1a homotetramers, exhibiting the proprieties required for producing the IKr current
(21).
hERG protein is synthetized in the ER where it undergoes asparagine (N)-linked glycosylation, designated core glycosylation (Figure 2). The immature channel of 135 kDa is then exported to the Golgi apparatus where a second glycosylation of the channel occurs, giving rise to the mature-glycosylated form with a higher molecular mass, 155 kDa (7). Only then the channel can be transported to the PM where it has a half-life of ~11h, after which hERG is internalized by endocytosis and can be recycled back to the PM or suffer degradation (22).
Two N-linked glycosylation consensus sites – N598 and N629 - are located on the extracellular S5-S6 linker of hERG protein (23). It was shown that, while N598 site is required for the N-glycosylation of the channel, N629 is not. Instead the residue has a role in hERG trafficking to the membrane, as mutation of the N629 site results in trafficking impairment. Mutations of the channel that impairs the glycosylation still result in functional channel, however with decreased stability (24).
Figure 2- hERG trafficking to the plasma membrane. hERG protein is synthetized and assembled as a tetramer in the ER, were it also undergoes the first glycosylation- core glycosylation- conferring a molecular weight of 135 kDa. The channel is transported to the Golgi complex completing maturation to a 155 kDa oligomer with a second glycosylation- mature glycosylation. In the mature form hERG is transported and inserted into the PM.
1.1.3 hERG in disease
hERG is associated with several pathologic processes such as cancer, epilepsy, skeletal muscle atrophy and Long QT Syndrome (LQTS). However, the role of the channel in disease is mostly focused on the cardiologic problems that derive from LQTS since, apart from rare association with epilepsy, it is the most characterized disease caused by mutations in the hERG gene (25).
1.1.3.1 Long QT Syndrome Type-2 (LQT2)
LQTS is a disorder characterized by delayed ventricular repolarization that may result in arrhythmias, fainting and sudden death (26). Usually it is caused by congenital mutations in ion channels or its modulators and, in some cases, in may be acquired as side effect of drugs (25). The Long QT Syndrome Type 2 (LQT2) accounts for approximately 45% of all LQTS, resulting from genetic mutations in hERG channel with consequent
reduction in IKr amplitude (27, 28). Several mutations associated with the disease have been
reported in different hERG regions thus resulting in different mechanistic defects: reduced or defective synthesis; defective trafficking; defective gating; defective ion permeability (29). While part of LQT2 mutations are non-sense, resulting in defective synthesis of the gene that undergoes mRNA decay, most of the mutations are missense (30). hERG traffic impairment is the most common outcome of missense mutations. Channels that are misfolded, incompletely folded or unassembled are unable to leave the ER due to quality control system, being retained at the immature core-glycosylated form before being degraded (11, 31). Only the properly folded hERG can leave the ER which results in low density of the channel at the PM. Quality control system plays a significant role in LQT2 pathogenesis since some of misfolded channels sent for degradation may be partially functional (18).
While hERG traffic to the PM is not affected by truncation of the N-terminus, several mutations in this region result in impaired trafficking. Other mutations localized in the PAS domain seem to result in interference with interaction with other domains, leading to abnormal gating kinetics (18). Mutations affecting hERG trafficking, particularly involving the PAS region, may be rescued by different pharmacological strategies (32).
1.1.3.2 Cancer
hERG channels are often expressed in numerous cancer types of epithelial, neuronal, leukemic, and connective tissue, while being absent in the correspondent healthy tissues (33). Different processes involving cancer progression are shown to be regulated by hERG, including cell differentiation, invasion, proliferation, angiogenesis and apoptosis (34). Expression of the hERG1a isoform is predominant in the majority of tumours, while the hERG1b expression is more limited to leukemias (34).
Cycling non-excitable cells, as well as neoplastic cells, have a depolarized membrane potential. Activation of hERG channel is maximum at higher potential, therefore its overexpression sets the tumour membrane potential at more depolarized values which facilitate cell cycle progression and contribute to the high proliferation rate of the cell (35). At depolarized membrane potentials the cell enters the G1 phase of the cell cycle and when the potential is hyperpolarized the cell progresses to the S phase due to Ca2+ influx that
triggers synthesis of mitogenic factors, as well as influx of ions and metabolic substrates required for DNA synthesis (33). Accounting for the variations in hERG current, expression
of the hERG isoforms oscillates during the cell cycle, with hERG1b predominating in the S phase and hERG1a in the G1 phase (36, 37).
Additionally, it has been proposed that hERG is involved in intracellular signalling cascades through formation of a macromolecular complex, especially with integrin-β1 (38). This interaction appears to result in hERG activation which in turn modulates adhesion signalling pathways downstream from the integrin receptor, promoting contact with the extracellular matrix, important for cell proliferation as well as migration and invasion (36). Furthermore, other signalling pathways are activated as a result of that interaction, triggering the expression of growth factors and chemokine receptors (39). The complex may associate with other receptors, like Vascular endothelial growth factor receptor 1 (VEGFR1) that, besides promoting migration of neoplastic cells, recruits the vascular endothelial growth factor (VEGF) stimulating angiogenesis (40). Integrin-β1 can only form a complex with the hERG1a isoform, not the hERG1b, suggesting that the PAS domain may be necessary for the interaction (40).
Treatment for cancer involving drugs against hERG must consider possible secondary effects due its role in cardiac repolarization, otherwise it may lead to acquired LQT2 (41). A potential way of reducing hERG’s impact in cancer is to reduce channel levels at the PM, by affecting trafficking.
1.2 Single-chain variable fragments (scFv)
The use of antibodies as therapeutic molecules is now well established as they have shown high potential for application in diagnosis and therapy presenting crucial features like high specificity and high affinity for the target. However, many problems also arise from their use, such as high immunogenicity and antibody instability (42). This has led to the development of more effective variants called recombinant antibodies, one of which is a single chain variable fragment (scFv) (43).
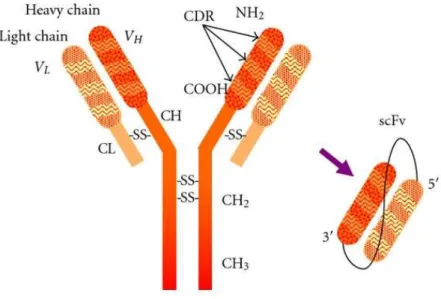
The scFv molecule contains the heavy-chain variable region (VH) and the light-chain
variable region (VL) of an immunoglobulin (Figure 3). The chains are connected by a short
hydrophilic polypeptide that serves as a flexible linker (44, 45). Each chain retains the three hypervariable complementarity-determining regions (CDRs) responsible for antigen recognition and, when adopting the correct tertiary structure, the antigen binding site is retained (46).
Figure 3- Representation of the composition of single chain variable fragment. The scFv is formed by the variable
regions of VL and VH chains of an antibody joined together by a small linker. Adapted from Ahmad et al, 2012
For obtaining specific scFv´s against a particular target, phage display technology is usually employed. After animal immunization with the antigen, immunoglobulin genes of variable region chains are amplified from B lymphocytes before arrangement into scFv gene repertoires (47). Those repertoires are displayed on surface of phage coat protein and screened for target binding with multiple rounds of affinity selection followed by amplification of the selected phage (43, 45). Selected scFv molecules that are reactive to the antigen are then expressed rapidly and in large quantities in Escherichia coli (E.Coli) (45).
The scFv molecule presents several advantages in medical applications, relative to the full-length antibody. Due to its small size (~25 kDa) it is quickly bio-distributed and has increased ability to penetrate tissues (45, 48). The absence of the fragment crystallizable (Fc) region of the antibody decreases immunogenicity and non-specific binding, which allows a rapid elimination from non-target tissues (45, 49). In addition, scFv retains the complete antigen binding site and high specificity characteristic of an antibody (50). However, due to its small size and fast dissociation from the antigen scFv´s are rapidly eliminated from the circulation, having a half-life of less than 10 min, therefore only little amount reaches the target (51). Low functional affinity of scFv may be partially overcome by construction of multivalent scFv fragments that increase the binding avidity, a characteristic that is especially advantageous for tumour targeting (43, 52). Also, scFv molecules are easily genetically engineered to improve specific scFv characteristics for a specific application, including increasing stability, avidity and they can be fused to a variety of reagents for tailoring their application (43).
scFv’s can be used as therapeutic agents but also for medical diagnosis, with particularly important application in cancer (50). Radiolabelling of specific scFv molecules has allowed the tracking of their rapid penetration into the neoplastic tissues detected with in vivo imaging and radioimmunotherapy (53). Alternatively, scFv´s may be fused to a variety of molecules like toxins or drugs that, once injected into the system, will deliver the therapeutic agents to cancer cells in order to destroy them (43). In fact, delivery of toxic agents by scFv molecules have shown that they have the necessary characteristics for quickly reaching the target as well as for rapid elimination from the system to minimize toxicity (54).
1.2.1 Intrabodies
A specific application of a scFv molecule is as an intracellular antibody, also designated intrabody. The intrabody is expressed within the cell where its target protein is located and can be engineered to contain localization signals that forward it to specific intracellular compartments in order to interact with the antigen (55). Intrabodies can operate to create a phenotypic knockdown of the target protein, which involves inhibiting the protein or rerouting it to other cellular compartments. Phenotype recovery is also possible using these molecules which, when interacting with the target protein, stabilize folding and allow function recovery (56, 57).
Intrabodies have very valuable properties for therapeutic application as they show high specificity for the target protein and are also specific for the intracellular site of action. This feature allows the function of the protein to be affected only in one cellular compartment while remaining functional in the others (55, 58). In addition, intracellular expression of an intrabody in a cellular machinery dependant manner makes it safer for therapeutic use, with reduced risk of toxic effect (56).
Application of intrabodies has been tested in laboratories for several pathologies. Study of intrabody application has mainly been carried out in the areas of viral infection, neoplastic progression and neurodegenerative diseases (56). In fact, neurodegenerative disorders, which are mostly characterized by accumulation of intracellular protein aggregates, provide great support for intrabody application (59). One particular example of an intrabody use was performed by Lecerf et al (48) where expression of anti-huntingtin intrabodies with the abnormal huntingtin protein resulted in a significant decrease of the number of aggregates, characteristic of the Huntington disease.
In order to interact with the antigen, the intrabody has to be in the same subcellular localization. Depending on the attached peptide signal sequence the intrabody is directed to cellular compartments such as the nucleus, ER, Golgi Complex, mitochondria, and PM. Expression of the intrabody without any signal sequence leads to its retention in the cytoplasm (60).
Expression of intrabodies in the cytoplasm, as well as in the nucleus, carries complications. Intrabody domains are stabilized by interchain disulphide bonds that, in contact with the reducing environment present in those compartments, can lead to an incorrect folding and a reduced stability of intrabodies (60). To overcome this problem different strategies can be applied, including selection of scFv sequence without disulphide bonds, as well as addition of fusion proteins, like green fluorescent protein (GFP), to increase the solubility (55). On the other hand, intrabodies retained in the secretory compartments should have an optimal folding due to native non-reducing conditions (61).
The intrabodies may be modified with intracellular localization targets not only for reaching the compartment where the target protein is localized but also to redirect the protein from their normal location, such as seen for membrane proteins (Figure 4) (55).
Targeting of the intrabody to the ER is a way of retaining an antigen protein that passes through the secretory pathway. ER intrabodies are created by addition of an ER retention signal that can be a KDEL (lysine - aspartic acid - glutamic acid - leucine) or KKXX (lysine - lysine – X – X, with X being any amino acid) sequence. KDEL sequence is an ER lumen retention signal for soluble proteins, while KKXX is a sequence for ER transmembrane protein retention (62). Both signals allow the retrograde trafficking of the intrabody from the Golgi back to the ER avoiding their secretion (Figure 4) (55). After rerouting the protein to the ER the complexes may undergo degradation (55).
Targeting the intrabody to other intracellular compartments also allows the redirection of the antigen protein from the PM. Some of the used localization sequences are Nuclear Localization Signal (NLS) for nuclear retention (Figure 4), normally composed by a cluster of basic amino acids PKKKRKV (proline (P), lysine (K), arginine (R) and valine (V)) derivative from simian virus 40 large T antigen (SV40 T) NLS (63). Another common sequence is PEST (sequence rich in residues of proline (P), glutamic acid (E), serine (S), and threonine (T)) used for targeting to proteasomal degradation (Figure 4) (64).
Figure 4- Representation of intrabodies modified with localization targets. Modification of intrabodies with intracellular localization targets for redirection of the protein from their normal location. PEST targets form proteasome degradation, NLS targets for nucleus redirection and KKXX rescues transmembrane ER resident protein from the Golgi complex back to ER.
2. Aims
Previously, two scFv antibodies consisting of the variable light and heavy domains that recognize and bind the cytosolic PAS domain of the hERG1a channel were isolated in the host laboratory (65). Downregulation of this membrane protein has been linked to LQT2 syndrome, a cardiac disease, whereas upregulation has been linked to cellular proliferation and cancer. It has been demonstrated that two of these scFv antibodies (scFv2.10 and scFv2.12) modulate the activity of the membrane protein (65).
Our first aim is to ask whether we can stably express these previously characterized scFv antibodies in HEK293 cells as intrabodies. If so, can we modify the scFv proteins with different tag sequences to localize them to various cellular locations and in doing so, re-direct hERG1a channel away from the cell surface in these cells?
The second aim of this project is to biochemically characterize a new scFv (scFv1.10) which was previously generated in the laboratory against the PAS domain. Our aim is twofold, firstly to map the scFv 1.10 epitope on the PAS domain relative to the epitopes of scFv 2.12 and scFv 2.10. Secondly, determine the relative binding strength of scFv1.10 relative to scFv2.12 and scFv2.10.
3. Materials and Methods
3.1 Cell culture and transfections
Human embryonic kidney (HEK)-293 cells line and HEK293 cells stably expressing hERG1a were cultured in high-glucose Dulbecco’s modified Eagle’s medium (DMEM) (Gibco) supplemented with 10% fetal bovine serum (FBS) and 1x Penicillin–Streptomycin (Gibco). HEK293 hERG1a cells were maintained in 200 µg/ml G418 (Sigma-Aldrich).
Cells were transiently transfected with 1 μg DNA at 60–80% confluency using Effectene Transfection Reagent (QIAGEN). The cells were monitored using the ZOETM Fluorescent Cell Imager (Biorad). After 48 h cells were analysed by Flow Cytometry
or lysed for analysis by Western Blot.
3.2 Western Blot
Cells were rinsed with ice cold Phosphate-Buffered Saline (PBS) and scraped into ice cold Solubilization buffer (150mM NaCl, 25mM Tris HCl pH7.5, 1.0% NP40 (Sigma-Aldrich)) and a protease inhibitor cocktail (1mM phenyl-methylsulfonyl fluoride (PMSF), 1µg/ml pepstatin A, 1µg/ml of leupeptin). Cells were lyzed by syringe 10 times through 27½G needle then incubated for 30 min at 4°C on a rotator. Cell debris was removed by centrifugation at 14,000 rpm for 15 min, and the total protein concentration was measured using the PierceTM BCA Protein Assay Kit (Thermo Scientific).
For Western blot, the lysates were heated at 65°C or boiled for 8 min in Sample Buffer (sample buffer (62,5 mM Tris HCl pH 6.8; 2% SDS; 25% glycerol; 0,01% bromophenol blue) + 0,7 M β-mercaptoethanol + 200 mM Dithiothreitol (DTT)) and electrophoresed on sodium dodecyl sulfate–polyacrylamide gel electrophoresis (SDS-PAGE). The proteins were then transferred onto nitrocellulose membrane using a trans-blot semi-dry system (Bio-Rad). After transfer, the membranes were blocked with 5% non-fat dry milk/ 0.2% Tween 20/ Tris-Buffered Saline (TBS) for 1h at room temperature (RT) or overnight (O/N) at 4°C. The membranes were then incubated with primary antibody (Table 1) in 5% non-fat dry milk/ TBS O/N at 4°C or for 2h at RT, following by wash with TBS/ 0.2% Tween 20 and 1h incubation with horseradish peroxidase-conjugated (HRP) secondary antibody in 5% non-fat dry milk/ TBS (Table 1). After washing with TBS/ 0.2% Tween 20,
bound antibodies were detected using ECLTM Prime Western Blotting Detection Reagents
(AmershamTM GE Healthcare) on the ChemiDoc (Biorad).
Table 1- Western Blot conditions used for detection of scFv and hERG.
SDS PAGE Primary Antibody Secondary Antibody
scFv 12% mouse α-His (histidine) (Qiagen) (1:2500)
goat α-mouse HRP (Biorad) (1:10000)
hERG 7.5%
rabbit α-herg1a C-terminal (Alomone Labs.)
(1:2500)
goat α-rabbit HRP (Sigma-Aldrich) (1:10000)
3.3 Flow Cytometry
Confluent 60 mm dishes of HEK293 or HEK293 hERG1a transfected and control cells were washed with Stain buffer (2% bovine serum albumin (BSA) /0,05% sodium azide in 1x PBS) and lifted with Stain Buffer containing 0,5M Ethylenediamine tetra acetic acid (EDTA). Cells were centrifuged twice for 5 min at 1500 rpm, resuspended in Stain Buffer and placed in 100 µl fractions into Protein LoBind Tubes (Eppendorf).
For extracellular staining, cells were incubated for 1h at 4°C on the rotator with primary antibody rabbit α-herg1a S1-S2 loop (Alomone Labs.) diluted (1:25) in Stain buffer. For total staining, cells were fixed in either 2% Paraformaldehyde (PFA) or Fixation buffer from Foxp3 / Transcription Factor Staining Buffer Set (eBioscience) for 10-20 minutes at RT, washed 3x in Stain buffer at 200-1000 rpm for 5 min and permeabilized for 15 min at 4°C with Permeabilization buffer from Transcription Factor Staining Buffer Set (eBioscience). Cells were then incubated with primary antibody rabbit α-hERG S1-S2 loop diluted (1:25) in Permeabilization Buffer. Cells from both conditions were washed 3x in Stain buffer at 1000-2000 rpm and incubated for 1h at 4°C on the rotator in the dark with secondary antibody goat α-rabbit IgG F(ab’)2 APC (allophycocyanin) (Santa Cruz) diluted
(1:1000) in either Solubilization buffer or Permeabilization buffer. After 3 washes for 5 min at 2000-2500 rpm the cell pellets were resuspended in 500μl Solubilization buffer and
transferred to Flow Cytometry tubes through a filter. Data was acquired in the Accuri (BD Biosciences) and analysed with FlowJo software. Cells were kept at 4°C during all of the procedure.
3.4 GST Pull Down Assay
Purified Glutathione S-transferase (GST), GST-PASWT (Wild Type) or GST-PASmutant
fusion proteins were incubated for 1 h at RT on a rotator with Glutathione High Capacity Magnetic Agarose beads (Sigma-Aldrich) pre-washed with TBS buffer (50 mM Tris·HCl pH 8.0, 150 mM NaCl). Unbound protein was removed from the beads by washing 5x with TBS buffer. The beads were then incubated with previously purified scFv1.10His6 antibody (1:15)
in TBS buffer for 1h at RT on a rotator, following by 5x wash with TBS buffer before being eluted by addition of Sample buffer. The binding of scFv was evaluated by Western Blot as previously described for scFv α-His antibody detection, and Ponceau S (0,1% Ponceau S, 1%(v/v) glacial acidic acid) staining was performed to assure equal GST/ GST-PAS protein loading.
3.5 ELISA (Enzyme-Linked Immunosorbent Assay)
A Nunc Maxisorp 96-well plate (Thermo Scientific) was coated with scFv SNAPHis6
fusion protein (12 or 20 μg/ml) in Coating Buffer (50 mM Tris HCl pH 7.4, 150 mM NaCl, 1 mM Tris ((2-carboxyethyl) phosphine (TCEP)) overnight at 4 °C. The plate was washed 3x with TBS pH 8.0, before blocking for 1 h at 37 °C with blocking buffer (5% non-fat milk/TBS). GST, GST-PASWT or GST-PASmutant fusion proteins diluted in blocking buffer were added to
the wells, in duplicate or triplicate, and incubated for 2 h at RT. Excess protein was removed by 5x washes with TBS and bound protein was detected by adding secondary antibody rabbit α- GST.HRP (Genscript) (1:2500) in Blocking Solution for 1h at RT. After washing 5x with TBS, peroxidase activity was quantified using Sigmafast OPD (o-phenylenediamine dihydrochloride) (Sigma-Aldrich) detection system, which was stopped using 3 M HCl. The Optical Density (OD) of the plate was read at 490 nm on the Synergy Mx reader.
3.6 scFv 1.10 SNAP
His6protein purification
Recombinant protein were expressed in BL21(DE3) E. Coli strain. The bacterial pellets were lysed in Lysis Buffer (50 mM Tris. HCl pH 7.5, 150 mM NaCl, 10 mM Imidazole pH 8.0, 1 mM DTT, protease inhibitors: 100 µM PMSF, 1 µg/ml pepstatin A, 1 µg/ml of leupeptin) and homogenized with a Dounce homogenizer followed by 4-6x passage through the Cell Cracker. The homogenate was centrifuged at 17 000 rpm for 45 min using the BECKMAN JA 25.50 rotor at 4°C. The obtained supernatant was incubated with pre-equilibrated HIS-Selected@ Nickel Affinity Gel (Sigma-Aldrich) for 1h on the rocker at 4°C before being added to a column. After unbound material was removed by gravity flow the beads were washed with 10 column volumes (cv) of Lysis Buffer then Buffer W2 (50mM Tris. HCl pH 7.5, 150 mM NaCl, 20 mM Imidazole pH 8.0, 1 mM DTT) before eluting the protein in 50 mM Tris. HCl pH 7.5, 150 mM NaCl, 150 mM Imidazole pH 8.0, 1 mM DTT. Dialyse of the protein in a 10 KDa membrane against Dialysis Buffer (50 mM Tris. HCl pH 7.5, 150 mM NaCl, 1 mM DTT) was performed O/N at 4°C to reduce Imidazole concentration.
The scFv 1.10 SNAPHis6 protein was concentrated by centrifugation at 2 000 xg in a
10 kDa MWCO (PALL) concentrator, a 5 kDa MWCO Vivaspin 6 (GE Healthcare) and a 5 kDa MWCO Vivaspin 2 (GE Healthcare) before purification by Size-Exclusion Chromatography (SEC) on a Superdex 200 10/300 GL column (GE Healthcare) in Equilibration Buffer (50mM Tris. HCl pH 7.5, 150 mM NaCl, 1mM DTT). Coomassie stained SDS-PAGE assessed fractions containing scFv 1.10 SNAPHis6 were pooled.
The protein concentration was estimated by the formula Abs280nm= ԑ x l x [protein]
using the molar extinction coefficient predicted by protparam tool (ԑ= 72100 M-1 cm-1) and
absorbance read at 280 nm.
3.7 GST PAS
mutantprotein purification
GST-PASmutants H70Y, P72A, R73A and Q75A were transformed into BL21(DE3) E.
coli strain and plated on Luria broth (LB) Amp100 (100µg/ml Ampicillin) O/N at 37°C. All
plated colonies were resuspended, inoculated in 1L of LB and grown at 37°C with 160 rpm agitation until reaching OD600 ~ 0,6-0,8. Protein expression was induced with 1 mM
Isopropyl β-D-1-thiogalactopyranoside (IPTG) and induced cultures incubated O/N at 18°C. The cultures were pelleted at 3000 g for 20 min at 4°C.
The bacterial pellets were lysed in Lysis Buffer (50 mM Tris. HCl pH 7.5, 150 mM NaCl, 0,1% Triton X, 5 mM DTT, protease inhibitors: 100 µM PMSF, 1 µg/ml pepstatin A, 1 µg/ml of leupeptin) and homogenized with a Dounce homogenizer followed by 4-5x passage through the Cell Cracker. The homogenate was centrifuged at 17 000 rpm for 45 min using BECKMAN JA 25.50 rotor at 4°C. The obtained supernatant was incubated with pre-equilibrated Glutathione Sepharose 4 Fast Flow beads (GE Healthcare) for 1h on the rocker at 4°C before being added to a column. After unbound material was removed by gravity flow the beads were washed with 10 cv of Wash Buffer (50mM Tris. HCl pH 7.5, 150 mM NaCl, 2,4 mM octyl-β-D-glucopyranoside, 5 mM DTT) before eluting the protein in 100 mM Tris. HCl pH 7.5, 150 mM NaCl, 20 mM Glutathione (reduced). Dialyse of the protein in a 10KDa membrane against Dialysis Buffer (50 mM Tris. HCl pH 7.5, 150 mM NaCl, 10 mM DTT) was performed O/N at 4°C to reduce the octyl-β-D-glucopyranoside in the sample.
The GST-PASmutants were concentrated by centrifugation at 2 000 xg in a 10 kDa
MWCO (PALL) concentrator. Each protein concentration was estimated by the formula Abs280nm= ԑ x l x [protein] using the molar extinction coefficient predicted by protparam tool
(ԑ= 47330M-1 cm-1) and absorbance read at 280 nm.
3.8 Molecular Biology
All molecular biology manipulations are outlined in Appendix 1. The pcDNA scFv 2.10/2.12 His6 cMyc eGFP PEST (containing the mouse ornithine decarboxylase (mODC)
PEST sequence) (cloned by Jessica Phan) and pcDNA scFv 2.10/2.12 His6 cMyc eGFP
(enhanced GFP) plasmids were transformed into DH5α E.coli competent cells as follows: 1.5µl DNA and cells were incubated on ice for 30 min, heat shocked at 42°C for 50 sec and recovered in LB media for 1h at 37°C at 225 rpm. Cells were plated on LB Amp100 O/N at
37°C. Single colonies were cultured in LB Amp100 media O/N at 37°C with 225 rpm agitation
and DNA was extracted with Miniprep Kit (NZYTech), quantified using the NanoDropTM2000
(ThermoFisher). The sequences were verified by DNA sequencing.
To synthetize pcDNA scFv 2.10/2.12 His6 cMyc eGFP SV40 NLS, pcDNA scFv
2.10/2.12 His cMyc eGFP plasmids were digested with restriction enzyme NotI (Thermo Scientific) O/N at 37°C following by purification in QIAquick Polymerase Chain Reaction (PCR) Purification kit (QIAGEN) and digestion with BsrGI (Thermo Scientific) for 1h30 at 37°C. The digested vectors were purified using the Gelpure kit (NZYTech). Primers containing the NLS sequence (Table 4) and overhanging NotI and BsrGI restriction sites were separately phosphorylated with PNKinase (Fermentas) for 45min at 37°C then boiled
at 100°C. The oligo´s were mixed together and the PNKinase activity was killed and secondary structure destroyed by heating to 100oC for 10mins. The oligo´s were annealed
together by allowing the mixture to cool to RT on the bench. The phosphorylated oligo´s were added to the digested vector and T4 DNA Ligase (Thermo Scientific) and incubated O/N at 4°C. Ligations were transformed into DH5α or NEB5α competent E.coli cells and plated on LB Amp100 plates overnight at 37 °C. Individual colonies were inoculated into 5 ml
LB Amp100 and grown O/N and analysed by colony PCR as follows: 100µl of each culture
was spun at 14000 rpm for 1 min and resuspended in bacterial lysis buffer (20mM Tris HCl pH 7.6, 2mM EDTA pH 8.0, 1% Triton X100). Lysates were boiled for 10 min and centrifuged at 14000rpm for 10min. Colony PCR was performed according to the conditions described in Table 2, using Dream TAQ polymerase (Thermo Scientific) with the following primers: AgeI_Fwd_GFP– 5’-CGGTACCGGTCATGGTGAGCAAGGGCGAGG-3’ and NLSrev scFV – 5’-GGCCGCTTACTAGGGGTCTTCTACCTTTCTCTTCTTTTTTGGACCAGATCCCTT-3’. The amplified sample was run on a 0,8% agarose gel to identify positive clones. DNA was extracted with Miniprep Kit (NZYTech), quantified using the NanoDropTM2000
(ThernoFisher) and the sequences verified by Sanger sequencing.
A three step cloning strategy was employed to produce pcDNA STE2 scFv 2.10 His6
cMyc eGFP KKTN. STEP1: pEGFP-N1 PAS His6 cMyc eGFP plasmid was digested with
NotI and BglII (Thermo Scientific) restriction enzymes, while pcDNA STE2 herg1a was digested with NotI and BamHI (Thermo Scientific). Between the digestions the DNA was purified by QIAquick PCR Purification kit. Digested DNA were run on 0,8% agarose gel to select the correct fragments and purified using the Gelpure kit. Fragments from both plasmids were mixed O/N with T4 DNA Ligase at 4°C and transformed into NEB5α cells, colony PCR was performed using Dream TAQ DNA polymerase and primers: BamHI_Rev_STE2aa79 – 5’-CGGGGTACCAATGTCTGATGCGGCTCC-3’ and NotI_Rev_GFP_Swap – 5’-GGATAGTTTAGCGGCCGCTTTACTTGTACAGCTCGTCC-3’, according to the conditions in Table 3. The amplified sample was run on a 0,8% agarose gel to identify positive clones (pcDNA STE2 PAS His6 cMyc eGFP ). Positive colonies were
grown O/N at 37oC in LB Amp100 media. DNA was extracted with Miniprep Kit (NZYTech),
quantified using the NanoDropTM2000 (ThernoFisher) and the sequences verified by Sanger
sequencing.
STEP2: The KKTN sequence was inserted at the end of eGFP using Quick-Change Site directed mutagenesis protocol following the conditions in Table 3, using Pfu Turbo polymerase (Agilent) and primers described in Table 4. The parental DNA was digested with DpnI (Thermo Scientific) at 37°C for 3h and the plasmids transformed into NEB5α cells and grown on LB Amp100 plates O/N at 37 °C and single colonies growth in LB Amp100media.
DNA was extracted with Miniprep Kit (NZYTech), quantified using the NanoDropTM2000
(ThernoFisher) and the sequences verified by Sanger sequencing.
STEP3: Plasmids pcDNA STE2 PAS His6 cMyc eGFP KKTN and pComb3 scFv 2.10 were,
separately, digested with SfiI (Fermentas) at 50°C for 3h and run on a 0,8% agarose gel to separate the correct fragments to purify using the Gelpure kit. The fragments were ligated with T4 DNA Ligase O/N at 4°C and transformed into NEB5α cells and grown on LB Amp100
plates O/N at 37 °C. Colonies were grown O/N in LB Amp100 media and DNA purified by
Miniprep Kit before analysis by digestion with Sfil at 50°C for 2h and run on 0,8% agarose gel, with the positive samples sequenced by Sanger sequencing.
All the described plasmids will be referred as scFv 2.10 or scFv 2.12 followed by the localization tag (NLS, PEST, KKTN or WT when no tag is added).
The GST-PAS point mutations H70Y, P72A, R73A and Q75A mutations were created by Quick-Change Site directed mutagenesis protocol (conditions in Table 3), using pGEX PASWT as a template and the correspondent primers described in Table 4. After
digestion of the parental DNA with DpnI, the plasmids were transformed into XL1 Blue cells and plated on Amp100 plates. DNA was purified by Miniprep kit and sequenced.
Table 2- Conditions of colony PCR performed with Dream TAQ DNA polymerase
Cycles Temperature Time
1 95 °C 4 min 95 °C 50 sec Colony PCR 25x 55 °C 50 sec 72 °C 1 min 1 72 °C 10 min 1 12 °C ∞
Table 3- Conditions of Site Directed Mutagenesis PCR performed with Pfu Turbo DNA polymerase
Cycles Temperature Time
1 95 °C 4 min
95 °C 1 min Site Directed 18x 55 °C 1 min
Mutagenesis 68 °C 18 min
1 68 °C 10 min
Table 4- List of primers and vectors used to synthesize the correspondent constructs.
Vector Construct Primer
pcDNA 3.0 pcDNA scFv2.10/ 2.12 His6 cMyc eGFP NLS Forward: 5’-GTACAAGGGATCTGGTCCAAAAAAGAAGAGAAAGGTAGAA GACCCCTAGTAAGC-3’ Reverse: 5’-GGCCGCTTACTAGGGGTCTTCTACCTTTCTCTTCTTTTTTGG ACCAGATCCCTT-3’ pcDNA scFv2.10 His6 cMyc eGFP KKTN Forward: 5’-GGACGAGCTGTACAAGAAGACCAACTAAAGCGGCCGCTCG AGC-3’ Reverse: 5’-GCTCGAGCGGCCGCTTTAGTTGGTCTTCTTGTACAGCTCGT CC-3’ H70Y Forward: 5’-CCTGCGACTTCCTGTACGGGCCGCGCACGC-3’ Reverse: 5’-GCGTGCGCGGCCCGTACAGGAAGTCGCAGG-3’ P72A Forward: 5’-CGACTTCCTGCACGGGGCGCGCACGCAGCGC-3’ Reverse: 5’-GCGCTGCGTGCGCGCCCCGTGCAGGAAGTCG-3’ pGEX PASWT R73A Forward: 5’-CCTGCACGGGCCGGCCACGCAGCGCCGCGC-3’ Reverse: 5’-GCGCGGCGCTGCGTGGCCGGCCCGTGCAGG-3’ Q75A Forward: 5’-GCACGGGCCGCGCACGGCGCGCCGCGCTGCCGC-3’ Reverse: 5’-GCGGCAGCGCGGCGCGCCGTGCGCGGCCCGTGC-3’
4. Results and Discussion
4.1 Characterization of scFv 2.10 and 2.12 Intrabody expression
on hERG1a trafficking in HEK293 cells.
4.1.1 scFv Intrabodies used for relocalization
Intrabodies were engineered with the purpose of altering hERG channel trafficking properties. Using standard molecular biology techniques mammalian expression vectors were constructed containing the scFv genes that, inside the host cell, would be constitutively expressed as intrabodies. These constructs, represented in Figure 5, are formed by scFv 2.10 or scFv 2.12 sequence (consisting of the VL and VH regions) joined by a short linker
with His6 and cMyc tags (EQKLISEEDL) at the C-terminus before eGFP. Intrabody folding
in cells is hampered by the reducing environment of the cell cytoplasm and nucleus and adding a C terminal GFP fusion aids in folding/stability and makes it easy to monitor expression using fluorescence. We also introduced a histidine tag to monitor expression by western blot from cell lysates expressing the intrabodies. At the end of eGFP, further tag sequences were added as described in Material and Methods: SV40 NLS, mODC PEST and KKTN, used for redirecting the intrabody to different cellular compartments (Figure 5). For the construct containing KKTN a single transmembrane domain of STE2 was inserted at the N-terminus of the scFv. This TM segment has previously been shown to insert with the N terminus in the ER lumen thus tethering the scFv to the membrane but still allowing cytoplasmic exposure (66). In addition, two glycosylation sites were found at the N-terminus of the STE2 domain (67). Addition of localization tags after eGFP were used to redirect the intrabodies to different cellular locations: WT intrabody remains in the cytosol; NLS tag redirects the intrabody to the nucleus; PEST intrabody is directed for proteasomal degradation; the KKTN together with the STE2 domain at the N-terminus is recycled from the secretory pathway to the ER. The KKTN construct was only designed for the scFv 2.10.
Figure 5- Schematic representation of scFv constructs and their cellular localizations. Each construct contains the scFv
sequence containing VL and VH chains followed by His6, cMyc and eGFP tags at the C-terminus. SV40 NLS, mODC PEST
and STE2 amino acid sequences are represented.
4.1.2 Mammalian Cell expression
4.1.2.1 Fluorescent Imaging
To evaluate the intrabody impact on hERG1a trafficking to the plasma membrane, a stable HEK293 hERG1a cell line (Figure 6 A) was transfected with the intrabody plasmids (Figure 5) and with pcDNA 3.0 as an empty vector control. Untransfected cells were also included as a control. Trafficking of hERG1a channel was assessed by Western Blot or Flow Cytometry 48h post-transfection.
One of the main problems with intrabody expression is the inability of scFv antibodies to fold correctly in the highly reducing environment of the cell cytoplasm and nucleus. Therefore, we first monitored the expression of our scFv’s using a fluorescent microscope (ZOE) to detect signal from eGFP fused to the intrabody (Figure 6 B and C). The transient transfection efficiency was low for all groups of transfected cells estimated <10%. This effect was more prominent in the scFv 2.10 KKTN group, where the amount of transfected DNA had to be doubled to obtain a similar number of transfected cells. The control group transfected with pcDNA3.0 showed no fluorescence, as expected, as well as the untransfected control. However, we could see GFP expressing cells for all of our intrabodies.
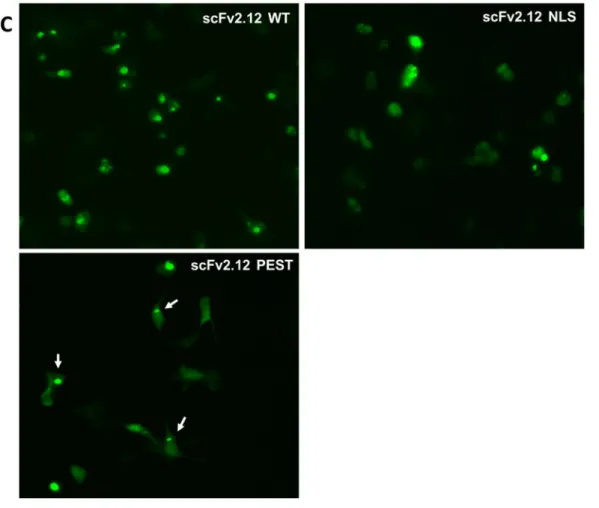
Gross differences in the expression patterns were also observed in cells, consistent with the localization tag on the scFv. Cells expressed scFv 2.10 WT (Figure 6 B) intrabody
throughout the cytoplasm while fluorescence is concentrated in small regions within the cell corresponding to the nucleus for the scFv 2.10 NLS intrabody. scFv 2.10 PEST intrabody fluorescence is distributed in the cytoplasm with a few more concentrated regions potentially coinciding with proteasomes and the KKTN intrabody showed expression mostly in a region around the nucleus typically occupied by the ER. For the scFv 2.12 (Figure 6 C) intrabody expression patterns were the same as for the scFv 2.10, however all transfected cells show a punctate pattern, suggesting intrabody aggregation inside the cell possibly due to instability in intrabody folding. This effect was observed by an accumulation of regions of intense fluorescence, which was particularly clear with the scFv 2.12 WT intrabody.
Figure 6- ZOE microscope imaging of HEK293 hERG1a cells. (A) Phase contrast image of HEK293 hERG1a stable cell line transfected with scFv by effectene transfection kit. 48h post transfection cells were observed by fluorescent ZOE imaging for expression of GFP fused to the intrabodies: scFv 2.10 (B) and scFv 2.12 (C) Arrows indicate the cells with visible transfection pattern
4.1.2.2 Western Blot analysis of intrabodies
Based on the scFv intrabody amino acid sequence the predicted intrabody protein sizes were calculated using https://web.expasy.org/protparam/. Transiently transfected cells were lysed with detergent and analysed for expression of the scFv 2.10 and 2.12 intrabodies by Western Blot using a mouse α-His primary antibody and a goat α-mouse HRP secondary antibody.
For the scFv 2.12 (Figure 7 A), in supernatant (S), the scFv 2.12 WT protein had a band around 55 kDa, as estimated by protparam, the scFv 2.12 NLS and scFv 2.12 PEST proteins showed bands close to the predicted molecular weight of 56 kDa and at 59 kDa,
respectively. The scFv 2.10 intrabodies also showed the expected molecular weights (Figure 7 B and C), with scFv 2.10 WT at 55 kDa, scFv 2.10 NLS at 56 kDa and scFv 2.10 PEST at 59 kDa. The scFv 2.10 KKTN protein extracts showed a more intense band around 60 kDa, however this band is not the predicted size (67 kDa) and is also present in the untransfected control, which means that this is a non-specific protein. This experiment was performed separately from the rest of scFv 2.10, being analysed with a higher exposure time, therefore this non-specific band is not significant for the experiment from Figure 7 B. A diffuse band was also present around the 67 kDa, consistent with the size calculated for the scFv 2.10 KKTN construct. The STE2 has two glycosylation sites, therefore the diffused aspect may be due to the STE2 glycosylation, conferring variation of the scFv 2.10 KKTN size.
We also observed a few low molecular weight bands in lysates from scFv 2.12 intrabody transfected cells than from scFv 2.10 cells suggesting that the scFv 2.12 intrabodies are less stable and more prone to degradation in cells. Cells transfected with scFv 2.10 or 2.12 showed some protein aggregation of the intrabody as shown by the presence of an antibody signal in the pellet (P). This was more obvious in the WT intrabody, both for scFv 2.12 and 2.10.
Figure 7- Western blot analysis of intrabody expression. HEK293 hERG1a cells transfected with scFv 2.12 (A) or scFv 2.10 (B) and (C) were lysed in the presence of detergent and the supernatant (S) and pellet (P) fractions were loaded on a
12% SDS-PAGE gel. After transfer to nitrocellulose membranes, blots were incubated with mouse α-His primary antibody and antibody goat α-mouse HRP secondary. Intrabody sizes were calculated by the Protparam tool: scFv2.12 WT - 55 kDa; scFv2.12 NLS - 56 kDa; scFv2.12 PEST - 59 kDa; scFv2.10 WT - 55 kDa; scFv2.10 NLS - 56 kDa; scFv2.10 PEST - 59kDa; scFv2.10 KKTN - 67 kDa; * represents the 67 kDa diffuse band.
4.1.2.3 Western Blot analysis of hERG1a ion channel
Trafficking of the hERG1a ion channel through the secretory pathway to the plasma membrane can be followed by its glycosylation, which directly relates to the protein size. The hERG1a protein is synthesized in the ER and undergoes N-linked core glycosylation forming a 135kDa immature protein. It is then exported to the Golgi where, after additional N-linked complex glycosylation, it matures to a 155kDa protein that is transported to the plasma membrane. Therefore, the proportion of the mature 155kDa protein compared to the core-glycosylated immature 135kDa protein allows evaluation if any change in trafficking has occurred. The stable cell line transfected with vector control serves as a reference of hERG1a glycosylation patterns, the amount of core and mature protein expressed in a cell, and it is compared with the protein expressed in cells transfected with scFv intrabodies.
The hERG1a channel was monitored by Western Blot of detergent treated cell lysates incubated with rabbit α-herg1a C-terminal primary antibody and goat α-rabbit HRP secondary antibody. As shown in Figure 8 A cells transfected with intrabody constructs scFv 2.12 WT, scFv 2.12 PEST and scFv 2.12 NLS showed no decrease in the mature glycosylation of the hERG1a protein compared to those expressing the vector control,
therefore these intrabodies were not pursued further.
Analysis of cells transfected with the scFv 2.10 intrabodies (Figure 8 B), show that both scFv 2.10 PEST and scFv 2.10 KKTN intrabodies did not change the hERG1a glycosylation pattern. However, cells expressing scFv2.10 NLS intrabody appeared to have a decrease in intensity of the mature glycosylated form of the hERG1a channel compared to the vector control extracts or extracts from cells expressing the scFv2.10 WT intrabody, suggestive of an alteration in hERG’s trafficking. As shown in Figure 8 B this was repeated from two independent transfections.We therefore decided to pursue the effect of the scFv 2.10 NLS intrabody in comparison with the scFv 2.10 WT intrabody.
Figure 8- Western Blot analysis of hERG glycosylation pattern. HEK293 hERG1a cells transfected with scFv 2.12 (A) or scFv 2.10 (B) were lysed and extract loaded in a 7.5% SDS-PAGE gel, blotted and treated with primary antibody rabbit α-herg1a C-terminal and secondary antibody goat α-rabbit HRP. Two hERG bands are detected, corresponding to the core glycosylated (135kDa) and mature glycosylated form (155kDa). scFv2.10 WT and scFv2.10 NLS assays were repeated to confirm difference in glycosylation.
4.1.2.4 Flow Cytometry analysis
Due to the low transfection efficiency, described in Section 4.1.2.1 we realized that the glycosylation pattern of hERG1a observed represents a mixed cell population of both transfected and untransfected cells. In order to analyse hERG1a trafficking only in transfected cells expressing an intrabody we used Flow Cytometry.
Flow Cytometry allows one to specifically select and study only the desired population of cells, that express both hERG1a and the intrabody. Towards this aim we first needed to optimize the use of primary and secondary antibodies required to monitor the hERG1a channel.
We first performed a titration of the fluorescent secondary antibody goat α-rabbit IgG F(ab’)2 APC using untransfected non-permeabilized cells treated with different
concentrations of the antibody (unstained, 1:20, 1:100, 1:250, 1:500, 1:1000 dilutions) (Figure 9 A). In this way we chose a concentration of secondary antibody that does not show nonspecific staining of the cells. This was evaluated by measuring the median fluorescence intensity of each condition in comparison with the unstained group. A titration of the antibody was observed (Figure 9 B), with a reduction in median intensity in the gated
group as the antibody concentration is reduced. The dilution of 1:1000 had the least intense median fluorescence (203) which was similar to the unstained cells median fluorescence (168), therefore this dilution was selected to perform the subsequent assays.
Figure 9- Titration of secondary antibody goat α-rabbit IgG F(ab’)2 APC. (A) Untransfected non-permeabilized HEK293
hERG1a cells were stained with different dilutions of secondary antibody (B) Median Fluorescence Intensity was analysed in the APC+ population gated for the unstained sample. Results were obtained with Accuri Flow Cytometer and analysed at least 20 000 events by Flow Jo.
Titration of the primary antibody rabbit α-hERG targeting the surface exposed S1-S2 loop of the channel was also performed in untreated cells stained with different dilutions (unstained, 1:10, 1:25, 1:50, 1:100, 0) followed by incubation with secondary antibody at a fixed dilution of 1:1000 (Figure 10 A). Based on the median of the fluorescence intensity
(Figure 10 B), a high concentration of the primary antibody is needed to get the best fluorescence intensity. The dilutions 1:10 and 1:25 give the best fluorescence intensities (791 and 781, respectively), being the optimal concentration for the staining. Because of the similarity in the fluorescence intensity, the more diluted concentration of primary antibody was chosen (1:25).
Figure 10- Titration of primary antibody rabbit α-hERG S1-S2 loop. (A) Untransfected and non-permeabilized HEK293 hERG1a cells were stained with different dilutions of primary antibody followed by incubation with secondary antibody at 1:1000 (B) Median Fluorescence Intensity was analysed in the APC+ population of cells. Results were obtained with Accuri Flow Cytometer and analysed at least 20 000 events by Flow Jo.
In order to monitor hERG trafficking to the plasma membrane in cells transfected with scFv 2.10 WT and scFv 2.10 NLS intrabodies by Flow Cytometry, HEK293 hERG1a cells were exposed to two different conditions prior to antibody staining. A portion of cells were left unpermeabilized for quantification of hERG expressed at the plasma membrane– surface staining (Figure 11 A). The remaining cells were permeabilized for quantification of hERG1a present at the plasma membrane as well as in all the other cell compartments – total hERG1a (Figure 11 B). After that all cells were stained with primary antibody rabbit α-hERG S1-S2 loop and secondary antibody goat α-rabbit IgG F(ab’)2 APC, at the optimized
dilutions, and the median fluorescence intensity was analysed in the selected population of cells expressing both the intrabodies and hERG1a channel (GFP+ APC+). From that it was
possible to calculate the percentage of hERG channel at the surface plasma membrane as the ratio of the median fluorescence of non- permeabilized (Surface) to permeabilized cells (Total) (Figure 11 C) for the difference intrabody conditions.
Figure 11- Illustrative representation of transfected cells subjected to different conditions for Flow Cytometry analysis: (A) non permeabilized cells for surface staining and (B) permeabilized cells for total staining. (C) Formula for calculation of hERG percentage expressed at the surface.
The assay was performed in cells transfected with scFv 2.10 WT or scFv 2.10 NLS (Figure 12 A) in order to determine if the NLS localization tag had indeed an effect on hERG1a trafficking to the plasma membrane. The selection of the scFv transfected population presented some difficulty as the GFP channel showed autofluorescence of the cells. However, having selected the population we could see that the percentage of GFP transfected cells was low (less than 6%), confirming that the transfection efficiency is low. For the scFv 2.10 WT group, the median fluorescence intensity of permeabilized cells was, as expected, higher than of non-permeabilized (Figure 12 B). However, calculation of the percentage of hERG1a at the surface shows that the channel is vastly expressed at the plasma membrane. The results were similar for the scFv 2.10 NLS group, with higher median fluorescence intensity in permeabilized cells and without a change in the percentage of hERG at the membrane relative to scFv 2.10 WT.
In conclusion, although the Western Blot results indicated a possible effect of the intrabody scFv 2.10 NLS on hERG1a trafficking to the plasma membrane, using Flow Cytometry we show that the intrabody has no effect on hERG1a trafficking within transfected cells.
Figure 12- Flow Cytometry analysis of hERG surface expression in HEK293 hERG1a stable cell line. (A) Cells transfected with scFv 2.10 WT or scFv 2.10 NLS were treated for surface staining and total staining and incubated with primary
antibody rabbit α-hERG S1-S2 loop (1:25) and secondary antibody goat α-rabbit IgG F(ab’)2 APC (1:1000). (B) Median
Fluorescence Intensity was analysed in the GFP+APC+ population in permeabilized and non-permeabilized cells and percentage of hERG surface expression was calculated. Results were obtained with Accuri Flow Cytometer and analysed at least 20 000 events by Flow Jo.