Published by Associazione Teriologica Italiana Online first – 2016
Hystrix, the Italian Journal of Mammalogy
Available online at:
http://www.italian-journal-of-mammalogy.it/article/view/11722/pdf doi:10.4404/hystrix-27.1-11722 Research Article
Predicting bat distributions and diversity hotspots in southern Africa
Rachael Cooper-Bohannon1,2,∗, Hugo Rebelo3,4,5,2, Gareth Jones5, Fenton (Woody) Cotterill6, Ara Monadjem7, M. Corrie Schoeman8,
Peter Taylor9, Kirsty Park1,2
1Biological and Environmental Sciences, School of Natural Sciences, University of Stirling, FK9 4LA, Scotland, UK. 2Bats without Borders, Biological and Environmental Sciences, School of Natural Sciences, University of Stirling, FK9 4LA, Scotland, UK. 3CIBIO/InBio, Centro de Investigação em Biodiversidade e Recursos Genéticos, Universidade do Porto. Campus Agrário de Vairão, Portugal.
4CEABN/InBio, Centro de Ecologia Aplicada, Instituto Superior de Agronomia, Universidade de Lisboa, Portugal. 5School of Biological Sciences, Life Sciences Building, University of Bristol, 24 Tyndall Ave, Bristol, BS8 1TH, UK.
6African Earth Observatory Network (AEON), Geoecodynamics Research Hub, c/o Department of Botand and Zoology, University of Stellenbosch, Stellenbosch, 7602, South Africa. 7All Out Africa Research Unit, Department of Biological Sciences, University of Swaziland, Private Bag 4, Kwaluseni, Swaziland and Mammal Research Institute, Department of Zoology
& Entomology, University of Pretoria, Private Bag 20, Hatfield, 0028, Pretoria, South Africa.
8School of Life Sciences, University of KwaZulu Natal, Westville Campus, Durban, 4000, South Africa.
9South African Research Chair on Biodiversity Value and Change, School of Mathematical and Natural Sciences, University of Venda, Thohoyandou, 0950, South Africa.
Keywords:
biogeographical strata Chiroptera conservation priorities Maxent
species distribution modelling
Article history:
Received: 16 February 2016 Accepted: 1 June 2016
Acknowledgements
Rachael Cooper-Bohannon PhD was generously funded under a Hori-zon grant at the University of Stirling and by the Rufford Foundation, an organisation supporting conservation research in developing coun-tries. Hugo Rebelo was funded by Fundação para a Ciência e Tecno-logia, Portugal (contract IF/00497/2013). We would like to thank Dr Orly Razgour, Professor Paul Racey and Dr Nils Bunnefeld for earlier com-ments and reviews of the manuscript and to two anonmymous authors who provided valuable feedback. The time given by all reviewers has significantly improved this manuscript.
Abstract
Species distribution models were used to predict bat species richness across southern Africa and to identify potential drivers of these spatial patterns. We also identified species richness within each biotic zone and the distributions of species considered of high conservation priority. We used this information to highlight conservation priorities for bats in southern Africa (defined here as between the latitudes of 8° S, slightly north of Zambia, to the southern tip of Africa 34° S, an area of approximately 9781840 km2). We used maximum entropy modelling (Maxent) to model habitat suitability for 58 bat species in order to determine the key eco-geographical variables influencing their distributions. The potential distribution of each bat species was affected by different eco-geographic variables but in general, water availability (both temporary and permanent), seasonal precipitation, vegetation, and karst (caves/limestone) areas were the most important factors. The highest levels of species richness were found mainly in the eastern dry savanna area and some areas of wet savanna. Of the species considered to be of high priority due to a combination of restricted distributions or niches and/or endemism (7 fruit bats, 23 cave-dwellers, 18 endemic and near-endemic, 14 niche-restricted and 15 range-restricted), nine species were considered to be at most risk. We found that range-restricted species were commonly found in areas with low species richness; therefore, conservation decisions need to take into account not only species richness but also species considered to be particularly vulnerable across the biogeographical area of interest.
Introduction
With limited time and resources, global conservation efforts often fo-cus on areas with high biodiversity, which are frequently determined according to known local species richness hotspots (e.g. Carvalho et al., 2010). While this approach aims to protect the largest number of species, important habitats and/or endemic species (Brooks et al., 2002; Myers et al., 2000), it can overlook some species such as range-restricted specialists, threatened or rare species (e.g. Orme et al., 2005). Having a small geographic range makes species more vulnerable to ex-tinction risk, because they are by default rarer and often have low pop-ulation densities (Safi and Kerth, 2004). Although some biodiversity hotspot metrics include endemism, this may not account for species with specialised niches that exist at low densities across relatively large geographical areas. Identifying conservation priority areas within each biotic zone (i.e. at a smaller spatial scale) and for groups considered to be more sensitive to extinction risk (i.e. threatened, restricted, hereafter referred to as “high priority”) reduces the likelihood of these species being overlooked (Lennon et al., 2003).
Bats (Order Chiroptera) are a diverse group, occupying a variety of ecological niches. Bats account for roughly 20% of all mammal
spe-∗Corresponding author
Email address: [email protected],
[email protected](Rachael Cooper-Bohannon)
cies globally (Kunz and Pierson, 1994; Simmons, 2005). As with many other species worldwide, bats are being negatively affected by a vari-ety of anthropogenic pressures, particularly habitat loss (Mickleburgh et al., 2002; Jones et al., 2009). Bats are also at risk from significant localised threats such as unsustainable harvesting, persecution, roost disturbance, diseases and more recently the negative impacts of wind farms (Vitousek et al., 1997; Mickleburgh et al., 2002; Arnett et al., 2008; Jones et al., 2009). Additionally, bats are often understudied and a lack of data undermines any attempt to evaluate the conserva-tion status of poorly studied species. In many countries bats get little or no legal protection and in some countries, bats are still classified as vermin (Singaravelan et al., 2009).
Southern Africa possesses a rich bat fauna (Monadjem et al., 2010) that is distributed across all seven major biotic zones (Fig. 1). The sub-continent has a diverse fauna and flora and includes four of the 34 biod-iversity hotspots of the world (UNEP, 2008): Cape Floral Kingdom, Succulent Karoo, Maputaland Pondoland Albany Hotspot, and the Coastal Forests of Eastern Africa (Conservation International, 2005). Habitat loss, primarily through widespread deforestation, has been ex-tensive in southern Africa over the last 25 years (Brink and Eva, 2009), but limited distribution data make measuring biodiversity change prob-lematic, hindering any proactive actions to counter population declines. Large-scale land use changes reduce absolute resources, limiting
Hystrix, It. J. Mamm. (2016) — online first
Figure 1– The study area, defined as “southern Africa” (a) in relation to the African continent; (b) political map showing country boundaries, major lakes and rivers and altitude; (c) biotic
zones and major karst areas; and (d) original species occurrence data for all 58 species provided by Monadjem et al. (2010) before data were removed to correct for spatial autocorrelation.
lation sizes, and may also isolate bat populations and prevent gene flow (Ezard and Trevis, 2006), which may result in local extinctions and/or depletion of genetic variability, leading to a time-delayed “extinction debt” (Krauss et al., 2010).
Despite the wide application and undeniable value of the IUCN Red List, the accuracy of assessments is reliant on the information avail-able, often limited in developing countries with little funding. For the 2008 IUCN Red List species assessments, assessors were discouraged from using the Data Deficient category, resulting in an increase in the number of species being reclassified from Data Deficient to Least Con-cern despite little information being available for some of these species. These status changes could result in misleading conservation priorities, which tend to overlook Least Concern species, yet those species may be threatened (e.g. Polidoro et al., 2010).
Species distribution models (SDMs) use eco-geographical variables to predict habitat suitability for species, based on their environmental requirements by using species occurrence data (Elith et al., 2011). SDMs are becoming increasingly important conservation tools, par-ticularly in areas that are ecologically diverse yet have little biological data (e.g. DeMatteo and Loiselle, 2008; Hernandez et al., 2008; Lamb et al., 2008; Papes and Gaubert, 2007). For example, models have been used to direct and prioritise survey efforts, and have aided the discovery of new populations (e.g. Guisan and Thuiller, 2005; Rebelo and Jones,
2010; Razgour et al., 2011). Models can be staked to predict areas of high levels of biodiversity (sometimes referred to as “hotspots’ or species richness maps) in specific geographical areas, family groups, biogeographical affinity or species considered to be more sensitive to extinction risk (e.g. Rebelo et al., 2010; Hughes et al., 2012; Schoeman et al., 2013; Herkt et al., 2016).
Maximum entropy (Maxent; Phillips et al., 2004, 2006) is a popular algorithm due to outperforming other methods as a result of predict-ive accuracy (Merow et al., 2013; Elith et al., 2006) and the use of only presence data (e.g. Rebelo and Jones, 2010; Rebelo et al., 2010; Razgour et al., 2011). While modelling techniques are a useful tool, they do have acknowledged limitations. An important assumption of SDMs is that species are at equilibrium with the environment, biotic interactions are usually not considered (especially when employing cli-matic modelling), and the distribution modelled is the potential rather than realised distribution. The SDM outputs present degrees of suitab-ility (predicting the likelihood of an area being suitable or unsuitable for a species) of a species’ potential distribution (Marcer et al., 2013). However, the difference between potential and realised distribution for bats is often minimal (Rebelo and Jones, 2010), given the relatively high dispersal ability of bats.
Schoeman et al. (2013) modelled species distributions for 64 bat spe-cies across a similar area, using a coarser scale (∼5 km2). They showed
that climate and habitat heterogeneity influence bat species richness in southern Africa and recommended that further work was needed in areas with high spatial heterogeneity that were poorly sampled, and in richness hotspots threatened by anthropogenic impacts. More recently, Herkt et al. (2016) modelled African bat species across the continent using a 1 km2resolution overlaying species predicted habitat
suitabil-ity, showing the highest levels of species richness around the equator, with high levels of endemism along the Cameroon volcanic line. Here we focus on southern Africa, where the subcontinent is largely arid or semi-arid, using finer resolution data than Schoeman et al. (2013) and including a wider range of environmental layers, including satellite im-agery and distance to environmental features considered to be import-ant for bats such as water and karst, limestone areas likely to have caves (Hagen and Sabo, 2011; Monadjem et al., 2010; Monadjem and Reside, 2008). We also assess spatial patterns of “high priority” species, as well as species richness within each of the seven biotic zones considered in this study.
The aim of this study was to assess overall bat richness and species diversity and to identify areas important to potentially “high priority” species (i.e. taxa that are endemic, range- or niche-breadth restricted within the study area, cave-dwelling, and Old World fruit bats — Ptero-podidae). Old World fruit and cave-dwelling bats are considered to be at high risk from anthropogenic impacts, wherever they occur because they are often more visible and found in higher numbers. For example, serious threats from human activity have been reported from cave dis-turbance — caving and tourism, mining activities, guano harvesting, heavy harvesting pressures (bushmeat, medicine and candle wax) and human-wildlife conflict such as recently seen with the cull of Mauritius fruit bat (Pteropus niger) cull due to perceived conflict with fruit farm-ing industry (Hutson et al., 2001; Jones et al., 2003; Kunz and Pierson, 1994; Mickleburgh et al., 1992).
The affinity of bats to biotic zones (“bat biogeography”) has import-ant conservation implications, for example in understanding the conser-vation needs of species with a narrow niche breadth. Species’ biogeo-graphic affinities are intrinsically linked with the Earth’s geography, and hence with climatic conditions and consequent vegetation. Taking into consideration biotic zone affinities separately in SDMs will ensure that biogeographically distinct areas with lower overall species rich-ness will not be overlooked. The specific objectives are to identify: (1) bat species richness across southern Africa and drivers of these spatial patterns; (2) species richness within each biotic zone; and (3) spatial patterns of bats considered to be high priority species.
Materials and methods
Study areaFor the purposes of this study “southern Africa” is defined as the area of continental Africa between latitudes 8° S (slightly north of Zam-bia) to 34° S (the southern tip of Africa), approximately 9781840 km2
(Fig. 1a and Fig. 1b). The northern boundary was drawn north of Zambia across continental Africa rather than using country boundar-ies. The area covers South Africa, Lesotho, Swaziland, Namibia, Bot-swana, Zimbabwe, Mozambique, Malawi, Zambia, parts of Angola and the Democratic Republic of the Congo (DRC), and Tanzania. Further-more, the northern boundary is drawn to exclude the rainforest-savanna mosaic zone to the north. The study area covers seven biotic zones (South-West Cape, South-West arid, highveld, coastal forest mosaic, Afromontane-Afroalpine, and moist and dry savanna (Kingdon, 2013) shown in Fig. 1c overlaid with a karst map (IUCN 2008, modified from Williams and Ford, 2006).
Species presence data
The final presence data were used to train the model, and any species with fewer than 16 occurrence data points (after spatially autocorrel-ated data were removed; see below) were not included in the analysis (Wisz et al., 2008). This reduced the number of species modelled from 70 to 58. We used presence data with an accuracy of up to ∼1 km ob-tained from a wide range of historical museum data collated by Monad-jem et al. (2010). MonadMonad-jem et al. (2010) updated these data in terms of newly discovered distinct species, such as H. gigas and H. vittatus formerly included within H. commersoni (now recognised as a Mada-gascar endemic, Simmons, 2005). Although this is a large dataset, the database is incomplete (e.g. Miniopterus mossambicus is missing from the database) and with taxonomic updates for some species out of date, for example it does not take into account the Rhinolophus hildebrandtii complex (Taylor et al., 2012) or that R. darlingi now comprises two spe-cies (Jacobs et al., 2013). To prevent spatial autocorrelation of presence data we used the Average Nearest Neighbor analyses in ArcGIS 10.0 (ESRI). Highly correlated points for each species were randomly de-leted, resulting in 4899 final occurrence data from the original 5106 data points.
Environmental variables
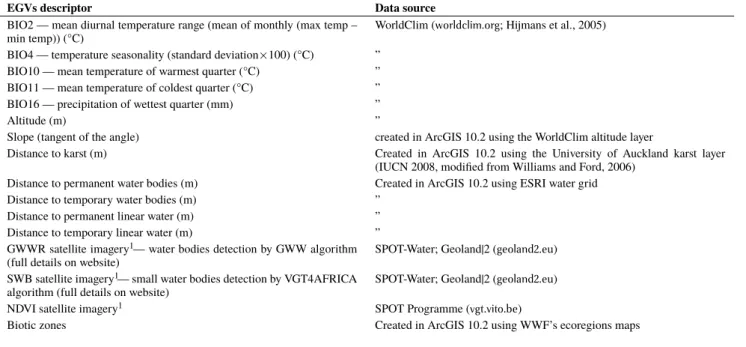
We used the finest scale resolution available for most data (30 arc second, ∼900 m, 0.0083°×0.0083°). The final 16 eco-geographical Table 1– Independent eco-geographical variables (EGVs) selected as environmental predictors.
EGVs descriptor Data source
BIO2 — mean diurnal temperature range (mean of monthly (max temp –
min temp)) (°C) WorldClim (worldclim.org; Hijmans et al., 2005)
BIO4 — temperature seasonality (standard deviation×100) (°C) ” BIO10 — mean temperature of warmest quarter (°C) ” BIO11 — mean temperature of coldest quarter (°C) ”
BIO16 — precipitation of wettest quarter (mm) ”
Altitude (m) ”
Slope (tangent of the angle) created in ArcGIS 10.2 using the WorldClim altitude layer
Distance to karst (m) Created in ArcGIS 10.2 using the University of Auckland karst layer
(IUCN 2008, modified from Williams and Ford, 2006) Distance to permanent water bodies (m) Created in ArcGIS 10.2 using ESRI water grid
Distance to temporary water bodies (m) ”
Distance to permanent linear water (m) ”
Distance to temporary linear water (m) ”
GWWR satellite imagery1— water bodies detection by GWW algorithm
(full details on website) SPOT-Water; Geoland|2 (geoland2.eu)
SWB satellite imagery1— small water bodies detection by VGT4AFRICA
algorithm (full details on website) SPOT-Water; Geoland|2 (geoland2.eu)
NDVI satellite imagery1 SPOT Programme (vgt.vito.be)
Biotic zones Created in ArcGIS 10.2 using WWF’s ecoregions maps
1Monthly layers were created for GWWR (water bodies) and SWB (small water bodies) water from the SPOT (French: Satellite Pour l’Observation de la Terre) water and NDVI (normalised difference vegetation index) by combining the three images per month available from April 1998 – December 2012.
Hystrix, It. J. Mamm. (2016) — online first
Figure 2– Potential range suitability of bat species studied across southern Africa combined to create richness maps for: (a) all 58 bat species, (b) Pteropodidae (fruit bats) — 7 species, (c) Hipposideridae (trident and leaf-nosed bats) — 4 species, (d) Rhinolophidae (horseshoe bats) — 10 species, (e) Nycteridae (slit-faced bats) — 4 species, (f) Molossidae (free-tailed bats) — 9 species, (g) Miniopteridae (long-fingered bats) — 2 species, and (h) Vespertilionidae (plain-faced bats) — 21 species.
variables (EGVs) were selected from 76 potential EGVs (Tab. S1), chosen based on the layers that best contributed to the SDMs overall (i.e. across the 58 species; Tab. 1). EGVs trialled included satellite imagery for vegetation (Normalized Difference Vegetation Index — NDVI) and water availability, combining information of satellite im-ages over a 14 year period across 12 months of the year and distance to karst (caves/limestone) was used to predict the locations of caves. To test for multicollinearity between EGVs we used the software EN-MTools v1.3 (Warren et al., 2010).
The minimum number of species occurrences (n=16) limits the num-ber of EGVs and categorical data used to 16 or below. The biotic zones were further divided into 13 more detailed ecoregions — coastal forest mosaic, dry forest, dry savanna, wet savanna, Afromontane, SW Cape, Namib shrubland, Namib Desert, Nama Karoo, Succulent Ka-roo, highveld and major lakes.
Modelling procedure and evaluation
We generated presence-only SDMs using Maxent v3.3.3k (a modelling algorithm based on a maximum entropy probability distribution; Phil-lips et al., 2004) to predict distributions across southern Africa. The techniques are based on established methodology that has also been used for bats (e.g. Lamb et al., 2008; Flory et al., 2012; Roscioni et al., 2014). Maxent is a general–purpose machine learning method util-ising a statistical mechanics approach (Franklin, 2009) and is robust to sparse data (e.g. Pearson et al., 2007). A species’ distribution is es-timated by finding the maximum entropy distribution. In other words, the probability distribution is uniform (high entropy) given EGV con-straints (Franklin, 2009).
To be able to compare and combine/stack models for multiple cies, the same 16 EGVs and Maxent parameters were used for all spe-cies. Model calculations were made using the Maxent logistic output, rather than raw or cumulative in order to facilitate comparisons between species (Merow et al., 2013). Five cross-validation replicates were run for each species model and averaged into a single model. Maximum it-erations were set at an average of 1000, based on model performance across all target species. The remaining settings were left as default.
Model performance was evaluated based on the area under the curve (AUC) of the receiver operator characteristics (ROC) value. The AUC value (threshold-independent) is an indicator of the predictive accuracy of a model, correctly ranking presence locations higher than random
locations, background points where no absence data are available (Phil-lips et al., 2006; Merow et al., 2013). The AUC value ranges between 0 and 1, with higher values indicating better model fit; a model with an AUC=0.5 indicates that the model performed no better than random (Young et al., 2011), and a value over 0.75 is considered to be good model performance (Elith et al., 2006). We also included the differ-ence in AUC training and test (AUCdiff) (Warren and Seifert, 2011) and each species model sensitivity percentage to further evaluate the model performance (Allouche et al., 2006). We used a Jackknife ana-lysis of gain (a statistical measure of how influential the EGVs are in distinguishing occurrence localities from the total study area) to assess which variables were the most relevant (e.g. Rebelo and Jones, 2010). Predictions of species richness
The Maxent outputs generate continuous maps that were reclassified into binary maps of probable presence (suitable=1) or probable absence (unsuitable=0), using the averaged species-specific logistic threshold value that “maximises training sensitivity plus specificity” (Liu et al., 2013). Species richness maps were produced by combining/stacking binary maps, using the Raster Calculator feature in ArcGIS v10.2 for all 58 species and for each family (with the exception of Emballonuridae which was only represented by one species).
Species richness within biotic zones
Using the binary maps we generated for each species, we calculated the potentially suitable area, per biotic zone as a percentage of the whole biotic zone area occupied by each species (Tab. S2). From these results we were able to determine biotic zone association for each species and whether or not they were generalists, or specialists to a particular biotic zone. The binary maps were used to calculate potentially suitable areas (km2) and percentage cover throughout the study area and within each
of the biotic zones for each of the species. Species vulnerability to extinction
Species or groups considered being at higher risk from extinction or “high priority” are: Old World fruit bats (Pteropodidae); cave-dwelling bats; endemic (or near endemic); bats with a restricted biotic zone affin-ity; narrow niche-breadth; range-restricted, or a combination of these categories (Safi and Kerth, 2004). Cave-dwelling and endemic species were classified according to Monadjem et al. (2010). For the purpose
of this study, endemics (n=18) combine endemic species only recor-ded in southern Africa (n=13) with near-endemic species — species whose known distribution is concentrated within southern Africa with fewer than five data points north of the study area “boundary”. Taking the same approach for cave-dwelling species we generated species rich-ness maps for obligate dwelling species (n=12), facultative cave-dwelling species (n=10), species that only occasionally use caves (n=4), and all these species combined (n=26). For each “high priority group”, species richness maps were created to identify areas of conservation importance.
Standardised niche breadth was calculated using Levins’ (1968) measure of niche breadth (Equation 1).
Bj=
1 Σp2
ij
(1) Bj=niche breadth of species j
pij=proportion of occurrences of species j in biotic zone i.
In order to compare potential species distributions across the seven biotic zones the results were converted to Levin’s standardised niche breadth (Equation 2).
standardisedBj= Bj− 1
n − 1 (2)
Bj=niche breadth of species j
n =number of resources (i.e. biotic zones).
Species were ranked according to their standardised niche breadth value (between 0 and 1) and subsequently categorised as restricted
(be-low the 25thpercentile), intermediate (between the 75thand 25th
per-centile) or broad (above the 75thpercentile).
Range extent was calculated using the modelled species potential distributions as a percentage of the study area (Santos et al., 2014). Species were then ranked according to the extent of their potential dis-tribution and categorised into range-restricted, intermediate or broad as described above.
Results
Model performance
All the models for the 58 species had a high level of predictive accuracy, with AUCtrainingvalues between 0.864 and 0.991. Only three species
had values <0.9 [Eidolon helvum (0.879), Nycteris thebaica (0.864) and Neoromicia capensis (0.871)]. AUCtest values ranged between
0.667 and 0.955. Seven species had test AUC values <0.75 [E. helvum (0.667), Epomophorus wahlbergi (0.730), Hipposideros caffer (0.739),
Nycteris macrotis(0.725), N. thebaica (0.730), Tadarida aegyptiaca
(0.739), Kerivoula argentata (0.739)]. The lower values of the test compared to the training AUC values indicates some degree of model over-fitting. Six of the seven species listed above have relatively large potential distributions (>1000000 km2), the exception is K. argentata
with a potential distribution of 752853 km2 (Tab. S2). The AUC diff
values ranged between 0.213 and 0.021 and sensitivity values ranged between 77–100%, with only 5 species between 77 and 79% and the other 53 species above 80% (Tab. S2).
Species richness
Overall, species richness was highest in the eastern part of southern Africa, covering areas within the Afromontane and coastal forest mo-saic biotic zones in the south-east, stretching north to the dry savanna
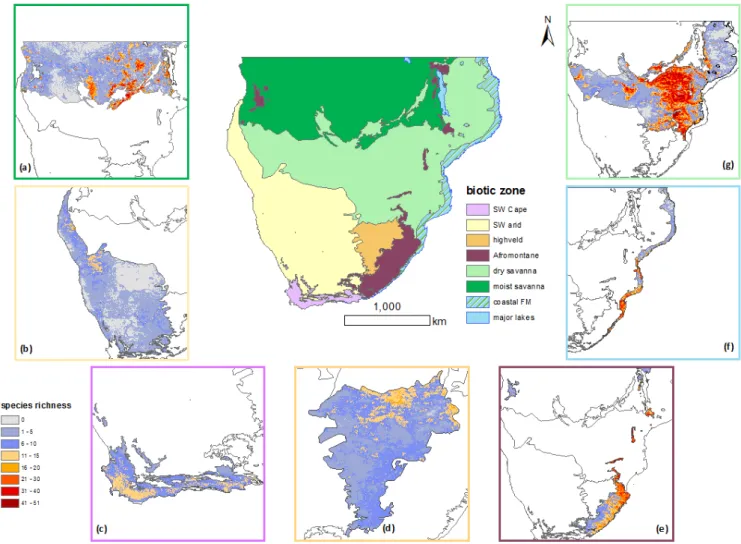
Figure 3– Species richness by biotic region (a) moist savanna, (b) SW arid, (c) SW Cape (fynbos), (d) highveld, (e) Afromontane, (f) coastal forest mosaic, and (g) dry savanna (refer to Tab. S2 for species listed and percentage coverage within each biotic region).
Hystrix, It. J. Mamm. (2016) — online first
Figure 4– Levins’ (1968) measure of standardised niche breadth — species potential occupancy within each biotic zones. Broad categories are defined by the 25thand 75thpercentile. Endemic and near-endemic species highlighted in blue. Species names have been abbreviated in this figure, the full scientific names can be found in Tab. S2.
but also in some of the wet savanna areas and across the Okavango Delta in Botswana. There are also smaller areas of high species rich-ness in the SW Cape, and patches in the west along the transition from SW arid to dry savanna areas (Fig. 2a).
Species richness by family showed some similarities with overall species richness, but spatial patterns for the Hipposideridae and Mini-opteridae indicate these families are largely absent from arid and semi-arid areas (Fig. 2b–h). Within the SW semi-arid biotic zone, comprising the Namib Desert, the Kalahari and Nama and Succulent Karoo, the Namib scrubland is the most important area for bat diversity. While other fam-ilies also occupy parts of the SW arid biotic zone, Rhinolophidae were predicted to be most suited to arid environmental conditions. The spe-cies richness maps per family show several high priority areas across southern Africa.
Species richness within and affinity to biotic zones Moist (i.e. wetter Zambezian miombo woodland dominated by Bra-chystegia, Julbernardia and Isoberlinia) and dry (i.e. Colophpspermum mopane woodland or drier Zambezian miombo woodland dominated by Brachystegia and Julbernardia) savanna biotic zones dominate the
study area (Sankaran et al., 2005); dry savanna in particular has high species richness of bats with weak biogeographic affinities (wide niche breadth). There are also areas of high species richness, within all the biotic zones (Fig. 3a–g). Species with strong biogeographic affinities (narrow niche) were found in the SW Cape, highveld, Afromontane and to a lesser extent the coastal forest mosaic.
High priority species
Based on the standardised Levin’s measure, 14 species had restricted niche breadth (the lowest 25%) (Fig. 4). The most niche-restricted spe-cies in order were: Chaerephon ansorgei, E. dobsonii, Mops midas, M.
niveiventer, H. ruber, S. leucogaster and P. rusticus. Of these 14, three
are endemic taxa (E. dobsonii, N. woodi and R. denti), two are fruit bats (E. dobsonii and E. labiatus) and four are cave-dwelling (H. ruber, N. woodi, R. denti and R. hildebrandtii).
The largest potential distribution was for both N. thebaica and N.
capensis, both potentially occurring in 27% of the study area (Fig. 5).
Sixteen species were categorised as range-restricted by ranking the spe-cies according to their potential occupied area (with potential distribu-tions of 610%). Of these 16 species, six are endemic or near-endemic
Figure 5– Percentage of species potential distribution across southern Africa. Broad categories are defined by the 25thand 75thpercentile. Endemic and near-endemic species highlighted in blue. Species names have been abbreviated in this figure, the full scientific names can be found in Tab. S2.
(e.g. R. capensis — 4%, Miniopterus fraterculus — 5%, N. woodi — 5%, Epomophorus angolensis — 5%, E. dobsonii — 8%, R. blasii — 10%), and the other range-restricted species have potential distribution between 7 to 10%. Apart from the six (near) endemics, three of these species were fruit bats (M. angolensis, E. dobsonii and E. labiatus); three are obligate cave-dwellers (R. capensis, M. fraterculus and R.
blasii) and three occasional cave-dwellers (H. ruber, N. hisperida and
N. woodi). Three species, all considered to be Least Concern (IUCN,
2016), had both a high affinity to a particular biotic zone and are rel-atively range-restricted (68%): E. dobsonii (Pteropodidae), M. midas (Molossidae) and S. leucogaster (Vespertilionidae). Spatial patterns of species considered to be most “high priority” can be seen in Fig. 6a–e. Pteropodidae are predicted to be absent or have low probability of oc-currence in arid and semi-arid environments, and the highest species richness for this family is found in in moist savanna (Fig. 6a).
Epomo-phorus wahlbergiand R. aegyptiacus are the only fruit bats to occupy
the SW Cape biotic zone, yet appear to be absent from the SW arid area, and have a fragmented western distribution (north to south). E.
wahlbergionly occurs in the eastern most parts of the SW Cape,
spe-cifically in the Knysna Forest region. Obligate cave-dwelling species follow a very similar spatial pattern to the overall species richness with some additional areas along the southern edge of the distribution from SW Cape (Fig. 6b). Species with restricted niches, such as C. ansorgei and N. woodi, are found in areas of high species richness in the east of the dry savanna biotic zone. To a lesser extent there is also a corridor from east to west with few species across this region and large patches of lower species richness in the SW arid biotic zone (Fig. 6c). Endem-ics and range-restricted species also follow a similar spatial pattern to the overall species richness map (Fig. 6d–e).
Using a simple matrix we listed all species and summarised traits considered to put species within a “high priority group”, such as being endemic or cave-dwelling. we found three fruit bats, two rhinolophid species and one species of Nycteridae and Miniopteridae in at least three of the five categories linked to a higher probability of extinction (Tab. 2 — species highlighted in bold were considered to be at highest
risk because these species had the highest number of listed vulnerable traits).
Discussion
Species richness hotspots
The highest bat species richness is across the eastern region of southern Africa, a pattern. High species richness across the eastern escarpment follow a similar pattern to woody plant species richness, with lower species richness found in the west and a gradual increase to the east that also has higher levels of rainfall (O’Brien, 1993). The highest levels of bat biodiversity start from south-east South Africa, cover-ing the Afromontane and coastal forest mosaic that continues north along the east coast of Mozambique. The highest areas of bat biod-iversity in savanna run from north-east South Africa, to Zimbabwe, Mozambique, and southern Malawi and Zambia, at altitudes of up to 2000 m, with high summer temperatures and high levels of annual rain-fall (Happold and Lock, 2013). High species richness was also found in the west of the study area, which runs along the Namibian wood-land (transition between SW arid and dry savanna in Namibia). There are limited data on bat distributions in Angola, partly due to the high numbers of landmines in the region, a legacy of the recent civil war (1975–2000s) that has prevented major land use change as has been seen in other areas on the subcontinent (Berhe, 2007) and most cer-tainly are under-represented in these models. The dry forests to the north of the Okavango Delta, in Botswana is predicted to have high bat species richness due to the high availability of water in this semi-arid area. Likewise, the SW arid zones (excluding the northern Kalahari and southern Nama Karoo) is predicted to have higher species richness — most likely following water availability along the Orange River. Important areas for bats within each biotic zone
A large number of species were associated with both savanna biotic zones, and many of these species are also found across more than one biotic zone (i.e. are more generalist species). Some species are more
Figure 6– Species richness maps of groups considered to be “high priority” groups: (a) fruit bats (n=7); (b) cave bats (n=26) — obligate cave-dwellers (12 species), facultative cave-dwellers (10 species) and occasional cave-dweller (4 species); (c) species with a restricted niche breadth (n=14); (d) endemics (n=18) — southern African endemics (13 species) and near-endemics (5 species); and (e) range-restricted species (n=15) (for further species information refer to Tab. S2).
Hystrix, It. J. Mamm. (2016) — online first
Table 2– Summary of species identifying specific criteria that may put them at “higher risk” by having a narrow niche breadth, or being a range-restricted, endemic, fruit or obligate
cave-dwelling species. Criteria relevant to each species are identified by a tick (X) sign relevant to each species. “Additional information” provides further information on species IUCN threat status or predicted distribution if <10% of the study area (NT=Near Threatened and DD=Data Deficient). Species highlighted in bold are considered to be of higher conservation priority, with three or more categories highlighted.
Species Niche-restricted Range-restricted Endemic Fruit bat Obligate cave-dwellers IUCN threatened species No. of biotic zone(s) Additional information
Eidolon helvum X X 6 NT species
Epomophorus angolensis X X X X 6 NT species,
5% distribution
Epomophorus crypturus X X 5
Epomophorus labiatus X X X 3
Epomophorus wahlbergi X 6, SW arid (1%)
Epomops dobsonii X X X X 2 8%
Rousettus aegyptiacus X X 6
Cloeotis percivali X X 5
Hipposideros ruber X 3
Hipposideros vittatus X X 5 NT species
Rhinolophus blasii X X X 5
Rhinolophus capensis X X X 3 NT species
(2004), 4%
Rhinolophus clivosus X 7
Rhinolophus darlingi X 6, moist savanna (1%)
Rhinolophus denti X X 4, Afromontane (1%) 2004 — DD, 12%
Rhinolophus fumigatus X 5
Rhinolophus hildebrandtii X 4 Now identified
as including multiple taxa (Taylor et al., 2012)
Rhinolophus simulator X 6, SW arid (1%)
Rhinolophus swinnyi X 4 Nycteris woodi X X X 2 5% Mops midas X X 2 7% Mops niveiventer X 3 Sauromys petrophilus X 5 Tadarida fulminans X X 3 9% Miniopterus fraterculus X X X 5 5% Miniopterus natalensis X 7 Cistugo lesueuri X 6
Eptesicus hottentotus X 7, moist savanna (1%)
Hypsugo anchietae X 4
Kerrivoula lanosa X 6, SW arid (1%)
Laephotis botswanae X 3
Myotis bocagii X 4
Myotis tricolor X 7
Neoromicia zuluensis X 5
Nycticeinops schlieffeni X 5
Pipistrellus rueppellii X 5, SW arid (1%)
Pipistrellus rusticus X 3
Scotoecus hirundo X 4
Scotophilus dinganii X 5
Scotophilus leucogaster X X 3, Afromontane (1%) 7%
Scotophilus viridis X 4, moist savanna (1%)
restricted, such as K. argentata which is predicted to occur primarily, if not exclusively, in coastal forest mosaic.
The spatial patterns of the family and “high priority” groups largely followed those of overall species richness. However, if only overall species richness patterns were considered, some important areas and species with restricted distributions or narrow niches would be over-looked. For example, in the southern and eastern areas within the highveld biotic zone, most of the highveld is predicted to be particularly suitable for some species in the families Pteropodidae, Rhinolophidae, Molossidae and Vespertilionidae. Central and south-east areas within the SW arid biotic zone are important for fewer species but these are often specialists. For example, 37% of this biotic zone is suitable for
R. denti, with karst areas (providing roosts) and those close to seasonal
rivers/streams predicted to be most suitable. In 2004 this species was classified as “Data Deficient” but its status changed to “Least Concern” in 2008, even though there are very few known roosts.
With limited baseline data on current species distributions and pop-ulation trends, it can be a difficult challenge to prioritise conservation measures. Species that are range-restricted, such as C. ansorgei, are a particular concern due to localised impacts having a potentially large effect on them. Other species may be of lower conservation concern because they are distributed across different biotic zones, but they may occupy a geographically restricted area. Such taxa include E. angolen-sis, which is predicted to be distributed in small patches across SW arid, Afromontane, dry and moist savanna and coastal forest mosaic. Little is known about this species’ distribution, but the population trend may
be decreasing due to habitat loss (IUCN 2016). Without understanding population trends and connectivity across the landscape it is difficult to accurately assess species threats.
“High priority” species
For this study we considered species to be “high priority” if they fea-tured in a combination of three or more of the following categories: en-demic, fruit bats, obligate cave-dwelling bats, niche- or range-restricted species. The seven species considered to be potentially “high priority” were three species in the Pteropodidae (E. angolensis, E. labiatus and E. dobsonii), two rhinolophids (R. blasii and R. capensis), a nycterid (N.
woodi), and a miniopterid (M. fraterculus). All species apart from E.
angolensis(a Near Threatened species) are categorised as Least
Con-cern in the IUCN Red List (IUCN 2016). Of the 58 species studied only three are categorised as Near Threatened, the other two species being
E. helvum(a fruit bat) and H. vittatus, both large visible species and
raises concerns for no longer using Data Deficient assessment status. In this study we show that concentrating conservation efforts solely based on species richness areas can overlook range-restricted and/or rare or other species considered to be at higher risk from extinction. While protecting biodiversity hotspots (or areas of high species rich-ness) supports conservation efforts, they only consider a few areas with high biodiversity, do not account for phylogenetic diversity and can overlook rarer specialist species. The focus on species richness hot-spots has also come under criticism as it does not incorporate the costs associated with different conservation planning options (Daru et al., 2014; Possingham and Wilson, 2005; Kareiva and Marvier, 2003). Modelling limitations and caveats
Since all species models were constrained to employ the same EGVs, we were unable to improve models with layers specifically for indi-vidual species and there were inevitable biases in sampling (e.g. very few records from Angola yet many from Zimbabwe) that resulted in models either over- or under-predicting distributions of some species. For example, models indicate over-prediction (predicting suitability where it is unlikely) in the Western Cape for M. fraterculus, M. boc-agii, M. welwitschii, P. hesperidus and S. dinganii and in the east coast for E. angolensis.
Although species-specific tuning can improve model performance (Anderson and Gonzalez, 2011; Radosavljevic and Anderson, 2014), we modelled the predictive maps using the same set of parameters to be able to compare and combine models. While this study covers a large-scale, care should be taken when projecting results for species in new areas that are not currently within the known range (Peterson et al., 2007). SDMs do not account for barriers to movement and are based on available data (e.g. we were unable to obtain geology maps for the entire study area). Further, accuracy of the data will affect the models, such as misidentified specimens or species groups as an indi-vidual species that are part of a species complex. For example, new genetic findings identified five cryptic species in the R. hildebrandtii complex (Taylor et al., 2012) yet the data used in this study were based on historic records and therefore this species could not be separated. Additionally, museum data are not collected in a standardised, system-atic way, and therefore there may be sampling biases in terms of areas and types of habitat (e.g. catching bats at caves is easier and surveys in Angola have been limited or the data are not available), and species that are harder to catch (e.g. molossids) or found in low densities may be un-dersampled or overlooked in areas they are present (Pardo et al., 2013). However, despite their limitations, SDMs provide valuable information that when used as part of an integrated approach, can inform conserva-tion priority areas and highlight areas where survey efforts should be focused (e.g. Di Marco et al., 2014; Ferrier, 2002).
Implications for bat conservation in southern Africa Currently there are limited conservation management plans in place for bats across this diverse subcontinent (Racey, 2013). Many species are likely to be found in protected areas and are therefore considered pro-tected in these areas. A big challenge in conservation is identifying
conservation priority areas that consider a range of conservation tar-gets (e.g. Buchanan et al., 2011). Therefore, we considered areas that may have fewer but rare species, while also considering endemics and other species considered to be “high priority”, to focus on long-term viability of conservation actions (Embert et al., 2011). The models provide a robust starting point from which to assess potential priority areas for bats — i.e. determining most relevant areas for bat conser-vation for southern Africa by considering biogeographical affinities, levels of endemism and species considered to be at higher risk. The models predict lack of suitable habitat connecting eastern and western distributions, and for many species have a low probability of occurrence in arid and semi-arid areas. With future climate change predictions, the threat of isolating populations and barriers to migration may increase. In addition to savanna, Afromontane is an important biotic zone for many bat species and is considered to be a critically endangered hab-itat (Happold and Lock, 2013). Other threatened biotic zones are the coast forest mosaic, of which there is very little remaining, and the SW Cape, which is important for a few range-restricted species. The SW arid biotic zone is vulnerable from anthropogenic impacts (Happold and Lock, 2013), and although lower in overall species richness this area is important for some rare and range-restricted species. Ideally conservation status (or risk of extinction) would help inform a species’ needs for conservation planning, along with covering areas within all biotic zones. Due to the lack of reliable distribution data and unknown population trends, IUCN conservation assessments cannot provide ac-curate evaluations with limited or outdated information. Often wide ranges are assumed and while the assessments are based on the best information available. Opportunities now exist to use species distribu-tion models to better identify and target areas where data are needed and to also identify areas that are not suitable to better understand spe-cies’ potential distributions and inform conservation assessments. For example, R. capensis is an endemic species located in the southwest extreme of our study area (Eastern and Western Cape up to South-West Namibia) is cave-dependent (Monadjem et al., 2010) and is restricted to 4% of potentially suitable habitat across the study area, yet is con-sidered to be Least Concern.
Over the past few decades bat conservation efforts in some parts of the world has greatly improved our knowledge of species’ trends and ecology, increased public engagement and species protection (e.g. Europe and Latin America; Racey, 2013). Africa is home to approxim-ately 20% of bat species, and with growing threats to bats globally there is an urgent need for bat conservation in areas with large knowledge gaps and unknown conservation status of species. Where resources are limited and little is known about species ranges, species distribution models can be a powerful tool to inform and direct conservation prior-ities, as part of a multi-disciplinary integrated approach.
References
Allouche O., Tsoar S., Kadmon R., 2006. Assessing the accuracy of species distribution models: prevalence, kappa and the true skill statistic (TSS). Journal of Applied Ecology 43: 1223–1232.
Anderson R.P., Gonzalez I., 2011. Species-specific tuning increases robustness to sampling bias in models of species distributions: an implementation with Maxent. Ecological Modelling 222: 2796–2811.
Arnett E.B., Brown W.K., Erickson W.P., Fiedler J.K., Hamilton B.L., Henry T.H., Jain A., Johnson G.D., Kerns J., Koford R.R., Nicholson C.P., O’Connell T.J., Piorkowski M.D., Tankersley R.D. Jr, 2008. Patterns of bat fatalities at wind energy facilities in North America. Journal of Wildlife Management, 72: 61–78.
Berhe A.A., 2007. The contribution of landmines to land degradation. Land Degradation & Develop 18: 1–15.
Brink A.B., Eva H.D., 2009. Monitoring 25 years of land cover change dynamics in Africa: a sample based remote sensing approach. Applied Geography 29: 501–512. Brooks T.M., Mittermeier R.A., Mittermeier C.G., Da Fonseca G.A., Rylands A.B.,
Kon-stant W.R., Flick P., Pilgrim J., Oldfield S., Magin G., Hilton-Taylor C., 2002. Habitat loss and extinction in the hotspots of biodiversity. Conservation Biology 16(4): 909– 923.
Buchanan G.M., Donald P.F., Butchart S.H.M., 2011. Identifying priority areas for conser-vation: a global assessment for forest-dependent birds. PLoS ONE 6: e29080. Carvalho S.B., Brito J.C., Crespo E.J., Possingham H.P., 2010. From climate change
pre-dictions to actions-conserving vulnerable animal groups in hotspots at a regional scale. Global Change Biology 16: 3257–3270.
Conservation International, 2005. Map of Biodiversity Hotspots. Available at: http://cms. unige.ch/isdd/IMG/pdf/cihotspotmap.pdf[10 September 2014].
Hystrix, It. J. Mamm. (2016) — online first
Daru B.H., Bank M., Davies T.J., 2014. Spatial incongruence among hotspots and com-plementary areas of tree diversity in southern Africa. Diversity and Distributions 2014: 1–12.
DeMatteo K.E., Loiselle B.A., 2008. New data on the status and distribution of the bush dog (Speothos venaticus): evaluating its quality of protection and directing research efforts. Biological Conservation 141(10): 2494–2505.
Di Marco M., Buchanan G.M., Szantoi Z., Holmgren M., Marasini G.G., Gross D., Tran-quilli S., Boitani L., Rondinini C., 2014. Drivers of extinction risk in African mammals: the interplay of distribution state, human pressure, conservation response and species biology. Philosophical Transactions of the Royal Society B: Biological Sciences 369: 20130198.
Elith J., Graham C.H., Anderson R.P., Dudík M., Ferrier S., Guisan A., Hijmans R.J., Huettmann F., Leathwick J.R., Lehmann A., Li J., Lohmann L.G., Loiselle B.A., Man-ion G., Moritz C., Nakamura M., Nakazawa Y., Overton J. McC., Peterson A.T., Phil-lips S.J., Richardson K.S., Scachetti-Pereira R., Schapire R. E., Soberón J., Williams S., Wisz M.S., Zimmermann N.E., 2006. Novel methods improve prediction of species’ distributions from occurrence data. Ecography 29: 129–151.
Elith J., Phillips S.J., Hastie T., Dudík M., Chee Y.E., Yates C.J., 2011. A statistical explan-ation of MaxEnt for ecologists. Diversity and Distributions 17: 43–57.
Embert D., Reichle S., Larrea-Alcázar D.M., Cortez C., Muñoz A., Gonzales L., Montaño R., Aguayo R., Domic E., Padial J. M., Maldonado M., Caballero P., Guerrero M., 2011. Priority areas for amphibian conservation in a Neotropical megadiverse country: the need for alternative, non place based, conservation. Biodiversity and Conservation 20: 1557–1570.
Ezard T.H.G., Travis J.M.J., 2006. The impact of habitat loss and fragmentation on genetic drift and fixation time. Oikos 114: 367–375.
Ferrier S., 2002. Mapping spatial pattern in biodiversity for regional conservation planning: where to from here? Systematic Biology 51(2): 331–363.
Flory A.R., Kumar S., Stohlgren T.J., Cryan P.M., 2012. Environmental conditions associ-ated with bat white-nose syndrome mortality in the north-eastern United States. Journal of Applied Ecology 49: 680–689.
Franklin J., 2009. Mapping species distributions: spatial inference and prediction. Cam-bridge University Press.
Guisan A., Thuiller W., 2005. Predicting species distribution: offering more than simple habitat models. Ecology Letters 8: 993–1009.
Hagen E.M., Sabo J.L., 2011. A landscape perspective on bat foraging ecology along rivers: does channel confinement and insect availability influence the response of bats to aquatic resources in riverine landscapes? Oecologia 166: 751–760.
Happold D.C. D., Lock J.M., 2013. Chapter 5: The Biotic Zones of Africa. In: Happold M., Happold D. (Eds.). Mammals of Africa. Vol. I. Introductory chapters and Afrotheria. Bloomsbury, London, pp. 57–74.
Herkt K.M.B., Barnikel G., Skidmore A.K., Fahr J., 2016. A high-resolution model of bat diversity and endemism for continental Africa. Ecological Modelling 320: 9–28. Hernandez P.A., Franke I., Herzog S.K., Pacheco V., Paniagua L., Quintana H.L., Soto A.,
Sewnson J.J., Tovar C., Valqui T.H., Vargas J.,d Young B.E., 2008. Predicting species distributions in poorly-studied landscapes. Biodiversity and Conservation 17(6): 1353– 1366.
Hijmans R.J., Cameron S.E., Parra J.L., Jones P.G., Jarvis A., 2005. Very high resolution interpolated climate surfaces for global land areas. International Journal of Climatology, 25(15): 1965–1978.
Hughes A.C., Satasook C., Bates P.J., Bumrungsri S., Jones G., 2012. The projected effects of climatic and vegetation changes on the distribution and diversity of Southeast Asian bats. Global Change Biology 18: 1854–1865.
Hutson A.M., Racey P.A., Mickleburgh S.P. (Eds.), 2001. Microchiropteran bats: global status survey and conservation action plan (Vol. 56). IUCN, Gland, Switzerland. Jacobs D.S., Babiker H., Bastian A., Kearney T., van Eeden R., Bishop J.M., 2013.
Pheno-typic Convergence in Genetically Distinct Lineages of a Rhinolophus Species Complex (Mammalia, Chiroptera). PLoS ONE 8: e82614.
Jones K.E., Purvis A., Gittleman J.L., 2003. Biological correlates of extinction risk in bats. The American Naturalist 161: 601–614.
Jones G., Jacobs D.S., Kunz T.H., Willig M.R., Racey P.A, 2009. Carpe noctem: the im-portance of bats as bioindicators. Endangered Species Research 8: 93–115. Kareiva P., Marvier M., 2003. Conserving Biodiversity Coldspots Recent calls to direct
conservation funding to the world’s biodiversity hotspots may be bad investment advice. American Scientist 91: 344–351.
Krauss J., Bommarco R., Guardiola M., Heikkinen R.K., Helm A., Kuussaari M., Lindborg R., Öckinger E., Pärtel M., Pino J., Pöyry J., Raatikainen K.M., Sang A., Stefanescu C., Teder T., Zobel M., Steffan-Dewenter I., 2010. Habitat fragmentation causes immediate and time-delayed biodiversity loss at different trophic levels. Ecology Letters 13: 597– 605.
Kingdon J., 2013. The Kingdon field guide to African mammals. A & C Black, London. Kunz T.H., Pierson E.D., 1994. An Introduction. In: Bats of the World. Nowak R.M. (Ed.).
The John Hopkins University Press, Baltimore and London, p. 27.
Lamb J.M., Ralph T.M.C., Goodman S.M., Bogdanowicz W., Fahr J., Gajewska M., Bates P.J.J., Eger J. Benda P., Taylor P.J., 2008. Phylogeography and predicted distribution of African-Arabian and Malagasy populations of giant mastiff bats, Otomops spp. (Chir-optera: Molossidae). Acta Chiropterologica 10: 21–40.
Lennon J.J., Koleff P., Greenwood J.J.D., Gaston K.J., 2003. Contribution of rarity and commonness to patterns of species richness. Ecology Letters 7: 81–87.
Liu C., White M., Newell G., 2013. Selecting thresholds for the prediction of species oc-currence with presence-only data. Journal of Biogeography 40: 778–789.
Mace G.M., Collar N.J., Gaston K.J., Hilton-Taylor C., Akçakaya H.R., Leader-Williams N., Milner-Gulland E.J., Stuart S.N., 2008. Quantification of extinction risk: IUCN’s system for classifying threatened species. Conservation Biology 22: 1424–1442. Marcer A., Sáez L., Molowny-Horas R., Pons X., Pino J., 2013. Using species distribution
modelling to disentangle realised versus potential distributions for rare species conser-vation. Biological Conservation 166: 221–230.
Merow C., Smith M.J., Silander J.A., 2013. A practical guide to MaxEnt for modeling spe-cies’ distributions: what it does, and why inputs and settings matter. Ecography 36(10): 1058–1069.
Mickleburgh S.P., Hutson A.M., Racey P.A., (Eds.), 1992. Old World fruit bats. An action plan for their conservation. IUCN, Gland, Switzerland.
Mickleburgh S.P., Hutson A.M., Racey P.A., 2002. A review of the global conservation status of bats. Oryx 36: 18–36.
Monadjem A., Reside A., 2008. The influence of riparian vegetation on the distribution and abundance of bats in an African savanna. Acta Chiropterologica 10: 339–348. Monadjem A., Taylor P. J., Cotterill F.P.D., Schoemann C., 2010. Bats of southern and
central Africa: a taxonomic and biogeographical synthesis. University of Witwatersrand Press, Johannesburg.
Myers N., Mittermeier R.A., Mittermeier C.G., Da Fonseca G.A., Kent J., 2000. Biod-iversity hotspots for conservation priorities. Nature 403: 853–858.
O’Brien E.M., 1993. Climatic Gradients in Woody Plant Species Richness: Towards an Ex-planation Based on an Analysis of Southern Africa’s Woody Flora. Journal of Biogeo-graphy 20: 181–198.
Orme C.D.L., Davies R.G., Burgess M., Eigenbrod F., Pickup N., Olson V.A., Webster A.J., Ding T.-S., Rasmussen P.C., Ridgely R.S., Stattersfield A.J., Bennett P.M., Black-burn T.M., Gaston K.J., Owens I.P.F., 2005. Global hotspots of species richness are not congruent with endemism or threat. Nature 436: 1016–1019.
Papes M., Gaubert P., 2007. Modelling ecological niches from low numbers of occurrences: assessment of the conservation status of poorly known viverrids (Mammalia, Carnivora) across two continents. Diversity and Distributions 13: 890–902.
Pardo I., Pata M.P., Gómez D., García M.B., 2013. A novel method to handle the effect of uneven sampling effort in biodiversity databases. PLoS ONE 8: e52786.
Pearson R.G., Raxworthy C.J., Nakamura M., Peterson A.T., 2007. Predicting species dis-tributions from small numbers of occurrence records: a test case using cryptic geckos in Madagascar. Journal of Biogeography 34: 102–117.
Peterson A.T., Papeş M., Eaton M., 2007. Transferability and model evaluation in ecological niche modeling: a comparison of GARP and Maxent. Ecography 30: 550–560. Phillips S.J., Dudik M., Schapire R.E., 2004. A maximum entropy approach to species
distribution modeling. In: Proceedings of the 21st International Conference on Machine Learning. ACM Press, New York, pp. 655–662.
Phillips S.J., Anderson R.P., Schapire R.E., 2006. Maximum entropy modeling of species geographic distributions. Ecological Modelling 190(3-4): 231–259.
Polidoro B.A., Carpenter K.E., Collins L., Duke N.C., Ellison A.M., Ellison J.C., Farns-worth E.J., Fernando E.S., Kathiresan K., Koedam N.E., Livingstone S.R., Miyagi T., Moore G.E., Nam V.N., Ong J.E., Primavera J.H., Salmo S.G., Sanciangco J.C., Sukardjo S., Wang Y., Yong J.W.H., 2010. The loss of species: mangrove extinction risk and geographic areas of global concern. PLoS ONE 5: e10095.
Possingham H.P., Wilson K.A., 2005. Biodiversity: turning up the heat on hotspots. Nature 436: 919–920.
Racey P.A., 2013. Bat Conservation: Past, Present and Future. In: Adams R.A., Pedersen S.C. (Eds.) Bat Evolution, Ecology and Conservation. Springer, New York, pp. 517–532. Radosavljevic A., Anderson R.P., 2014. Making better Maxent models of species distribu-tions: complexity, overfitting and evaluation. Journal of Biogeography 41: 629–643. Razgour O., Hanmer J., Jones G., 2011. Using multi-scale modelling to predict habitat
suitability for species of conservation concern: the grey long-eared bat as a case study. Biological Conservation 144: 2922–2930.
Rebelo H., Jones G., 2010. Ground validation of presence-only modelling with rare species: a case study on barbastelles Barbastella barbastellus (Chiroptera: Vespertilionidae). Journal of Applied Ecology 47: 410–420.
Rebelo H., Tarroso P., Jones G., 2010. Predicted impact of climate change on European bats in relation to their biogeographic patterns. Global Change Biology 16: 561–576. Roscioni F., Rebelo H., Russo D., Carranza M.L., Di Febbraro M., Loy A., 2014. A
mod-elling approach to infer the effects of wind farms on landscape connectivity for bats. Landscape Ecology 29: 891–903.
Safi K., Kerth G., 2004. A comparative analysis of specialization and extinction risk in temperate-zone bats. Conservation Biology 18: 1293–1303.
Sankaran M., Hanan N.P., Scholes R.J., Ratnam J., Augustine D.J., Cade B.S., Gignoux J., Higgins S.I., Le Roux X., Ludwig F., Ardo J., Banyikwa F., Bronn A., Bucini G., Caylor K.K., Coughenour M.B., Diouf A., Ekaya W., Feral C.J., February E.C., Frost P.G.H., Hiernaux P., Hrabar H., Metzger K.L., Prins H.H.T., Ringrose S., Sea W., Tews J., Worden J., Zambatis N., 2005. Determinants of woody cover in African savannas. Nature 438: 846–849.
Santos H., Juste J., Ibáñez C., Palmeirim J.M., Godinho R., Amorim F., Alves P, Costa H., de Paz O., Pérez-Suarez G., Martínez-Alos S., Jones G., Rebelo H., 2014. Influences of ecology and biogeography on shaping the distributions of cryptic species: three bat tales in Iberia. Biological Journal of the Linnean Society 112: 150–162.
Schoeman M.C., Cotterill F.P.D.W., Taylor P.J., Monadjem A., 2013. Using potential distri-butions to explore environmental correlates of bat species richness in southern Africa: Effects of model selection and taxonomy. Current Zoology 59: 279–293.
Simmons N.B., 2005. Order Chiroptera. In: Wilson D.E., Reeder D.M. (Eds.). Mammal Species of the World. Johns Hopkins University Press, Baltimore.
Singaravelan N., Marimuthu G., Racey P.A., 2009. Do fruit bats deserve to be listed as vermin in the Indian Wildlife (Protection) and Amended Acts? A critical review. Oryx 43: 608–613.
Taylor P.J., Stoffberg S., Monadjem A., Schoeman M.C., Bayliss J., Cotterill F.P.D., 2012. Four new bat species (Rhinolophus hildebrandtii Complex) Reflect Plio-Pleistocene divergence of dwarfs and giants across an Afromontane archipelago. PLoS ONE 7: e41744.
UNEP, 2008. Africa Atlas of our Changing Environment. Nairobi, Kenya.
Vitousek P.M., Mooney H.A., Lubchenco J., Melillo J.M., 1997. Human domination of Earth’s ecosystems. Science 277: 494–499.
Warren D.L., Seifert S.N., 2011. Ecological niche modelling in Maxent: the importance of model complexity and the performance of model selection criteria. Ecological Applic-ations 21: 335–342.
Warren D.L., Glor R.E., Turelli M., 2010. ENMTools: a toolbox for comparative studies of environmental niche models. Ecography 33: 607–611.
Williams P.W., Ford D.C., 2006. Global distribution of carbonate rocks. Zeitschrift für Geo-morphologie N.F. Suppl.-Vol. 147: 1–2.
Wisz M.S., Hijmans R.J., Li J., Peterson A.T., Graham C.H., Guisan A., 2008. Effects of sample size on the performance of species distribution models. Diversity and Distribu-tions 14: 763–773.
Young N., Carter L., Evangelista P., Jarnevich C., 2011. A MaxEnt Model v3.3.3e Tu-torial (ArcGIS v10). Natural Resource Ecology Laboratory, Colorado State University and National Institute of Invasive Species Science. Available at http://ibis.colostate.edu/ WebContent/WS/ColoradoView/TutorialsDownloads/A_Maxent_Model_v8.pdf
Supplemental information
Additional Supplemental Information may be found in the online version of this arti-cle:
Table S1 Seventy-six eco-geographical variables trialled to build Maxent model for
focal bat species in southern Africa.
Table S2 Species information and modelling prediction results. Figure S3 Species distribution maps: Pteropodidae, Hipposideridae.
Figure S4 Species distribution maps: Rhinolophidae.
Figure S5 Species distribution maps: Emballonuridae, Nycteridae. Figure S6 Species distribution maps: Molossidae.
Figure S7 Species distribution maps: Miniopteridae, Vespertilionidae. Figure S8 Species distribution maps: Vespertilionidae (cont.). Figure S9 Species distribution maps: Vespertilionidae (cont.).