UNIVERSIDADE DA BEIRA INTERIOR
Ciências Sociais e Humanas
Slim and Lean?
The differing impact of the working capital components
on the profitability of the pharmaceutical industry in
the European Union
Cristina Alexandra Gomes Nunes
Dissertação para obtenção do Grau de Mestre em
Gestão
(2º.
ciclo de estudos)
Orientador: Prof. Doutor Pedro Silva
iii
Dedication
I dedicate this dissertation to all the key people in my life that contributed to me being the person I am,
v
Acknowledgements
To my supervisor Prof. Pedro Silva who accepted the guidance of this dissertation, for his dedication and boundless collaboration, as well as the encouragement and confidence in me. The collaboration of Prof. Paulo Maçãs, by his useful help, indispensable for the dissertation. To our friend and godmother, Zita, for her availability and friendship demonstrated during this walk.
To my parents, Maria de Fátima e José Manuel, for the understanding in less positive times and for influencing me to follow this academic journey.
vii
Resumo
Este estudo analisa a relação entre a gestão do fundo de maneio e a rentabilidade da indústria farmacêutica na União Europeia. É utilizada uma amostra de 1515 empresas, com 8748 observações, entre o período de 2004 a 2011. Os resultados da nossa investigação permitem concluir que existe uma relação estatisticamente significativa entre a rentabilidade, medida pelo lucro operacional líquido, e a permanência média dos inventários e o prazo médio de pagamentos, indicando que a minimização do nível de inventários e do prazo médio de pagamentos maximiza a rentabilidade das empresas. Não encontrámos um impacto significativo do prazo médio de recebimentos ou do ciclo de caixa na rentabilidade das empresas farmacêuticas na União Europeia.
Palavras-chave
ix
Resumo Alargado
Notícias publicadas com alguma regularidade na comunicação social sublinham o potencial de libertação de capital investido em fundo de maneio no sector farmacêutico. Por exemplo, o relatório de 2012 da Ernst & Young “Cash on prescription” afirma que as 14 maiores empresas farmacêuticas da Europa e dos EUA poderiam libertar entre 22 e 43 biliões de dólares, o equivalente a 4% a 7% do seu volume de negócios. Perante estes valores tão elevados entendeu-se pertinente investigar até que ponto o investimento em fundo de maneio prejudica a rentabilidade das empresas deste sector. Esta questão foi investigada recorrendo a uma amostra de 1515 empresas com sede na União Europeia entre 2004 e 2011. Utilizou-se para o efeito um modelo de dados em painel de efeitos fixos.
Foi detectada uma relação negativa entre a permanência média dos inventários e o prazo médio de pagamentos e a rentabilidade. Os resultados mostram que o alargamento de um dia na permanência média de inventários prejudica a rentabilidade operacional das empresas em 0,14% e o prolongamento de um dia no prazo médio de pagamentos reduz essa rentabilidade em quase 0,06%.
Não foi encontrada nenhuma relação estatisticamente significativa entre a rentabilidade e o prazo médio de recebimentos ou o ciclo de caixa.
A nossa investigação sugere que as empresas estudadas devem concentrar prioritariamente o seu esforço na gestão eficiente dos inventários, porque neste sector os stocks de segurança são críticos, podendo para o efeito, ser implementadas estratégias diversas de redução de inventários.
“Reduzir as gorduras” das empresas a qualquer custo não é assim um bom conselho para a indústria farmacêutica, tal como, não é para as pessoas em geral.
xi
Abstract
This study examines the relationship between working capital management and profitability of the pharmaceutical industry in the European Union. It analyzed a sample of 1515 firms with 8748 observations for the period 2004-2011. The results of our research shows that there is a statistically significant relation between profitability, measured by net operating income, and the days inventories on-hand and the days payable outstanding indicating that minimizing inventories and days payable outstanding maximizes corporate profitability. We did not find any significant impact of the days sales outstanding and the Net Trade Cycle on the profitability of pharmaceutical companies in the European Union.
Keywords
xiii
Index
1.Introduction……… 21
2.Framework……… 21
3.Literature Review……… 22
4.Data and Methodology……… 25
4.1.Data……… 25 4.2.Methodology……… 26 4.2.1.Variables……… 26 4.2.2.Panel Data……… 27 5.Results……… 28 5.1.Descriptive Statistics……… 28 5.2.Correlations……… 32 5.3.Regressions Analysis……… 33 6.Conclusions……… 37 7.References……… 37
xv
List of Figures
Figure 1 – Relationship between profitability and working capital 24 Figure 2 – NOI means by deciles 30
xvii
List of Tables
Table 1 – Companies per number of employees and age 26 Table 2 – Mean of control variables per NOI quartiles 27 Table 3 – Descriptive statistics of firms in the pharmaceutical sector in the European
Union
28
Table 4 – Means by country 29 Table 5 – Mean per NACE 31 Table 6 – Means per year 31 Table 7 – Correlation between companies variables in the pharmaceutical sector of the European Union
32
Table 8 – Mean VIF by regressions models 34 Table 9 – Probabilities associated with the F test, Breusch-Pagan and Hausman test 34 Table 10 – Results of the regression models 35
xix
List of Acronyms
SMEs Small and medium enterprises
NACE Nomenclature générale des activités économiques dans les communautés européennes
NOI Net operating income DIO Days inventory on-hand DSO Days sales outstanding DPO Days payable outstanding NTC Net trade cycle
GROW Companies growth SIZE Companies size
DEBT Indebtedness of companies
Slim and Lean? The differing impact of the working capital components on the profitability of the pharmaceutical industry in the European Union
21
1. Introduction
The financial press quite regularly publishes analyses of the pharmaceutical sector highlighting the potential for freeing up funds unnecessarily invested in working capital. For example, the “Cash on prescription” report of 2012 from Ernst & Young states that the 14 largest pharmaceutical companies based in Europe and the USA could free between 22 and 43 billion dollars, the equivalent of 4% to 7% of their turnover1.
Given such high values of working capital, it is worth questioning to what extent this investment harms the profitability of companies in this sector. Indeed, in the PwC 2012 report “European Working Capital Annual Review 2012”, of 10 sectors, the pharmaceutical one presents the greatest Net Trade Cycle (NTC). Therefore, the overall aim of this dissertation will be to analyze working capital management trying to understand how the components of working capital should be managed in order to optimize company profitability. I. e., the dissertation will seek the answer to the following research question: What is the relationship
between working capital management and profitability in the pharmaceutical industry in the European Union?
If the negative impact of working capital on the profitability of these firms is confirmed, efficient management of this investment could help the industry at a time when it feels greater competitive pressures and reduced profit margins caused by the growth of generic producers, limited success in introducing new drugs and consumer pressure.
Our results show that reducing inventories is a strategy with a positive impact on operational profitability in the industry but we do not find evidence that long Days Sales Outstanding are harmful. On the contrary, reducing working capital through increasing Days Payable Outstanding is seen to be an unsuitable strategy, a conclusion which coincides with the main empirical studies in this area.
This study begins with a brief framework of the topic and continues with a section referring to the literature review. The following section characterizes the data and the methodology. Then, the results of the study are presented and the conclusion is drawn in the last section.
2. Framework
When approaching the subject of working capital, we must distinguish two different concepts: working capital needs and net working capital. Working capital needs correspond to the
1 The same report states that in the case of Japanese pharmaceutical companies, the potential for
freeing up cash is between 1,6 and 2,5 billion dollars. Quoting Citibank analysts, Reuters reported that the main world pharmaceutical firms could free 33 billion dollars (Reuters, 11/09/12). Pfizer and Roche, for example, could each free 6 or more billion dollars of capital. The PwC study estimated for 83 European pharmaceutical companies excess working capital totalling 16,6 billion euros (PwC, 2012).
Slim and Lean? The differing impact of the working capital components on the profitability of the pharmaceutical industry in the European Union
22
amount of capital necessary for an organization to ensure its everyday operational activities. Net working capital is the actual difference between current assets and current liabilities and may include, for example, excess or unnecessary current assets. Both concepts are expressed in monetary values. Net Trade Cycle is used as an efficiency measure in working capital management and expresses working capital needs in days. It consists of the number of days between the moment the company pays for its purchases of raw material or merchandise until the moment the firm receives the proceeds of the sale of its final products or merchandise, taking storage times into consideration.
A short Net Trade Cycle or reduced working capital needs are normally desired by companies, although in an attempt to balance liquidity with profitability, they may wish to maintain a net working capital that guarantees some safety in the day-to-day financial management. Working capital is composed of three main components: accounts receivable, inventories and accounts payable. Accounts receivable impose an opportunity cost for the organization which nevertheless can be compensated for by gains in market share and customer loyalty because the credit offered may substitutes that of financial institutions. This is a delicate component of management in the pharmaceutical industry under pressure from state clients (many facing financial difficulties) and from clients of the over-the-counter (OTC) channel used to longer credit periods.
Inventories must be kept at a level able to satisfy operational activities but bring about multiple costs for the organization (storage, security, deterioration, obsolescence, etc). In the case of the pharmaceutical industry, these costs are especially significant because safety stock levels, as human health is at stake, must be established so as to almost guarantee a continuous supply.
In the case of accounts payable, the advantage of accepting the offered by suppliers must be balanced with the discount for prompt payment which will be lost.
All these implications make working capital an important component of management of pharmaceutical companies, which, if optimized (balancing its costs and benefits) can maximize the value of the organizations.
3. Literature Review
In recent years, some empirical studies have analyzed the relationship between working capital management and company profitability. Standing out in the literature is the research by Soenen (1993), Jose, Lancaster, & Stevens (1996), Shin & Soenen (1996), Deloof (2003), Lazaridis & Tryfonidis (2006) and Baños-Caballero, García-Teruel & Martínez-Solano (2011). All authors found a negative relationship between Net Trade Cycle and profitability except for the last authors that concluded that when companies have an optimal level of working capital, profitability is maximized.
Slim and Lean? The differing impact of the working capital components on the profitability of the pharmaceutical industry in the European Union
23
In 1993, Soenen was one of the pioneers studying the relationship between Net Trade Cycle and firm profitability. This author investigated 20 industries between 1970 and 1989, concluding that when Net Trade Cycle is reduced, company profitability tends to increase, although that relationship cannot be generalized for all sectors. For Soenen, it is crucial to manage net trade cycle efficiently because it has a direct impact on firms' profitability. Jose, Lancaster, & Stevens (1996) carried out a study of 2718 firms in the period between 1974 and 1993 which analyzed the relationship between business returns and Net Trade Cycle, concluding that the practice of aggressive policies regarding working capital management contributes to improved company performance. However, the authors warn about the negative consequences of excessive reduction of the net trade cycle, i.e., the possibility of too great a reduction in inventories held to cause out-of-stock situations; the possibility of losing customers by reducing the level of credit granted; and the possibility of losing prompt payment discounts to benefit from suppliers credit.
In the case of Shin & Soenen (1996), the study covered 58.985 American non-financial firms in the period 1975 to 1994. Their study identified a strong negative relationship between the duration of the net trade cycle and profitability. For an organization's profitability to be high, the net trade cycle would need to be reduced. Although not studying directly the relationship between the individual components of the net trade cycle and profitability, they conclude (by estimating a negative association between debt and profitability) that the effective strategy consists of reducing investment in credit to clients and inventories and not of increasing supplier credit. The positive and significant relationship between sales growth and profitability underlines the importance of this control variable.
Deloof (2003) also contributed to this line of research studying a sample of Belgian companies in the period 1992 to 1996. The author also concluded that the relationship between gross operational profit and net trade cycle was negative. Despite this negative relationship, Deloof (2003) showed that less supplier credit is associated with greater profitability, perhaps because rejecting the credit period the companies benefit from better payment terms, namely discounts for prompt payment. Deloof (2003) naturally concluded, therefore, that the longer payment periods in Belgium (compared to the USA) contribute to diminished profitability. The author admits this negative relationship between days payable outstanding and gross operational profit may only reflect inverse causality, i.e., the fact that less profitable firms take longer to pay their bills. The same author states that diminished days sales outstanding and average stock levels allow firms to achieve greater profitability. In the case of inventories, attention is drawn to the hypothesis of this negative relationship with profitability being the consequence of diminished sales which contributes to reduced profit and higher stock levels.
The study by Lazaridis & Tryfonidis (2006) concerns Greece and analyzes 131 companies listed in the Athens stock market in the period 2001 to 2004. The main results show that net operational profitability is negatively related to days inventory held, days sales outstanding, days payable outstanding and Net Trade Cycle, agreeing with studies carried out previously.
Slim and Lean? The differing impact of the working capital components on the profitability of the pharmaceutical industry in the European Union
24
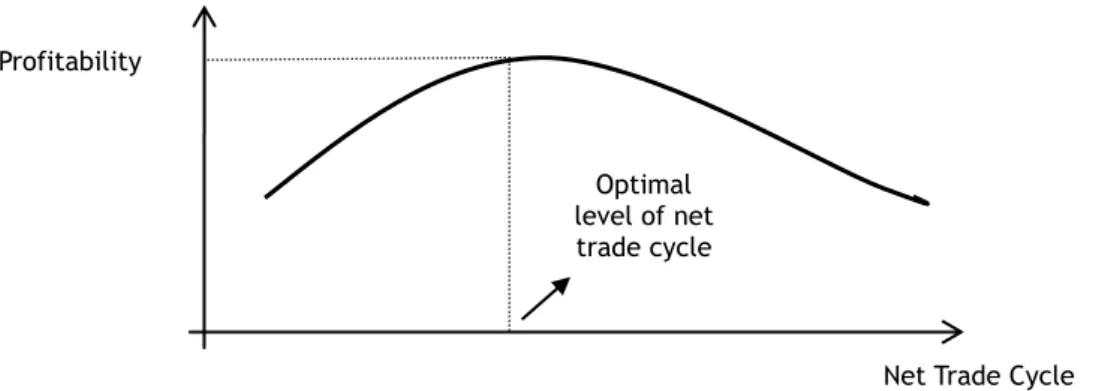
The authors hypothesize that when companies have funds available (even if for this they need to resort to debt), they can pay for their purchases immediately and obtain better prices. That could explain the positive relationship between gross operational profit and financial debt, being used with the aim to reduce the Net Trade Cycle and increase profitability. More recently, in 2011, Baños-Caballero et al. studied 1.008 Spanish SMEs for the period 2002 to 2007. This study differs from the previous ones because the authors identify a non-linear relationship between working capital management and profitability. Profitability increased when investment in working capital increased at low levels and diminished with high levels of increased investment in working capital (Figure 1). Therefore, if companies abandon their optimal level of working capital, profitability begins to decrease.
Figure 1 – Relationship between profitability and working capital
Besides the studies mentioned above, others have contributed to a better understanding of the relationship between working capital and profitability. An early paper by Czyzewaki & Hicks (1992) studied various firms spread over eight groups according to their level of profitability (high or low) over a period of 20 years. The authors observe that in some of the industries studied, the most profitable firms have low percentages of accounts receivable, whereas in other sectors a diametrically opposite situation was found, meaning nothing can be inferred about the relationship between days sales outstanding (DSO) and profitability. Wang (2002) studied the relationship between working capital management and company performance in Japan and Taiwan between 1985 and 1996, concluding that aggressive management of liquidity, through reducing the Net Trade Cycle, increases the value of firms in these two countries with different characteristics and financial systems. In his study, Wang adds that the relationship between Net Trade Cycle and firms' operational performance can depend on factors such as competitive strengths, production processes and distribution channels specific to sectors of activity.
Valadas (2005) studied 4616 Portuguese companies in the period 1996 to 2002. The author concludes that reduction of working capital needs should be carried out mainly by reducing trade credit offered and inventories, measures with greater impact on the profitability of assets. His study identifies a reduction in the impact of these variables over time, suggesting that in a worsening economic climate the costs associated with customer credit could begin to be compensated for by the greater sales dynamics they allow.
Profitability
Optimal level of net trade cycle
Slim and Lean? The differing impact of the working capital components on the profitability of the pharmaceutical industry in the European Union
25
Another study made in 2007 by García-Teruel & Martínez-Solano with a sample of 8872 SMEs in the period 1996 to 2002 revealed that working capital management is very important for all companies, principally for small ones because most of their assets are term and short-term liabilities are one of their main sources of external finance. The same authors, using panel data methodology, find that through reducing stock levels and days sales outstanding (DSO) managers are able to create value in organizations, proving once more that reducing the net trade cycle maximizes profitability.
Neves (2011) also studied the relationship between working capital management and profitability. This author analyzed 50 telecom firms in the period 1998 to 2009, but concluded, contrary to the literature in general, that increased net trade cycle in this sector,
ceteris paribus, has a positive impact on profitability.
Also in 2011, Silva studied a sample of Portuguese industrial companies over 10 years (1996-2006). The author observes that the most profitable firms in her research presented a short Net Trade Cycle. The negative and significant relationship was non-linear according to the author and so there is an optimal level of Net Trade Cycle which maximizes company profitability.
More recently, Rehn (2012) investigated listed companies in Finland and Sweden between 2002 and 2010. Again, increased company profitability is possible through efficient management of working capital. In his study, days sales outstanding and days payable outstanding are the variables with greatest impact on profitability, but in some cases, due to differences between industries, the days inventories on-hand has the highest impact. Finally, Rehn (2012) states that companies in Finland and Sweden are not more profitable by shortening the days payable outstanding.
4. Data and Methodology
4.1. Data
Our data were collected from the AMADEUS database supplied by Bureau van Dijk. Initially, all companies in the pharmaceutical sector of the European Union (NACE 2100/2110/2120) were selected for the period of analysis 2004 to 2011. At a second stage, companies with negative equity and all micro-firms were eliminated according to the criteria defined by the European Union2, aiming to minimize errors in the financial information and missing data. At the third
and final stage of selection, all year/company observations presenting obviously incorrect accounting figures, years/company with incomplete information and the years when
2 A micro-firm is defined as “a company employing fewer than 10 people and with an annual turnover or
total annual balance sheet not exceeding 2 million euros.”
Slim and Lean? The differing impact of the working capital components on the profitability of the pharmaceutical industry in the European Union
26
companies were founded and the following year were eliminated. It was also required that each company had at least two consecutive years of complete information. The application of these criteria resulted in a sample of 1515 companies with 8748 observations.
Table 1 – Companies per number of employees and age Number of
employees
Number of companies
Company age Number of companies 0-49 527 0-9 149 50-99 273 10-19 434 100-249 337 20-29 322 250-499 176 30-49 294 500-749 61 50-99 282 + 750 141 + 100 34 TOTAL 1515 TOTAL 1515
Table 1 shows the number of companies according to the number of employees and age, showing that almost a third of firms in our study are small in size (under 50 employees) and that the most representative age-group is between 10 and 19 years since foundation. The countries contributing the greatest number of firms to the sample are Italy, Spain, France and the United Kingdom (Table 4).
4.2. Methodology
4.2.1. Variables
The dependent variable in the study is Net Operating Income (NOI) calculated as follows:
(1)
As in Shin & Soenen (1996), the dependent variables were calculated as: DIO – Days Inventories On-hand
(2)
DSO – Days Sales Outstanding
Slim and Lean? The differing impact of the working capital components on the profitability of the pharmaceutical industry in the European Union
27
DPO – Days Payable Outstanding
(4)
NTC – Net Trade Cycle
(5)
As control variables we used: sales growth, company size, debt and the variability of net operational income. Therefore, GROW – the percentage growth in sales, results from comparing the year's turnover with that of the previous year; SIZE – company size is measured by the natural logarithm of sales; DEBT – debt is the result of dividing total liabilities by total assets; VARNOI – represents the variability of net operational income. These are variables with a known impact on profitability which we want to neutralize.
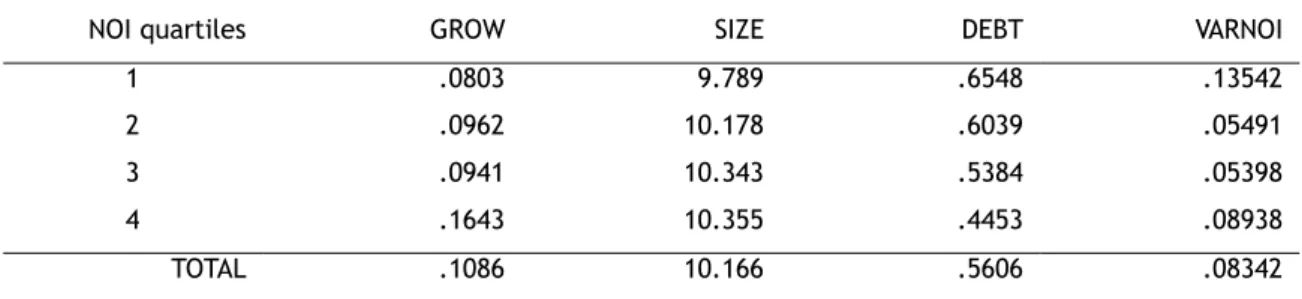
Table 2 – Mean of control variables per NOI quartiles
NOI quartiles GROW SIZE DEBT VARNOI
1 .0803 9.789 .6548 .13542
2 .0962 10.178 .6039 .05491
3 .0941 10.343 .5384 .05398
4 .1643 10.355 .4453 .08938
TOTAL .1086 10.166 .5606 .08342
The control variables behave differently over the quartiles. Table 2 indicates that the GROW and SIZE variables (referring to company growth and size) increase as profitability increase. This suggests that companies presenting greater growth and size tend to be more profitable. On the contrary, the DEBT variable diminishes steadily over the profitability quartiles. In the case of VARNOI, its behaviour does not appear to be linear with lower values in the intermediate quartiles.
4.2.2. Panel Data
This study analyzes the relationship between profitability and efficiency in working capital management in firms in the pharmaceutical sector in the European Union using panel data methodology.
The structure of panel data conjugates firms' cross-section observations over various periods of time.
According to Hsiao (2003), use of panel data has various advantages: it can control for non-observable individual heterogeneity; can reduce the collinearity between explanatory variables and increase degrees of freedom; it can facilitate identification and measure of
Slim and Lean? The differing impact of the working capital components on the profitability of the pharmaceutical industry in the European Union
28
economic effects not observable in cross-section or time-series data; and it can allow for the construction and testing of more sophisticated models.
The general research model is:
Yit = i + X'it βi + εit (6) εit=µi+vit (7) where: i= 1, 2,…, 1515 companies; t= 2004,…, 2011 years; Yit – dependent variable;
i – interception of the equation;
X'it – independent variables;
i – coefficients of the variables Xit;
εit – composite error term of the equation;
µi – individual specific effects component, invariable over time;
vit – idiosyncratic error;
5. Results
5.1. Descriptive Statistics
Table 3 – Descriptive statistics of firms in the pharmaceutical sector in the European Union
Variables Mean Stand. Dev. Maximum P10 P90 Minimum
NOI .10275 .43360 10.33137 .00500 .26788 -20.22108 DIO 63.3 53.9 1188.1 19.3 112.3 .363 DSO 84.4 75.9 976.1 20.9 155.3 0 DPO 48.2 54.1 920.3 4.2 91.2 0 NTC 99.9 93.0 1516.7 22.5 192.4 -502.7 GROW .1086 .5412 18.1594 -.1400 .3105 -.9496 SIZE 10.166 1.801 17.437 7.983 12.460 4.758 DEBT .5606 .2353 .9999 .2275 .8708 .0042 VARNOI .08342 .30889 8.72235 .01533 .12723 .00012
Average net operational income (NOI) is 10,28% and represents the average operational gains of pharmaceutical firms for every 100€ of turnover. The standard deviation is 43,36%, indicating that the NOI values in the sample are very disperse.
Slim and Lean? The differing impact of the working capital components on the profitability of the pharmaceutical industry in the European Union
29
In relation to the components of working capital management, pharmaceutical firms in the European Union present an average of 84 days payable outstanding (DPO) and a minimum value of 0 days, showing that in some companies sales are paid for immediately. Also, there is an average 48 days payable outstanding (DPO) to suppliers, which is relatively low, with a standard deviation of 54 days and a minimum value of 0 days. This last result shows that our sample also includes firms that pay for all their purchases immediately. Average duration of stock in storage (DIO) is 63 days, with a maximum value of 1188 days. Analysis of these figures lets us conclude that companies in the pharmaceutical sector present a DPO less than the DSO or DIO, contributing to a high Net Trade Cycle which averages around 100 days (varying between 1517 days and -503 days).
We note that the average NTC in the industry is high due to DPO being low, as the DSO and DIO present values that can be considered normal.
The mean growth (GROW) of companies' sales is 10,86%, an apparently significant figure as it occurs in a sample period that includes the financial crisis of 2008. The mean debt ratio (DEBT) is 56,06%, with a standard deviation of 23,53%. The variability of net operational income (VARNOI) presents a mean value of 8,34% with a standard deviation of 30,89%, meaning that the VARNOI values are considerably disperse.
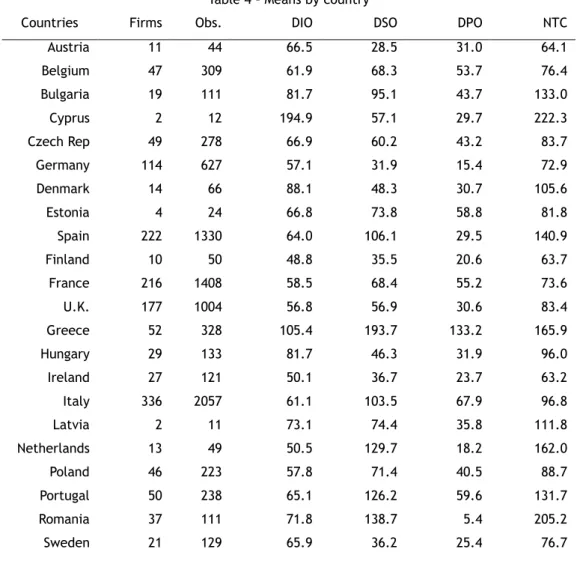
Table 4 – Means by country
Countries Firms Obs. DIO DSO DPO NTC
Austria 11 44 66.5 28.5 31.0 64.1 Belgium 47 309 61.9 68.3 53.7 76.4 Bulgaria 19 111 81.7 95.1 43.7 133.0 Cyprus 2 12 194.9 57.1 29.7 222.3 Czech Rep 49 278 66.9 60.2 43.2 83.7 Germany 114 627 57.1 31.9 15.4 72.9 Denmark 14 66 88.1 48.3 30.7 105.6 Estonia 4 24 66.8 73.8 58.8 81.8 Spain 222 1330 64.0 106.1 29.5 140.9 Finland 10 50 48.8 35.5 20.6 63.7 France 216 1408 58.5 68.4 55.2 73.6 U.K. 177 1004 56.8 56.9 30.6 83.4 Greece 52 328 105.4 193.7 133.2 165.9 Hungary 29 133 81.7 46.3 31.9 96.0 Ireland 27 121 50.1 36.7 23.7 63.2 Italy 336 2057 61.1 103.5 67.9 96.8 Latvia 2 11 73.1 74.4 35.8 111.8 Netherlands 13 49 50.5 129.7 18.2 162.0 Poland 46 223 57.8 71.4 40.5 88.7 Portugal 50 238 65.1 126.2 59.6 131.7 Romania 37 111 71.8 138.7 5.4 205.2 Sweden 21 129 65.9 36.2 25.4 76.7
Slim and Lean? The differing impact of the working capital components on the profitability of the pharmaceutical industry in the European Union
30
Slovenia 5 24 90.6 91.8 117.1 65.3
Slovakia 12 61 68.5 77.6 47.6 98.5
TOTAL 1515 8748 63.3 84.4 48.2 99.9
From observation of the previous table we can state that the country with the greatest number of observations is Italy (2057), followed by France (1408), Spain (1330) and the United Kingdom (1004). With 11 observations, Latvia is the country with fewest observations in the study.
Table 4 shows that Cyprus, Greece, Slovenia and Denmark present the highest values of DIO. The countries with the most significant values of DSO are Greece, Romania, the Netherlands, Portugal and Spain, contributing to a Net Trade Cycle which is also high and, according to the literature on the relationship between profitability and working capital management, will mean rather unprofitable companies.
Days payable outstanding generally presents a lower number of days than that reported in the literature. Greece (133,2) and Slovenia (117,1) register the highest values, whereas Romania (5,4) and Germany (15,4) have the lowest.
Therefore, the country showing the longest Net Trade Cycle is Cyprus with 222 days and Ireland shows the shortest net trade cycle (63 days).
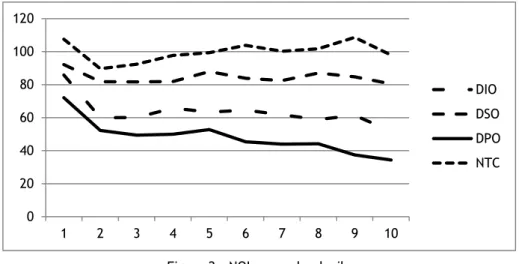
Figure 2 – NOI means by decile
From the analysis of Figure 2 we can state that the profitability of all components of working capital management tends to have an inverse relationship (although not particularly pronounced), i.e., as the number of the profitability decile increases, the number of days of the components generally tends to decrease.
DIO and DPO are the variables presenting the most significant differences when comparing the initial value in decile 1 (approximately 86 and 72) and the final value in decile 10 (approximately 52 and 34). 0 20 40 60 80 100 120 1 2 3 4 5 6 7 8 9 10 DIO DSO DPO NTC
Slim and Lean? The differing impact of the working capital components on the profitability of the pharmaceutical industry in the European Union
31 Table 5 – Mean by NACE
NACE Firms Obs. NOI DIO DSO DPO
2100 72 427 .09070 59.7 97.3 67.5
2110 429 2440 .11901 67.9 73.5 36.9
2120 1014 5881 .09688 61.7 88.0 51.5
TOTAL 1515 8748 .10275 63.3 84.4 48.2
Our study covers exclusively companies with the NACE code 21 – Production of basic pharmaceutical products and pharmaceutical preparations. Code number 2110 refers to the production of basic pharmaceutical products and code number 2120 corresponds to pharmaceutical preparations.
Table 5 indicates that the NACE with the greatest number of observations is 2120, with average profitability of 9,69%.
NACE 2110 shows a higher figure for profitability (11,90%) and lower DPO and DSO (37 and 73,5 days respectively).
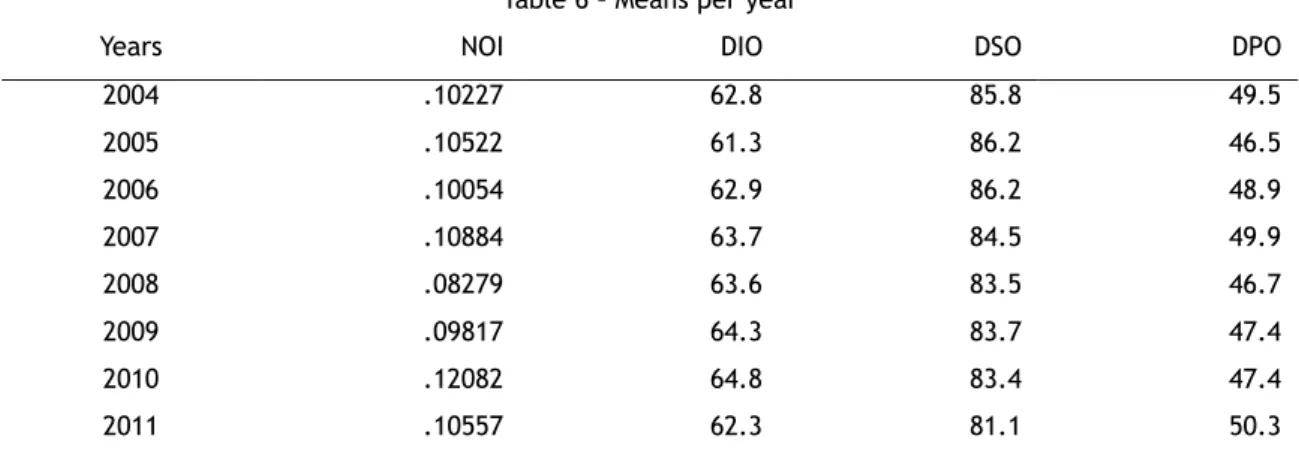
Table 6 – Means per year
Years NOI DIO DSO DPO
2004 .10227 62.8 85.8 49.5 2005 .10522 61.3 86.2 46.5 2006 .10054 62.9 86.2 48.9 2007 .10884 63.7 84.5 49.9 2008 .08279 63.6 83.5 46.7 2009 .09817 64.3 83.7 47.4 2010 .12082 64.8 83.4 47.4 2011 .10557 62.3 81.1 50.3
Table 6 shows the evolution of NOI, DIO, DSO and DPO per year. The figure for profitability is greatest in 2010 (12,08%) and lowest in 2008 (8,28%). According to these figures, we can conclude that the European crisis, up to the last year of the study (2011), had no great impact on the pharmaceutical sector as regards company profitability.
The number of days inventory on hand, the days sales outstanding and the days payable outstanding show great stability over the period.
Slim and Lean? The differing impact of the working capital components on the profitability of the pharmaceutical industry in the European Union
32
5.2. Correlations
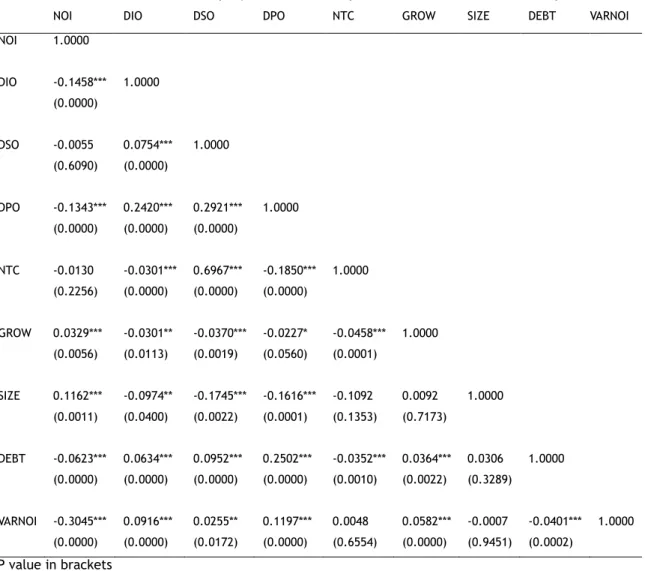
Table 7 – Correlation between company variables in the pharmaceutical sector in the European Union
NOI DIO DSO DPO NTC GROW SIZE DEBT VARNOI
NOI 1.0000 DIO -0.1458*** (0.0000) 1.0000 DSO -0.0055 (0.6090) 0.0754*** (0.0000) 1.0000 DPO -0.1343*** (0.0000) 0.2420*** (0.0000) 0.2921*** (0.0000) 1.0000 NTC -0.0130 (0.2256) -0.0301*** (0.0000) 0.6967*** (0.0000) -0.1850*** (0.0000) 1.0000 GROW 0.0329*** (0.0056) -0.0301** (0.0113) -0.0370*** (0.0019) -0.0227* (0.0560) -0.0458*** (0.0001) 1.0000 SIZE 0.1162*** (0.0011) -0.0974** (0.0400) -0.1745*** (0.0022) -0.1616*** (0.0001) -0.1092 (0.1353) 0.0092 (0.7173) 1.0000 DEBT -0.0623*** (0.0000) 0.0634*** (0.0000) 0.0952*** (0.0000) 0.2502*** (0.0000) -0.0352*** (0.0010) 0.0364*** (0.0022) 0.0306 (0.3289) 1.0000 VARNOI -0.3045*** (0.0000) 0.0916*** (0.0000) 0.0255** (0.0172) 0.1197*** (0.0000) 0.0048 (0.6554) 0.0582*** (0.0000) -0.0007 (0.9451) -0.0401*** (0.0002) 1.0000 P value in brackets
***significant at 1% **significant at 5% *significant at 10%
Table 7 shows the correlation between variables, where a negative correlation can be observed between profitability (NOI) and the components of working capital management. Among the various components of working capital management, DIO and DSO are the variables presenting the most negative correlation (and the only significant ones), showing that long periods of storage or days payable outstanding are associated with low profitability. These results are identical to those of Deloof (2003). Net Trade Cycle has a negative relationship with NOI (-0.0130), but it is not significant. At first sight, this result agrees with the main studies carried out in this area, where a short Net Trade Cycle is always associated with greater profitability.
Other significant correlations at the levels of 1% and 5% are also found between variables. Examples of this are the correlations between VARNOI and NOI which present a negative relationship and close to the level of significance of 1%, and NTC and DSO, which present a positive correlation but also close to the level of significance of 1%.
Slim and Lean? The differing impact of the working capital components on the profitability of the pharmaceutical industry in the European Union
33
The relationship between company size and profitability is positive (0.1162). This means that the greater company size the greater profitability will be. That relationship can be explained by economies of scale, as large firms manage to take advantage of their size producing in large quantities without a proportional increase in production factors, resulting in increased profitability.
Debt (DEBT) has a negative and significant correlation with company profitability (NOI), which means this variable (DEBT) should be able to explain the variation in profitability. However, as DEBT presents a negative relationship with profitability, whenever profitability increases debt tends to decrease. With these results, we cannot confirm that the companies studied present advantages from using debt, as indicated in the study by Lazaridis & Tryfonidis (2006). To sum up, VARNOI and NOI are the variables presenting the most negative correlation and NTC and DSO the variables with the most positive correlation.
5.3. Regression Analysis
The regression analysis was used to study the impact of working capital management on company profitability. Panel data methodology was used, estimating the following models:
NOIit=i+1(DIOit)+2(GROWit)+3(SIZEit)+4(DEBTit)+5(VARNOIit)+εit (7)
NOIit= i+1(DSOit)+2(GROWit)+3(SIZEit)+4(DEBTit)+5(VARNOIit)+εit (8)
NOIit= i+1(DPOit)+2(GROWit)+3(SIZEit)+4(DEBTit)+5(VARNOIit)+εit (9)
NOIit= i+1(NTCit)+2(GROWit)+3(SIZEit)+4(DEBTit)+5(VARNOIit)+εit (10)
NOIit=i+1(DIOit)+2(DSOit)+3(DPOit)+4(GROWit)+5(SIZEit)+6(DEBTit)+7(VARNOIit)+εit (11)
where:
it – i represents the companies and t the period of analysis;
NOI – net operational income;
– constant of the equation;
– coefficient indicating the impact of independent variables on the dependent variable; ε – non-observable errors/factors affecting profitability;
DIO – days inventories on-hand; DSO – days sales outstanding; DPO – days payable outstanding; GROW – growth;
SIZE – size; DEBT – debt;
Slim and Lean? The differing impact of the working capital components on the profitability of the pharmaceutical industry in the European Union
34 Table 8 – Mean VIF by regression models
Variables (1) (2) (3) (4) (5) DIO 1.02 1.07 DSO 1.04 1.13 DPO 1.11 1.26 NTC 1.02 GROW 1.01 1.01 1.01 1.01 1.01 SIZE 1.02 1.04 1.04 1.02 1.06 DEBT 1.01 1.02 1.09 1.01 1.09 VARNOI 1.02 1.01 1.02 1.01 1.02 TOTAL 1.01 1.02 1.05 1.01 1.09
The VIF3 (variance inflation factor) values clearly indicate there is no multicollinearity
between the explanatory variables.
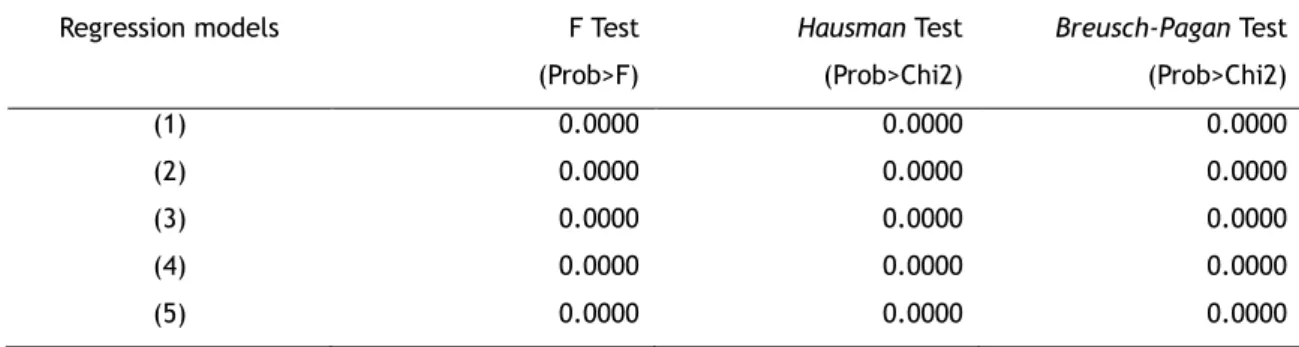
To check whether the Pooled OLS model would be sufficient, we carried out the F test (rejecting the model in favour of the fixed effect model) and the Breusch-Pagan test (rejecting the model in favour of the random effect model). The fixed effect model was chosen after performing the Hausman test which confirmed the existence of correlation between the error terms and individual effects. The significance of the tests is presented in Table 9.
Table 9 – Probabilities associated with the F test, Breusch-Pagan test and Hausman test
Regression models F Test
(Prob>F) Hausman Test (Prob>Chi2) Breusch-Pagan Test (Prob>Chi2) (1) 0.0000 0.0000 0.0000 (2) 0.0000 0.0000 0.0000 (3) 0.0000 0.0000 0.0000 (4) 0.0000 0.0000 0.0000 (5) 0.0000 0.0000 0.0000
The results presented next in Table 10 were obtained using the within fixed effect estimator and report robust t statistics for heterogeneity and autocorrelation.
Slim and Lean? The differing impact of the working capital components on the profitability of the pharmaceutical industry in the European Union
35 Table 10 – Results of the regression models
(1) (2) (3) (4) (5) Variables of working capital management DIO -.001515*** -3.93’ (0.000) -.001384*** -3.50’ (0.000) DSO -.000023 -0.19’ (0.848) .000045 0.39’ (0.699) DPO -.000978*** -3.90’ (0.000) -.000566** -2.53’ (0.011) NTC -.000274 -1.40’ (0.161) Control variables GROW .023883** 2.27’ (0.023) .029506*** 2.74’ (0.006) .026623** 2.48’ (0.013) .027448** 2.52’ (0.012) .022805** 2.16’ (0.031) SIZE .117092*** 5.20’ (0.000) .162958*** 5.88’ (0.000) .143179*** 5.96’ (0.000) .154543*** 5.99’ (0.000) .109989*** 5.22’ (0.000) DEBT -.114802** -2.15’ (0.031) -.167876*** -3.24’ (0.001) -.121278** -2.38’ (0.017) -.163924*** -3.18’ (0.001) -.093577* -1.76’ (0.078) R-sq (within) 0.1532 0.0913 0.1108 0.0967 0.1591 T statistic=’ P value in brackets
***significant at 1% **significant at 5% *significant at 10%
The regressions presented in Table 10 show the impact of working capital management on the profitability of pharmaceutical companies in the European Union. As mentioned above, we used the within fixed effect estimator, which excludes the VARNOI variable as it does not vary over time.
Slim and Lean? The differing impact of the working capital components on the profitability of the pharmaceutical industry in the European Union
36
Regression model (1) includes the control variables and only the DIO explanatory variable. This model shows a significant, negative relationship between DIO and NOI which agrees with the value in Table 8 (Pearson Correlation), where DIO is the variable among the three components of working capital management most correlated with NOI. All the control variables are significant at the 5% level. Therefore, the behaviour of model (1) indicates that the increase of one day in the days inventories on-hand is associated with a 0,15% decrease in profitability. The R2 of 15,32% suggests this model and the following ones, has a limited
explanatory capacity.
Days sales outstanding is assessed by regression model (2). Its coefficient is negative (-.000023) but not significant, diverging from the main research carried out in this area, where the coefficient was very significant (negatively). One explanation for the different behaviour of the DSO variable may be the way payment policies are defined in this sector, since the main client in this industry is the State and public bodies, and so pharmaceutical companies could be obliged to wait long periods for payment to gain or hold on to their clients.
The DPO studied in regression (3) has the value of -.000978. The t test statistic has the value of -3,90, i.e., it is significant for a level of 1%. This negative relationship indicates that an increase of one day in days payable outstanding results in a decrease of almost 0,10% in the profitability of pharmaceutical companies. As in the other regression models, all the control variables are significant at 5%.
The Net Trade Cycle which is a measure of the efficiency of working capital management is included in model (4) but does not show explanatory power to model the operational profitability of firms in the pharmaceutical sector.
In regression model (5) which includes simultaneously DIO, DSO and DPO, DSO remains non-significant and DIO and DPO maintain the negative and non-significant relationship with NOI. These estimates suggest that an increase in DIO or DPO originates a decrease in NOI.
Among all the regression models associated with working capital management, model (2) and model (5) are the ones somewhat in contrast with the main research in this area, because despite model (2) presenting a negative coefficient for the DSO explanatory variable, this is not significant. In the case of model (5), the coefficient is once again non-significant although positive.
Observation of the five models confirms that size affects profitability positively as does the level of sales growth. On the other hand, the debt ratio represented by the DEBT variable has a negative influence on profitability in all models. This means that when the leverage effect in pharmaceutical companies increases, their profitability will be affected.
Slim and Lean? The differing impact of the working capital components on the profitability of the pharmaceutical industry in the European Union
37
6. Conclusions
This study researched the relationship between working capital management and profitability in 1515 firms in the pharmaceutical sector in the European Union observed between 2004 and 2011. That relationship was investigated using fixed effect regression models.
A significant negative relationship was found between profitability and days inventories on-hand and days payable outstanding. Those negative relationships indicate that a reduction in the number of days of inventories on-hand and the days payable outstanding will increase company profitability. These results show that, in the case of the pharmaceutical industry, it is wrong to state generically that a reduction of working capital is beneficial. In the first place, because it should not be carried out through extending the credit obtained, and secondly, because a reduction of credit granted to clients does not seem to bring significant gains. Therefore, it is not surprising that our results present a non-significant relationship (although negative) between Net Trade Cycle and profitability.
Our results suggest that pharmaceutical companies have greater potential gains if they concentrate their efforts on efficient inventory management. In a sector where safety stocks are critical and inevitable, strategies involving greater collaboration with sub-contractors upstream and wholesalers downstream can optimize stocks. Similarly, greater integration of the logistic chain, for example, improving techniques of forecasting demand, contributes to reducing inventory needs. Another strategy could be to concentrate on storing work-in-progress, reducing the need to accumulate multiple finished goods.
“Slim and lean”, at all cost, is not a good advice for the pharmaceutical industry as for people in general.
7. References
Baños-Caballero, S., García-Teruel, P. J., & Martínez-Solano, P. (2011). How does working capital management affect the profitability of Spanish SMEs? Small Business Economics,
39(2), 517–529. doi:10.1007/s11187-011-9317-8
Czyzewaki, A. B., & Hicks, D. W. (1992). Hold Onto Your Cash. Management Accounting, 73(9). Deloof, M. (2003). Does Working Capital Management Affect Profitability of Belgian Firms?
Journal of Business Finance and Accounting, 30(3-4), 573–588.
doi:10.1111/1468-5957.00008
Ernst&Young. (2012). Cash on prescription: Pharmaceutical companies and working capital management.
García-Teruel, P. J., & Martínez-Solano, P. (2007). Effects of working capital management on SME profitability. International Journal of Managerial Finance, 3(2), 164–177. doi:10.1108/17439130710738718
Slim and Lean? The differing impact of the working capital components on the profitability of the pharmaceutical industry in the European Union
38
Hsiao, C. (2003). Analysis of Panel Data (Second Edi.). The Press Sindicate of the Universoty of Cambridge.
Jose, M. L., Lancaster, C., & Stevens, J. L. (1996). Corporate Returns and Cash Conversaion Cycles. Journal of Economics and Finance, 20(1), 33–46.
Kennedy, P. (1992). A Guide to Econometrics.
Lazaridis, I., & Tryfonidis, D. (2006). “ The relationship between working capital management and profitability of listed companies in the Athens Stock Exchange ”. Journal of
Financial Management and Analysis, 30(2003), 1–12.
Neves, L. F. G. (2011). Working Capital Management and Profitability : The Telecom Case. PwC. (2012). Workinh capital: never been better. European Working Capital Annual Review. Rehn, E. (2012). Effects of Working Capital Management on Company Profitability Erik Rehn. Reuters. (2012). "Drugmakers could free $33 bln of working capital - analysts". Retrieved from
http://www.reuters.com/article/2012/09/11/pharmaceuticals-capital-idUSL5E8KBEA920120911
Shin, H., & Soenen, L. (1996). Efficiency of Worlcing Capitai i \/ ianagement and Corporate Profitabiiity. Financial Practice and Education, (Fall-Winter), 110–112.
Silva, S. M. da S. F. N. (2011). EFFECTS OF WORKING CAPITAL MANAGEMENT ON THE
PROFITABILITY OF PORTUGUESE MANUFACTURING FIRMS.
Soenen, L. A. (1993). Cash conversation cycle and corporate profitability. Journal of Cash
Management, 13(4), 53.
Valadas, J. C. M. (2005). THE IMPACT OF OPERATING CYCLE ON PROFITABILITY OF
PORTUGUESE COMPANIES - AN EMPIRICAL STUDY.
Wang, Y.-J. (2002). Liquidity management, operating performance, and corporate value: evidence from Japan and Taiwan. Journal of Multinational Financial Management, 12(2), 159–169. doi:10.1016/S1042-444X(01)00047-0