Osvaldo Augusto
Vasconcelos de Oliveira
Lopes da Silva
Student at the Postgraduation course in Development and Environment, Universidade Federal do Piauí (UFPI) – Teresina (PI), Brazil.
José Machado Moita Neto
Doctor in Chemistry, Universidade Estadual de Campinas. Professor at the Postgraduation course in Development and Environment, UFPI – Teresina (PI), Brazil.Marcos Antônio
Tavares Lira
Doctor in Development and Environment, UFPI. Assistant professor of the Electrical Engineering Course, UFPI – Teresina (PI), Brazil.
Correspondence address: Osvaldo Augusto Vasconcelos de Oliveira Lopes da Silva – Rua Antilhon Ribeiro Soares, 5000, Condomínio Like Teresina, Apartamento A-161 – Bairro Santa Isabel – CEP: 64053-070 – Teresina (PI), Brazil – E-mail: eng.osvaldo@live.com Received on: 03/05/2020 Accepted on: 05/18/2020
ABSTRACT
The expansion of Brazilian higher education institutions (HEIs) organized in multicampi structures brought a significant complexity to the academic and administrative management. In this context, environmental management strategies become quite relevant, especially when considering the low effectiveness of the Brazilian Labeling Program (BLP) for the classification of buildings in practice. The main objective of the present paper is to evaluate the BLP efficacy as applied to HEI buildings, aiming to develop a new environmental labeling model for multicampi HEIs. For this purpose, the BLP was applied to the labeling of Instituto Federal de Educação, Ciência e Tecnologia do Piauí (IFPI), employing data obtained from electricity bills between 2016 and 2018. The energy diagnosis was performed considering distinct indicators, performance indexes, levels and rankings of relative energy efficiency, from which energy efficiency labels could be developed. The results allow the verification of the low efficiency of the BLP, especially in the environmental labeling of HEIs. From the detailed analysis of bills, it is possible to develop environmental labels inspired by the BLP, resulting in a different approach. A novel type-II environmental labeling methodology is then introduced based on the breakdown of electricity bills and statistical methods.
Keywords: buildings; energy management; labeling.
RESUMO
A expansão das Instituições de Ensino Superior (IES) brasileiras organizadas em estruturas multicampi trouxe uma complexidade significativa à gestão acadêmica e administrativa. Nesse contexto, as estratégias de gestão ambiental tornam-se relevantes devido à baixa eficácia do Programa Brasileiro de Etiquetagem (PBE) na rotulagem de edificações. Assim, o principal objetivo deste trabalho foi avaliar a eficácia do PBE na etiquetagem de eficiência energética das edificações de IES e desenvolver um novo modelo de rotulagem ambiental para a eficiência energética de IES Multicampi. Para tanto, o PBE foi aplicado à etiquetagem do Instituto Federal de Educação, Ciência e Tecnologia do Piauí (IFIPI), empregando dados coletados nas faturas de energia nos anos de 2016 a 2018. O diagnóstico energético foi realizado considerando indicadores distintos, índices de desempenho, níveis e classificações de eficiência energética relativa, a partir dos quais as etiquetas de eficiência energética poderiam ser desenvolvidas. Os resultados permitem verificar a baixa eficiência do PBE, sobretudo na rotulagem ambiental da eficiência energética em IES. A partir das análises detalhadas das faturas, pode-se sintetizar rótulos ambientais inspirados no PBE, resultando em uma abordagem diferente. Uma nova metodologia de rotulagem ambiental tipo II é então introduzida, baseada na desagregação de faturas de energia e métodos estatísticos.
Palavras-chave: etiquetagem; gestão energética; edificações.
INSTITUTIONS AND A NOVEL ENVIRONMENTAL LABELING PROPOSAL
ANÁLISE DE EFICIÊNCIA ENERGÉTICA EM INSTITUIÇÕES DE ENSINO SUPERIOR
INTRODUCTION
In the 2030 Agenda published by the United Nations (UN) in September 2015, member countries were committed to 17 main sustainable development goals (SDGs) and 169 other goals to be pursued in the sub-sequent 15 years (UN, 2015b). The seventh SDG is defined in terms of accessible and clean energy poli-cies, aiming to provide universal access to energy, in-crease the share of renewable energies, double the global energy efficiency rate, as well as to strengthen international cooperation in research and technology transfer (UN, 2015a). In the context of electricity, the energy efficiency of residential, commercial, and pub-lic buildings becomes relevant, which also comprises higher education institutions (HEIs). This aspect is of major concern, especially because the consumption of electricity in buildings accounted for 42.6% of overall Brazilian consumption in 2018 (EPE, 2019, p. 40). Energy efficiency can then be regarded as a set of mea-sures aiming at the development of activities or prod-uct and service supply with low energy consumption (PÉREZ-LOMBARD; ORTIZ; VELÁZQUEZ, 2013).
The Brazilian higher education scenario has faced a sig-nificant geographical expansion since the 1960s, thus requiring improved academic and administrative man-agement policies to ensure good performance in terms of a multicampi structures (NEZ, 2016). This expansion has become more expressive in federal HEIs since 2007 with the introduction of the Support Program for Re-structuring and Expansion Plans of Brazilian Federal Universities (Programa de Apoio a Planos de Reestru-turação e Expansão das Universidades Federais — RE-UNI). This program counted with the participation of all federal institutions since its first year of implemen-tation, which led to a significant increase in the existing infrastructure (LIMA; MACHADO, 2016). Since the use of energy is the input with the highest environmental risk index (ERI) in HEIs (SENNA et al., 2014), it is import-ant to consolidate the environmental management taking into account energy efficiency policies (SILVA et al., 2016). This aspect is expected to allow HEIs to promote significant changes in social reality, not only with its core activity, but also with the proper applica-tion of management strategies to the buildings in order to consolidate them as sustainable educational spaces. According to distinct energy balance reports, e.g., the ones presented by the International Energy
Agen-cy (IEA, 2018) at the global level and by the Energy Research Company (EPE, 2019) at the national level, energy statistics are generally compiled and present-ed on a sectoral basis, where consumers are grouppresent-ed according to the economic activity, i.e., industry, transportation, services, agriculture, and residential consumers. However, the sector in which HEIs are in-serted is the most heterogeneous one. Although en-ergy consumption data for the whole sector are avail-able, specific reports for the subsectors are not easily found. In this context, the energy labeling becomes relevant as an environmental management instru-ment, which can be adopted as a benchmark strategy and encourage the continuous improvement of ener-gy management in HEIs.
According to the Brazilian Association of Technical Stan-dards (ABNT, 2002), environmental labels are state-ments that indicate the environmental performance of general-purpose products, or even products related to specific environmental aspects, among which the use of energy is included. Energy labels can be employed in the form of text, symbols, or graphic elements add-ed to packages, technical bulletins, or advertisement material to allow a fair comparison among products of the same type, aiming at promoting conscious con-sumption. Such labeling can also be classified in three categories: type I, which refers to third-party labeling, according to the fulfillment of specific requirements (ABNT, 2004); type II, which corresponds to environ-mental self-declarations presented by product and service suppliers without independent certification (ABNT, 2017); and type III, which refers to the labeling of products or services while presenting environmental information on the life cycle, also comprising several stages from the acquisition of raw material to their fi-nal disposal (ABNT, 2015).
The first milestone in environmental labeling was es-tablished in 1977, when Germany created the Blue An-gel label. Since then, similar strategies have been ad-opted in several countries worldwide, e.g., the Green Label in the United States of America (USA), the Eco-Mark label established in Japan in 1989, and the EU Ecolabel created by the European Union in 1998 (PRI-ETO-SANDOVAL et al., 2020). According to Spengler et al. (2020), the Blue Angel label is still in force and can be classified as type I. This label is applied to
dis-tinct products to reduce impacts during the utilization stage, whereas other stages of the product life cycle are covered to a lesser extent.
Figure 1 shows a timeline comprising regulatory frame-works that led to the current state of energy consump-tion labeling in Brazilian buildings. In order to develop a benchmarking strategy in Brazil, the Brazilian Labeling Program (PBE) was created in 1984. Under the supervi-sion of the National Institute of Metrology, Quality and Technology (Inmetro), which was created in 1973, and the Ministry of Mines and Energy (MME), this pro-gram is dedicated to provide consumers with informa-tion on energy efficiency of distinct products. Thus, it intends to encourage a more conscious purchasing pro-cess through the National Energy Conservation Label (ENCE), which can be classified into two types: volun-tary or compulsory certifications (EPE, 2020). The so-cial benefits of voluntary labeling increase proportion-ally with the market demand for certified products, the relevance of labeling issues, and the consumer ability to understand, trust, and interpret the provided infor-mation on the label. On the other hand, compulsory labeling is associated to several negative aspects, e.g., high social and production costs; extremely rigid pro-duction patterns; increase in size and complexity of the supply chain; sudden changes in production patterns
or techniques; and market distortions with reduced competition (ROE; TEISL; DEANS, 2014).
The BLP is supported by the National Electricity Con-servation Program (Programa Nacional de Conser-vação de Energia Elétrica – Procel), which was created in 1985 with the subprogram named Procel Seal (Selo Procel). This practice was instituted in 1993 to classi-fy distinct equipment according to a given efficiency index (ELETROBRAS, 2019). Therefore, the National Label for Energy Conservation (Etiqueta Nacional de Conservação de Energia – ENCE) is regarded as the certification provided by Inmetro to several products, whose energy efficiency performance can be classified according to proper levels. Procel Seal is then used to identify the best products in a given category according to a type-I environmental label, highlighted at the end of the timeline shown in Figure 1.
In addition to Procel Seal, Procel Energy Efficiency in Buildings (Procel Edifica) subprogram was created in 2003 for the development of activities that pro-mote the energy efficiency improvement in buildings. It is responsible for coordinating the Brazilian Building Labeling Program (BLP Edifica), which aims at the en-vironmental labeling of energy efficiency in Brazilian buildings (EPE, 2020). The creation of the Energy
ciency Program (EEP) for Electricity Distribution Com-panies (BRASIL, 2000) and the enactment of the Energy Efficiency Law (BRASIL, 2001) must also be highlighted. As from the introduction of this policy, electric energy distribution companies are expected to employ a min-imum percentage of the net operating revenue (NOR) for the development of energy efficiency programs and Procel. Besides that, it also represents an important source of funds for the program. On the other hand, the Energy Efficiency Law establishes the minimum en-ergy efficiency requirements for machines and devic-es powered by electricity, which are manufactured or marketed in the country, as well as a program of goals for improving this classification (BRASIL, 2001). It is di-rectly associated to the BLP and Procel, given that such mechanisms tend to encourage the acquisition of ener-gy-efficient products.
As a direct consequence of such policies, an energy saving of 21.2 billion kWh was reported in 2017, corre-sponding to an amount 39.89% greater than that of the previous year. It is also equivalent to 4.57% of the over-all electricity consumption in Brazil during 2017, as as-sociated with the annual consumption of 11.25 million households. This reduction accounts for the emission of 1.96 million tons of CO2 into the atmosphere, i.e., 675,000 cars over one year (ELETROBRAS, 2018). How-ever, in order to increase the effectiveness of the ener-gy efficiency policies, Nogueira et al. (2015) underline the need for marketing campaigns to inform the gener-al public about regulation benefits; constant review of efficiency limits; increase in the amount of regulated equipment; and increase in the number of equipment compulsorily withdrawn from the market due to low energy efficiency, similarly to what occurred with in-candescent lamps.
The BLP initiatives have contributed to the efficient use of energy in the country. However, this certification can also be applied to buildings in Brazil since 2009 with the ENCE within the scope of the BLP Edifica as a result of the interaction between the BLP and Procel Edifica. The Management Committees for Energy Efficiency In-dicators and Levels (Comitê Gestor de Indicadores de Eficiência Energética — CGIEE), which were established by the Energy Efficiency Law (BRASIL, 2001), joined the Technical Building Commission (CT-Edificações) to-gether with Inmetro in 2005, considering that it also established the regulatory frameworks of BPL Edifica.
The Technical Quality Requirements for the Energy Ef-ficiency Level of Commercial, Service, and Public Build-ings (RTQ-C) were published in 2009 and modified in 2010 (INMETRO, 2010). The Technical Quality Regula-tion for the Energy Efficiency Level of Residential Build-ings (RTQ-R) was also published in 2010. This regula-tion and its complementary documents were properly modified two years later (INMETRO, 2012).
The aforementioned regulations use engineering calcu-lations and computer simucalcu-lations from three individual building systems, i.e., envelope, air conditioning, and lighting to determine the energy performance of a part or the whole building during the design or conclusion stage of the facility. It considers a set of mandatory re-quirements, e.g., insulation of air conditioning system pipes, as well as bonus issues corresponding to photo-voltaic generation systems for supplying at least 10% of the overall energy consumption, for instance.
Borgstein, Lamberts and Hensen (2016) could identify 17 examples of energy performance classification sys-tems and projects in non-residential buildings in five countries (Brazil, the United States, the United King-dom, China, and Australia), among which BLP Edifica is included. In this study, the program was characterized as a labeling system with asset classifications, which are applicable to new buildings and major renovations based on prescriptive or simulation methods for a parison with national buildings. With a focus on com-paring the energy consumption of buildings, these as-sessment techniques are used to classify, tax, and rank the energy performance of buildings on a compulsory or voluntary basis. In most cases, it also aims to ensure good performance levels and reduction of energy con-sumption in buildings, in addition to providing a proper classification according to the type (simple labeling or benchmarking, for example), application, and bench-marking methodology.
There are several methodologies for assessing the en-ergy performance of buildings, which can assume sev-eral classifications based on the adopted techniques. According to Hong et al. (2013) and Burman et al. (2014), such strategies can be classified as top-down or bottom-up. In the first approach, the benchmarks are obtained based on the energy performance indi-ces of the building. The second one considers that the indices can be obtained from the theoretical analysis of a building. According to the control level of the
de-termination processes, Li, Han and Xu (2014) state that methodologies can be classified into white, gray, or black box type. In the first model, the techniques are purely statistical, with little information required for each building. In the second model, a limited physical analysis of the building is mixed with statistical meth-odologies. The last model relies strongly on the phys-ical structure of buildings and is highly dependent on input data provided by the user. The choice of a given methodology must be performed according to the ob-jective of the study, which is limited by the availability of data and cost-benefit ratio of data acquisition. Among the existing techniques, it is possible to identify and classify some of the most common methodologies for determining the energy performance of non-residential buildings: engineering calculations (bottom-up and white box) (FUCCI et al., 2016); statistical methods (top-down and gray or black box) (LI; TAO, 2017): simulations (bot-tom-up and gray or black box) (PLANAS; CUERVA; ALAVE-DRA, 2018); machine learning (top-down and black box) (CHENG et al., 2019); dynamic methods and real-time analysis (top-down and black box) (SCHIBUOLA; SCAR-PA; TAMBANI, 2018); load curve analysis and energy bill breakdown (top-down and black box) (NIEDERBERGER; CHAMPNISS, 2018); energy audit (bottom-up and white box) (MATHIOULAKIS et al., 2017); post-occupation, com-fort, and environmental quality analysis (bottom-up and gray or black box) (GHAHRAMANI et al., 2018). Accord-ing to the purpose of the study, the methodologies can be independent or complementary.
Public assessment systems for energy performance can be used in new and existing buildings for distinct purposes, which include mandatory compliance with minimum requirements; conception of policies to pe-nalize low energy performance, or reward good energy performance; mandatory or voluntary labeling of the energy performance of buildings; transparency and disclosure programs; voluntary internal benchmarking; and evaluation of improvement opportunities (BORG-STEIN; LAMBERTS; HENSEN, 2016). BLP Edifica is char-acterized as one of the systems, which is an important instrument to ensure the good energy efficiency per-formance of buildings in Brazil. However, there is the need for a simplified, more accurate and efficient mod-el for the labmod-eling process (MELO et al., 2012). Thus, for achieving the full implementation of this program, there is a need for developing methodologies to
cal-culate realistic values; creating awareness campaigns for the general public; providing training and support to increase the number of energy assessors; applying sanctions in case of non-compliance with the existing regulation; conducting post-certification monitoring and evaluation measures; establishing and maintaining a central recording system for collecting relevant certi-fication data (WONG; KRÜGER, 2017).
From the comparison of the Brazilian labeling model with those used by other countries, e.g., the United States and Portugal, it is clear that motivating the con-ception of zero energy consumption buildings, which are totally self-sufficient; informing CO2 emission re-ductions; expanding its coverage to the industrial sec-tor; and making certification mandatory is required (LOPES et al., 2016). It is also worth mentioning that labeling buildings is still voluntary in Brazil. However, compliance with ENCE became mandatory since June 2014 for purchasing or renting electric equipment and devices, as well as for new building projects for federal institutions, which are facilities subject to retrofit with federal public resources for the exercise of adminis-trative activity, or for the provision of public services (BRASIL, 2014). Therefore, federal public facilities can be regarded as any property built or adapted with fed-eral public resources for the exercise of administrative activity or for the provision of public services. Even with such mandatory requirements, BLP Edifica is ineffective in labeling the energy efficiency of buildings.
Six years after the program’s creation, considering a period until 2015, during which the expansion of federal institutes of education, science and technolo-gy occurred, only 84 commercial, public, and service buildings were labeled throughout the country in a few states, which do not include Piauí State, as stated by Silva et al. (2015) and Wong and Krüger (2017). In this context, the present study aims to provide answers to the following question: How is it possible to develop an energy efficiency label for compliance with environ-mental management in multicampi HEIs in a reliable and effective manner? The main hypothesis is that energy diagnosis may rely on the detailed analysis of electricity bills, as well as productivity indicators for the conception of energy efficiency indices and levels that can be summarized in environmental labels inspired by the BLP, which is a different methodology than that of standardized by Inmetro (2010). Therefore, a type-II
environmental labeling methodology is introduced in this paper, based on the breakdown of electricity bills, as well as top-down and gray box statistical methods. For this purpose, the general objective of this study consists in evaluating the effectiveness of the BLP
ap-plied to the energy efficiency labeling of HEI buildings for developing a new environmental labeling model especially dedicated to multicampi HEIs. IFPI, which is held by the Brazilian Federal Government, was chosen as the analyzed scenario (SILVA et al., 2018).
MATERIALS AND METHOD
Research started with the assessment of the BPL applied to HEIs. An extensive search was performed in Inmet-ro website (INMETRO, 2015) to identify and classify the ENCE regulations issued for buildings in Brazil, specifi-cally comprising HEIs. Then, a general characterization of IFPI was obtained based on the available bibliography and the institution website. Relevant documents such as the institutional development plan and management re-ports were used for the energy diagnosis.
According to the methodology used by Silva et al. (2016; 2018) and Silva et al. (2017), a census survey was
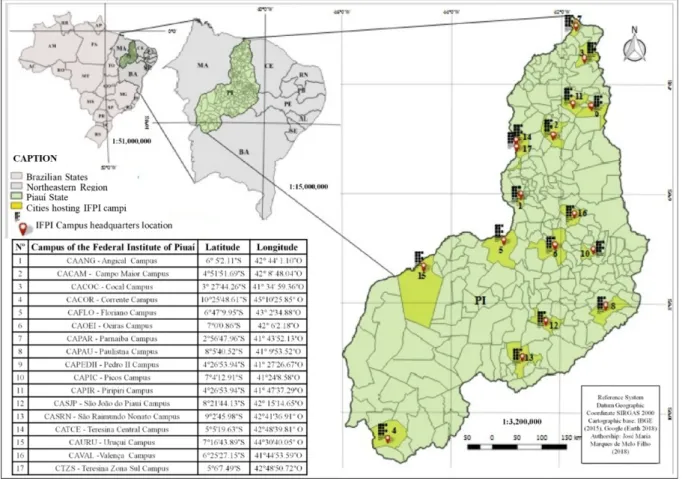
car-ried out and, considering the multicampi organizational structure, an extensive analysis of electricity bills of all campuses was developed for the period between 2016 and 2018. Created by the Brazilian Federal Government in 2008, in agreement with the Federal Law No. 11,892, IFPI (2014) aims to “be consolidated as a center of excel-lence in professional, scientific, and technological edu-cation, ranked among the best educational institutions in the Northeastern region”. It currently encompasses 17 campi and 19 energy consuming units, which are distributed over all regions of Piauí State, as shown in Figure 2. All campi are the subject of research, except
for advanced campi and the main administration build-ing, whereas the analysis considers indicators measured from 2016 to 2018.
With the breakdown of 684 electricity bills, a prelimi-nary energy diagnosis was performed while identifying three relevant aspects: manageable costs; avoidable loss and other issues; and proposal of strategies for the energy efficiency evaluation of HEIs. The breakdown of electricity bills is typically used in similar studies, which include those developed by Ketchman et al. (2018) and Niederberger and Champniss (2018). Partial results were then presented to the administration board of IPFI to establish a continuous flow of information in the subsequent months and enable the continuity of studies. In addition, based on the percent participation of cost centers in the total electricity bill, the indicator of avoidable loss (IndAL) was defined as the ratio be-tween manageable costs and the sum of costs associ-ated to avoidable loss.
In order to establish the energy efficiency labels for the campi, an environmental indicator matrix was com-piled using the pressure-state-response (PSR) frame-work (OECD, 2003) based on the pressure (energy use) and state (number of civil servants, infrastructure, and educational aspects) variables, just like recommended by Silva et al. (2018). Such variables were chosen based on the end activity of the institution and on the follow-ing qualitative and quantitative criteria: data reliability, relation with the addressed problem, usefulness to the user, data availability, relevance, redundancy, and mea-surability. Primary data associated with the indicators were used in all campi between 2016 and 2018 in a formal request forwarded to the administration board, in addition to secondary data collected from Nilo Peçanha Platform. This virtual environment is available to the IFPI community since 2017, containing official statistics from the Brazilian Federal Network for Pro-fessional, Scientific and Technological Education, which also comprises IFPI (BRASIL, 2019b).
From such data used for classifying the campi in dif-ferent scale categories, statistical software SPSS was employed to perform a multivariate analysis; and a dendrogram was plotted, which is a graph obtained with the cluster analysis to aggregate different ob-servations. The Euclidean distance was used as an evaluation criterion and the centroid of each cluster of observations was considered. The value of each
observation corresponds to the arithmetic mean of the values for the indicator considering 2017 as a ref-erence for all campi (MANLY, 2008). Besides that, in order to prevent a given variable from dominating the analysis, the data were previously normalized based on the difference between the minimum and maxi-mum values (KILKS, 2015).
According to the recommendation provided by Sil-va et al. (2018), the data envelopment analysis (DEA) (CHARNES; COOPER; RHODES, 1978) was employed with the analysis model (Charnes, Cooper and Rhodes — CCR or Banker, Charnes, and Cooper — BCC), which is based on the homogeneity of samples (CHARNES; COOPER; RHODES, 1978; BANKER; CHARNES; COOPER, 1984). Thus, new efficiency indices were determined: the gen-eral indicator of manageable costs (IndMC), which was obtained with the DEA using the BCC model; and the clustering IndMC, which resulted from the DEA based on the CCR model. In addition to this, given the num-ber of observations, the DEA golden rule, as defined by Banker et al. (1989), was applied to the third version of the Integrated Decision Support System (SIAD) (AN-GULO MEZA et al., 2005) software. This methodology was used by Blum and Okwelum (2018), Borgstein and Lamberts (2014), and Domingos et al. (2018) in the en-ergy efficiency evaluation based on DEA, aiming at the analysis of household appliances, buildings, and public policies, respectively.
From the aforementioned indicators, the general rel-ative energy efficiency index (REEI) was created and clustered using the arithmetic mean of IndAL and Ind-MC. By using such new data, the campi were classified according to five levels of relative energy efficiency with equal lengths, based on the difference between the highest and lowest indicators. A general ranking was then established in terms of energy performance while estimating the benchmarks for increasing energy efficiency. The main goal was defined as the elimina-tion of avoidable loss. The DEA models were then used to provide inputs and outputs for establishing energy consumption and demand benchmarks, and for teach-ing activities, as well as the best efficiency energy level, as observed in Figure 3.
According to the diagram shown in Figure 3, a new type-II environmental labeling model is proposed for energy efficiency evaluation, i.e., a self-decla-ration approach that is supposed to be employed
by the HEIs without independent certification while following general and specific requirements pro-vided by ABNT (2017). For this purpose, the mod-el standardized by BLP Edifica, i.e., the traditional paradigm, was used as a starting point. A new
en-ergy efficiency label was presented for each of the campus containing relevant information for the en-ergy efficiency analysis, such as indicators, indices, levels, rankings, and diagnostics aiming at a bench-marking strategy.
RESULTS AND DISCUSSION
From data provided by Inmetro (2015), it was possible to identify only 96 non-commercial buildings with the energy efficiency labeling in the scope of the BLP until June 10th, 2019, corresponding to 18 additional units when compared to the amount reported by Wong and Krüger (2017). The Southeastern and Northeastern re-gions stand out with the highest percentage of issued labels (50 and 24%, respectively), mainly in São Paulo and Bahia States, which were the states with the high-est number of ENCE certifications, i.e., 27.1 and 20.8%, respectively. A total of 12 other states with no ener-gy efficiency certification for non-residential buildings were also found, i.e., Acre, Alagoas, Amapá, Goiás, Maranhão, Paraíba, Pernambuco, Piauí, Rio Grande do Norte, Rondônia, Roraima, and Tocantins. From the percent analysis of each energy efficiency level applied to the buildings according to BLP Edifica, it was possi-ble to verify that most of the systems have good
per-formance. Moreover, the percentage of the assessed buildings ranged from 66 to 100%, as observed in Fig-ure 4. This variation is due to the possibility of provid-ing partial certifications to the buildprovid-ings. However, the envelope analysis was carried out in all buildings con-sidering that this is a mandatory requirement for ob-taining general or partial ENCE labels.
Only two HEI buildings received the ENCE label: the School of Architecture of Universidade Federal de Minas Gerais (UFMG) in November 2013; and the Uni-versity Restaurant of Universidade Federal de Santa Catarina (UFSC) in October 2012. The building enve-lope and lighting at UFMG were classified with energy efficiency levels C and B, respectively, which are con-sidered low. On the other hand, the building envelope at UFSC was classified with energy efficiency level A, the highest rank.
It is important to highlight that, even if more than one system is certified, only one ENCE certificate is issued. This result proves that even with the requirement of ENCE in federal HEIs (BRASIL, 2014), the BLP Edifica
is quite ineffective in the certification of buildings as evidenced by Silva et al. (2015) and Wong and Krüger (2017), mainly in the case of HEIs, which should be an example of sustainability to the entire community.
Table 1 – Electricity costs of IFPI between 2016 and 2018.
INPUTS 2016 2017 2018 Annual Average
R$ R$ R$ R$ %
Total bill R$ 4,330,125.85 R$ 4,624,818.04 R$ 5,921,169.26 R$ 4,958,704.38 100.00 Total manageable costs R$ 4,360,863.56 R$ 4,762,192.47 R$ 6,059,927.94 R$ 5,060,994.66 102.06
Demand R$ 708,753.53 R$ 648,530.82 R$ 779,652.78 R$ 712,312.38 14.36
Peak consumption R$ 1,279,736.25 R$ 1,650,506.04 R$ 2,099,384.28 R$ 1,676,542.19 33.81 Off-peak consumption R$ 2,289,969.22 R$ 2,348,814.02 R$ 3,045,944.65 R$ 2,561,575.96 51.66
COSIP R$ 82,404.56 R$ 114,341.58 R$ 134,946.23 R$ 110,564.12 2.23
Total avoidable losses R$ 266,582.22 R$ 170,546.17 R$ 259,057.56 R$ 232,061.98 4.69 Exceeding demand R$ 121,474.48 R$ 27,761.74 R$ 44,475.81 R$ 64,570.68 1.30 Exceeding reactive power R$ 69,234.70 R$ 76,354.14 R$ 102,183.25 R$ 82,590.70 1.67
Fine R$ 58,466.57 R$ 54,879.87 R$ 81,991.74 R$ 65,112.73 1.31
Default interest R$ 9,951.10 R$ 10,721.37 R$ 15,447.24 R$ 12,039.90 0.24
Monetary correction R$ 8,260.70 R$ 1,325.42 R$ 15,477.63 R$ 8,354.58 0.17
Other costs* -R$ 297,319.94 -R$ 307,920.60 -R$ 397,816.24 -R$ 334,352.26 -6.74
*Additional costs and eventual invoice discounts were not analyzed in the project.
Source: prepared by the author employing data from electricity bills between 2016 and 2018.
However, this study does not take into account the im-plications of the Energy Efficiency Law (BRASIL, 2001) and the mandatory purchase of products with energy efficiency level A (BRASIL, 2014), which may be the scope of future work.
Considering the multicampi organizational structure of IFPI, electricity costs were estimated based on the breakdown of electricity bills of all campi in 2016, 2017, and 2018, according to Table 1. An annual average val-ue of R$ 232,668.59 was determined, i.e., 4.68% of the total cost, which is higher than the amount spent indi-vidually on electricity by six of 17 campi, as shown in Figure 2 (CACAM, CACOC, CAPAU, CAPEDII, CASJP, and CAVAL). In this context, such loss should be promptly eliminated. The amount transferred to the local utili-ty in the form of fines due to delay in the payment of bills is equal to 37%; 35% corresponds to excessive con-sumption of reactive power, i.e., the amount of ener-gy supplied by the utility that does not result in useful work; and 28% is due to the higher energy consump-tion than the contracted demand.
Additionally, the annual average manageable costs of R$ 5,060,994.66 must be reduced with the proper ex-ecution of energy efficiency projects (EEPs), also com-prising environmental education strategies aiming to reduce energy consumption during the more expen-sive period, i.e., the peak hours between 5:30 p.m. and 8:30 p.m. (ANEEL, 2010). During this interval of only three hours, the amount spent on energy consumption corresponded to 33% of the overall cost. During the
three-year period under analysis, there has been a growing trend involving all components associated to manageable costs, as well as in all other components related to avoidable loss, except for the exceeding de-mand. This component faced a drastic decrease from 2016 to 2017, but it increased again from 2017 to 2018 according to Figure 5A, thus reflecting a specific action taken by the HEI administration board.
The preliminary analysis of energy supply contracts suggests that there was a reduction in the amount paid on the exceeding demand from 2016 to 2017, as a result of the review of the contract terms of all con-sumer units at the beginning of 2017. However, the increase in this cost in the subsequent year suggests that even though it is a concrete and efficient action, this was a one-off action that should be maintained to ensure good results. The increase in electricity costs also reflects the annual tariff adjustment, which var-ies significantly. Thus, the energy management, es-pecially in terms of energy efficiency, must consider the variation in consumption and demand of the facil-ities. However, the analysis in monetary terms is rele-vant due to the multidisciplinary nature of the study, which is a specific aspect of environmental sciences and involves the impact of costs on the management of organizations.
Breaking down electricity bills was also essential to calculate IndAL, which measures the percentage of avoidable loss in the amounts paid to the utility and corresponds to half of the weight of the REEI as
pro-Figure 5 – (A) Profiles of avoidable loss in all IFPI campi and (B) avoidable loss per campus between 2016 and 2018.Source: prepared by the author employing data from electricity bills between 2016 and 2018.
posed in the present study. The variation of IndAL in the IFPI campi from 2016 to 2018 is also shown in Fig-ure 5B, in which the green and red colors are used to represent units with improved and worsened perfor-mances from 2016 to 2018. It seems that even with the significant reduction of loss associated to the ex-ceeding demand, nine out of 17 campi presented the worst performance in terms of such indicator, thus suggesting the need for an improvement in the ener-gy management strategies of the HEI, especially with respect to electricity costs.
All the actions proposed to eliminate avoidable loss can provide average monthly savings of R$ 19,338.49. They should be considered in an economic analysis as prominent advantages of the proposed interventions, considering important aspects such as the on-time payment of invoices, installation of capacitor banks, and review of the electric energy supply contracts with the local utility. However, the manageable costs represent the largest portion of the electric energy expenses, i.e., almost 21 times higher than the cost of avoidable loss. This aspect requires the implemen-tation of an efficient energy management system. For this purpose, data for the elaboration of an indi-cator matrix, as defined by Silva et al. (2018) between
2016 and 2018, were used. From the previously nor-malized state indicators of 2017, a clustering analy-sis was performed, and two clusters could be formed based on the multivariate distance of the campi, thus denoting that they are all similar to each other, except for CATCE, as shown in Figure 2.
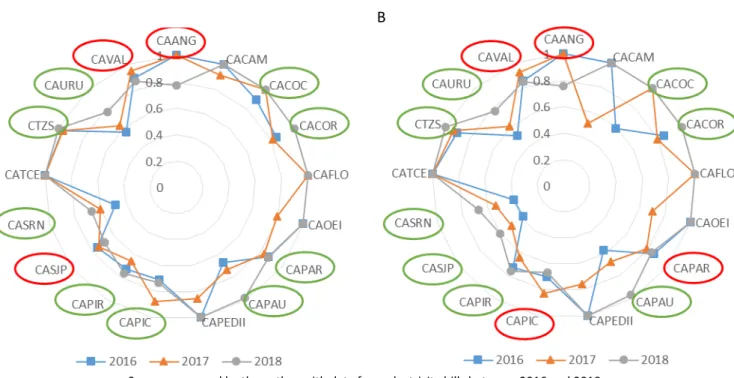
Thus, based on productivity concepts, it was possible to determine IndMC using the measurements relat-ed to energy use (inputs) and relat-education (outputs) in 2016, 2017, and 2018, according to Silva et al. (2018). Such data represent a measure of the demand rela-tive efficiency and use of acrela-tive power, which is as-sociated to the energy used to perform useful work. The DEA BCC model was used to determine the gen-eral IndMC, because this model considers different re-turns depending on the scale of the decision-making unit (DMU). On the other hand, the DEA CCR model was used to determine the clustering IndMC, because it considers constant returns regardless of the DMU scale. The annual variations of this indicator are pre-sented in general terms in Figure 6A and by clusters in Figure 6B, in which the green and red colors denote the campi with worsened and improved performanc-es from 2016 to 2018, rperformanc-espectively. Floriano Campus (CAFLO) could not be included in the analysis because
Figure 6 – Behavior of (A) general IndMC and (B) clustering IndMC in each IFPI campus between 2016 and 2018. Source: prepared by the author with data from electricity bills between 2016 and 2018,
also considering primary data provided by IFPI (2014) and Brasil (2019b).
its respective efficiency was not determined in 2016. The utility energy meter installed in the facility could not measure the peak and off-peak energy consump-tion separately, which are essential variables for cal-culating IndMC.
It is observed that there is no regular pattern in the variation of IndMC in the general or in the clustering analysis, given that it increased or decreased ran-domly in some campi. In addition, there are inconsis-tencies in the comparison between indicators due to the differences between the DEA BBC and DEA CCR models, which were used for determining the general IndMC and clustering IndMC, respectively. DEA BBC considers that the scale returns vary, but DEA CCR provides constant values to such quantities. Howev-er, the variations in the indicators related to energy use and education at Angical Campus (CAANG) from 2016 to 2018 can be highlighted, since the general IndMC and clustering IndMC varied -0.23 and -0.24, respectively. Variations of inputs and outputs were also found in Paulistana (CAPAU) and Cocal (CACOC) campi for the same period, with the highest increase in general IndMC and clustering IndMC corresponding to 0.31 and 0.40, respectively.
As previously discussed, the DMU with higher ef-ficiency consequently has the best productivity, being possible to define this concept as the ratio between outputs and inputs. Thus, when analyzing the variation of the IndMC in CAANG, which is the campus with the largest decrease, it is observed
that this indicator reflects the variation in produc-tivity. There was an increase in inputs in Figure 7A and a decrease in outputs in Figure 7B. Such aspects cause a decrease in productivity and efficiency. Considering the campi in which IndMC increased, the direct impact on the increased productivity and efficiency is noticeable.
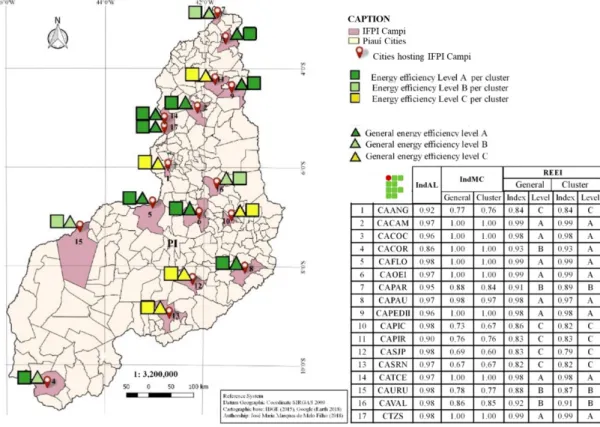
After calculating IndAL, general IndMC, and clus-tering IndMC, it was possible to determine the REEI in terms of general and clustering values using the arithmetic means of the aforementioned indicators for all campi from 2016 to 2018, except for CAFLO in 2016. In general, an increase in this indicator over the years for both representations can be noted due to the improvement of IndAL. However, the positive impact on this indicator is due to a one-off action, which should be maintained.
Analogously to the indicators that compose it, there was no defined pattern in the variation of the REEIs in IFPI, whereas some units presented improved or worsened performance in the clusters. The results are shown in Figure 8 for all campi in 2018. São Rai-mundo Nonato campus (CASRN) and CAFLO present the lowest and highest REEIs, respectively, which is also reflected by the existence of a grid-connect-ed photovoltaic system installgrid-connect-ed in CAFLO (MO-RAIS et al., 2019.
In order to achieve the maximum energy efficiency level in all campi, the maximum level is required for both IndAL and IndMC. The maximum performance
Figure 7 – Behavior of (A) energy indicators – inputs and (B) education indicators – outputs of CAANG between 2016 and 2018. Source: prepared by the author employing data from electricity bills between 2016 and 2018,
also considering primary data provided by IFPI (2014) and Brasil (2019b).
in the first indicator can be obtained only if avoidable loss is completely eliminated, which include import-ant actions, such as the on-time payment of bills, revi-sion of energy supply contracts, eventual installation of capacitor banks, and the consequent elimination of excessive reactive energy consumption. There are two possible solutions to maximize IndMC: reduc-tion in consumpreduc-tion and demand for active energy; or increase in the number of students. Both actions should be developed simultaneously. The goals for decreasing inputs and increasing outputs include the application of DEA to inputs and outputs of campi with low performance in this indicator, as stated by Silva et al. (2018). This action is supposed to bring additional benefits, such as the increase of monetary resources received by the HEI; reduction in the socio-environmental impacts related to the power system expansion; and establishment of a benchmark model for other HEIs in Brazil.
The campi with the lowest IndMC have more ambi-tious goals toward an efficient energy management
strategy. Considering environmental statements can be presented in different ways (ABNT, 2017), relative energy efficiency labels (REELs) were developed as shown in Figure 9. This approach can be regarded as a clear, transparent, sound, and documented type-II en-vironmental labeling proposal, which also comprises some essential characteristics to ensure the self-dec-laration reliability.
In addition to socioenvironmental benefits, the im-plementation of energy saving strategies also con-tributes to mitigating the impacts of contingency of funds. This scenario is currently faced by Bra-zilian HEIs, which have struggled to reduce oper-ating expenses in the last years (SANTOS, 2020). Thus, the composition of the proposed labels for the multicampi HEIs can be used as an important tool to develop benchmarking strategies and guide the actions toward the conception of an efficient energy management system, in terms of energy ef-ficiency indexes, levels and ranking, as well as en-ergy diagnosis.
CONCLUSION
Even without considering the implications of the Energy Ef-ficiency Law (BRASIL, 2001) and the mandatory purchase of products with the energy efficiency index class A (BRA-SIL, 2014), the survey carried out on the Inmetro website has proven the ineffectiveness of the BLP applied to the en-vironmental energy efficiency labeling of buildings in Brazil. This fact is especially true in the case of HEIs, since only two buildings were certified even after ten years of regulation. The energy diagnosis performed at the IFPI proves that the institution does not adopt an adequate energy
management strategy. It was found that 4.68% of the total amount paid to the local electricity company in 2016 to 2018 are due to loss, corresponding to a value higher than that paid for the electric energy consump-tion in six out of 17 campi in 2018.
The development of research activities in energy ef-ficiency can lead to positive impacts on the energy management in HEIs, which may include review of en-ergy supply contracts, for instance. However, if there is no continuous monitoring of energy consumption Figure 9 – Proposed energy efficiency environmental labeling for multicampi HEIs.
in terms of the adoption of an accurate energy man-agement system, sometimes these one-off actions may lead to poor results in the long term.
The breakdown of energy bills can be used in the ener-gy diagnosis of multicampi HEIs, thus allowing the iden-tification of cost centers, which include avoidable loss, manageable costs, among others. From the definition of an indicator of avoidable loss (IndAL), it was possible to determine the campi that have the highest and low-est contributions to the existing expenses. In addition, an environmental indicator matrix using the PSR model could be designed to characterize all campi, making it possible to cluster them with multivariate statistics and to define an indicator of manageable costs (IndMC) us-ing the general and clusterus-ing DEA.
Therefore, the matrix data can be used as inputs and products, such as in the form of education and ener-gy use indicators, respectively, aiming at an analysis of productivity and efficient energy use associated with the breakdown of electricity bills. This study resulted in IndAL, which was used to define the general REEI and clustering REEI. From such data, the traditional CCR and BCC DEA models could also be used to determine goals for reducing energy consumption and demand and or increase the education indicators in multicampi HEIs, considering that both actions should be carried out simultaneously.
By using benchmarking, this methodology can be em-ployed to rank the campi and monitor energy consump-tion in various measurement cycles, thus promoting the continuous improvement of this environmental aspect. In fact, this is the main objective of an energy manage-ment system, which may also contribute to the guide-lines provided by Agenda 2030. Such results can also be summarized in terms of a REEL, which is classified as a type-II environmental labeling approach applied to each campus. Therefore, this can be regarded as a top-down and black box methodology, which is simpler and more effective than that standardized by Inmetro, i.e., the tra-ditional paradigm. Besides that, the latter approach is sometimes limited given the high complexity, intersub-jectivity, and instability of the environment, which con-firms the main hypothesis investigated in this study. Research results are expected to lead to positive impacts on the environmental performance of HEIs. The promotion of awareness of the academic community to environmen-tal issues is also intended, considering that energy con-sumption is only one of many manageable environmental aspects. Within this context, the development of sustain-able spaces in HEIs is highly encouraged. The present study aims to motivate the development of similar studies in other institutions, and the proposed methodology can be used as a benchmark in the energy management of HEIs. Finally, given the flexibility of the introduced techniques, this strategy is expected to be applied to other multisite organizations and aggregate other environmental aspects.
REFERENCES
AGÊNCIA NACIONAL DE ENERGIA ELÉTRICA (ANEEL). Resolução nº 414, de 9 de setembro de 2010. Estabelece as Condições Gerais de Fornecimento de Energia Elétrica de forma atualizada e consolidada. Brasília: ANEEL, 2010 ANGULO MEZA, L.; BIONDI NETO, L.; SOARES DE MELLO, J.C.C.B.; GOMES, E.G. ISYDS: Integrated System for Decision Support (SIAD – Sistema Integrado de Apoio a Decisão): a software package for data envelopment analysis model. Pesquisa Operacional, v. 25, n. 3, 2005. http://dx.doi.org/10.1590/S0101-74382005000300011
ASSOCIAÇÃO BRASILEIRA DE NORMAS TÉCNICAS (ABNT). NBR ISO 14020: Rótulos e declarações ambientais – Princípios gerais. Rio de Janeiro: ABNT, 2002.
ASSOCIAÇÃO BRASILEIRA DE NORMAS TÉCNICAS (ABNT). NBR ISO 14021: Rótulos e declarações ambientais – Autodeclarações ambientais (rotulagem tipo II). Rio de Janeiro: ABNT, 2017.
ASSOCIAÇÃO BRASILEIRA DE NORMAS TÉCNICAS (ABNT). NBR ISO 14021: Rótulos e declarações ambientais – Rotulagem ambiental do tipo I – Princípios e procedimentos. Rio de Janeiro: ABNT, 2004.
ASSOCIAÇÃO BRASILEIRA DE NORMAS TÉCNICAS (ABNT). NBR ISO 14021: Rótulos e declarações ambientais – Rotulagem ambiental do tipo III – Princípios e procedimentos. Rio de Janeiro: ABNT, 2015.
BANKER, R.D.; CHARNES, A.; COOPER, W.W. Some models for estimating technical scale inefficiencies in data envelopment analysis. Management Science, v. 30, n. 9, p. 1078-1092, 1984. https://doi.org/10.1287/mnsc.30.9.1078 BANKER, R. D.; CHARNES, A.; COOPER, W. W.; SWARTS, J.; THOMAS, D. A. An introduction to data envelopment analysis with some of its models and their uses. Research in Governmental and Nonprofit Accounting, v. 5, p. 125-163, 1989. BLUM, H.; OKWELUM, E. Estimating an economic-efficient frontier for dishwasher consumer choice. Energy Efficiency, v. 11, n. 6, p. 1325-1340, 2018. https://doi.org/10.1007/s12053-018-9627-7
BORGSTEIN, H.E.; LAMBERTS, R. Developing energy consumption benchmarks for buildings: Bank branches in Brazil, Energy & Buildings, v. 82, p. 82-91, 2014. https://doi.org/10.1016/j.enbuild.2014.07.028
BORGSTEIN, E.H.; LAMBERTS, R.; HENSEN, J.L.M. Evaluating energy performance in non-domestic buildings: A review. Energy & Buildings, v. 128, p. 734-755, 2016. https://doi.org/10.1016/j.enbuild.2016.07.018
BRASIL. Governo Federal. Lei nº 9.991, de 24 de julho de 2000. Dispõe sobre realização de investimentos em pesquisa e desenvolvimento e em eficiência energética por parte das empresas concessionárias, permissionárias e autorizadas do setor de energia elétrica, e dá outras providências, Brasília, 2000.
BRASIL. Governo Federal. Lei nº 10.295, de 17 de outubro de 2001. Dispõe sobre a Política Nacional de Conservação e Uso Racional de Energia e dá outras providências. Brasília, 2001.
BRASIL. Ministério da Educação. Plataforma Nilo Peçanha. Available at: <https://www.plataformanilopecanha.org>. Accessed on: Aug. 7, 2019b.
BRASIL. Ministério de Estado do Planejamento, Orçamento e Gestão. Instrução Normativa nº 2, de 4 de junho de 2014. Dispõe sobre regras para a aquisição ou locação de máquinas e aparelhos consumidores de energia pela Administração Pública Federal direta, autárquica e fundacional, e uso da Etiqueta Nacional de Conservação de Energia (ENCE) nos projetos e respectivas edificações públicas federais novas ou que recebam retrofit. Brasília, 2014.
BURMAN, E.; HONG, S.; PATERSON, G.; KIMPIAN, J.; MUMOVIC, D. A comparative study of benchmarking approaches for non-domestic buildings: Part 2 – Bottom-up approach. International Journal of Sustainable Built Environment, v. 3, n. 2, p. 247-261, 2014. https://doi.org/10.1016/j.ijsbe.2014.12.001
CENTRAIS ELÉTRICAS BRASILEIRAS (ELETROBRAS). Procel Results Report 2018: base year 2017. Rio de Janeiro: ELETROBRAS, 2018.
CENTRAIS ELÉTRICAS BRASILEIRAS (ELETROBRAS). Selo Procel Edificações: Qual a diferença entre Selo Procel Edificações e Etiqueta PBE Edifica? Rio de Janeiro: ELETROBRAS, 2019. Available at: <http://www.procelinfo.com.br/main. asp?View={E85A0ACC-8C62-465D-9EBD-47FF3BAECDAE}#1>. Accessed on: 24 Oct., 2019.
CHARNES, A.; COOPER, W.W.; RHODES, E. Measuring the efficiency of decision-making units. European Journal of Operational Research, v. 2, n. 6, p. 429-444, 1978. https://doi.org/10.1016/0377-2217(78)90138-8
CHENG, X.; YANG, B.; HEDMAN, A.; OLOFSSON, T.; LI, H.; LI, H.; VAN GOOL, L. NIDL: A pilot study of contactless measurement of skin temperature for intelligent building. Energy & Buildings, v. 198, p. 340-352, 2019. https://doi. org/10.1016/j.enbuild.2019.06.007
DOMINGOS, D.; OLIVEIRA, E.; ANDRADE, E.; MACHADO, T.B.; PEREIRA, C.R.; HÜTHER, C.M. Avaliação do desempenho da gestão do Programa ICMS Verde na mesorregião metropolitana do estado do Rio de Janeiro. Revista Brasileira de Ciências Ambientais, v. 50, p. 149-161, 2018. https://doi.org/10.5327/Z2176-947820180396
EMPRESA DE PESQUISA ENERGÉTICA (EPE). Atlas da Eficiência Energética: Brasil 2019 – Relatório de Indicadores. Brasília: EPE, 2020. EMPRESA DE PESQUISA ENERGÉTICA (EPE). Brazilian Energy Balance. Brasília: EPE, 2019.
FUCCI, F.; PERONE, C.; LA FIANZA, G.; BRUNETTI, L.; GIAMETTA, F.; CATALANO, P. Study of a prototype of an advanced mechanical ventilation system with heat recovery integrated by heat pump. Energy and Buildings, v. 133, p. 111-121, 2016. https://doi.org/10.1016/j.enbuild.2016.09.038
GHAHRAMANI, A.; PANTELIC, J.; LINDBERG, C.; MEHL, M.; SRINIVASAN, K.; GILLIGAN, B.; ARENS, E. Learning occupants’ workplace interactions from wearable and stationary ambient sensing systems, Applied Energy, v. 230, p. 42-51, 2018. https://doi.org/10.1016/j.apenergy.2018.08.096
GOOGLE. Google Earth website. 2018. Available at: <http://earth.google.com/>. Accessed on: Sept. 13, 2018.
HONG, S.; PATERSON, G.; BURMAN, E.; STEADMAN, P.; MUMOVIC, D. A comparative study of benchmarking approaches for non-domestic buildings: Part 1 – Top-down approach. International Journal of Sustainable Built Environment, v. 2, n. 2, p. 119-130, 2013. https://doi.org/10.1016/j.ijsbe.2014.04.001
INSTITUTO BRASILEIRO DE GEOGRAFIA E ESTATÍSTICA (IBGE). Índice de organização: malhas territoriais. Brasília: IBGE, 2015. Available at: <ftp://geoftp.ibge.gov.br/organizacao_do_territorio/malhas_territoriais/malhas_municipais/ municipio_2015/>. Accessed on: Nov. 10, 2019.
INSTITUTO FEDERAL DE EDUCAÇÃO, CIÊNCIA E TECNOLOGIA (IFPI). PDI 2015-2019 – Plano de Desenvolvimento Institucional. Teresina: IFPI, 2014.
INSTITUTO NACIONAL DE METROLOGIA, QUALIDADE E TECNOLOGIA (INMETRO). Portaria nº 18, de 16 de janeiro de 2012: Aprova a revisão do Regulamento Técnico da Qualidade - RTQ para o Nível de Eficiência Energética de Edificações Residenciais. Rio de Janeiro: INMETRO, 2012.
INSTITUTO NACIONAL DE METROLOGIA, QUALIDADE E TECNOLOGIA (INMETRO). Portaria nº 372, de 17 de setembro de 2010: Aprova a revisão dos Requisitos Técnicos da Qualidade para o Nível de Eficiência Energética de Edifícios Comerciais, de Serviços e Públicos (RTQ). Rio de Janeiro: INMETRO, 2010.
INSTITUTO NACIONAL DE METROLOGIA, QUALIDADE E TECNOLOGIA (INMETRO). Tabela de Edificações Comerciais, de Serviço e Públicos. Rio de Janeiro: INMETRO, 2015. Available at: <http://www.inmetro.gov.br/consumidor/pbe/ tabelas-comerciais.pdf>. Accessed on: Aug. 7, 2019.
INTERNATIONAL ENERGY AGENCY (IEA). World Energy Outlook 2017. Paris: IEA, 2018.
KETCHMAN, K.J.; PARRISH, K.; KHANNA, V.; BILEC, M.M. Synergizing disparate component-level energy resources into a single whole building tool to support energy conservation action in small commercial buildings. Energy & Buildings, v. 176, p. 325-332, 2018. https://doi.org/10.1016/j.enbuild.2018.06.053
KILKS, S. Composite index for benchmarking local energy systems of Mediterranean port cities. Energy, v. 92, part 3, p. 622-638, 2015. https://doi.org/10.1016/j.energy.2015.06.093
LI, M.; TAO, W. Review of methodologies and polices for evaluation of energy efficiency in high energy-consuming industry. Applied Energy, v. 187, p. 203-215, 2017. https://doi.org/10.1016/j.apenergy.2016.11.039
LI, Z.; HAN, Y.; XU, P. Methods for benchmarking building energy consumption against its past or intended performance: An overview. Applied Energy, v. 124, p. 325-334, 2014. https://doi.org/10.1016/j.apenergy.2014.03.020
LIMA, E.E.; MACHADO, L.R.S. Reuni e Expansão Universitária na UFMG de 2008 a 2012. Educação & Realidade, v. 41, n. 2, p. 383-406, 2016. https://doi.org/10.1590/2175-623654765
LOPES, A.C.P.; OLIVEIRA FILHO, D.; ALTOE, L.; CARLO, J.C.; LIMA, B.B. Energy efficiency labeling program for buildings in Brazil compared to the United States’ and Portugal’s. Renewable and Sustainable Energy Reviews, v. 66, p. 207-219, 2016. https://doi.org/10.1016/j.rser.2016.07.033
MANLY, B.J.F. Métodos Estatísticos Multivariados: Uma introdução. 3ª ed. Porto Alegre: Bookman, 2008.
MATHIOULAKIS, E.; BABALIS, S.; KALOGIROU, S.; BELESSIOTIS, V. Energy labelling and ecodesign of solar thermal products: Opportunities, challenges and problematic implementation aspects. Renewable Energy, v. 101, p. 728-736, 2017. https://doi.org/10.1016/j.renene.2016.09.034
MELO, A.P.; CÓSTOLA, D.; LAMBERTS, R.; HENSEN, J.L.M. Assessing the accuracy of a simplified building energy simulation model using Bestest: The case study of Brazilian Regulation. Energy and Buildings, v. 45, p. 219-228, 2012. https://doi.org/10.1016/j.enbuild.2011.11.007
MORAIS, F. H. M.; BARBOSA, F. R.; MORAES, A. M. Technical-economic analysis of the first mini-generation photovoltaic system of Piauí, Brazil. IEEE Latin America Transactions, v. 17, n. 10. 2019. http://dx.doi.org/10.1109/tla.2019.8986449 NEZ, E. Os dilemas da Gestão de Universidades Multicampi no Brasil. Revista Gestão Universitária na América Latina, Florianópolis, v. 9, n. 2, p. 131-153, 2016. https://doi.org/10.5007/1983-4535.2016v9n2p131
NIEDERBERGER, A.A.; CHAMPNISS, G. Flip sides of the same coin? A simple efficiency score versus energy bill savings information to drive consumers to choose more energy-efficient products. Energy Efficiency, v. 11, n. 7, p. 1657-1671, 2018. https://doi.org/10.1007/s12053-017-9542-3
NOGUEIRA, L.A.H.; CARDOSO, R.B.; CAVALCANTI, C.Z.B.; LEONELLI, P. A evaluation of the energy impacts of the energy efficiency law in Brazil. Energy for Sustainable Development, v. 24, p. 58-69, 2015. https://doi.org/10.1016/j. esd.2014.12.002
ORGANIZATION FOR ECONOMIC CO-OPERATION AND DEVELOPMENT. Environmental Indicators Development, Measurement and Use. Paris: OECD, 2003.
PÉREZ-LOMBARD, L.; ORTIZ, J.; VELÁZQUEZ, D. Revisiting energy efficiency fundamentals. Energy Efficiency, v. 6, p. 239-254, 2013. https://doi.org/10.1007/s12053-012-9180-8
PLANAS, C.; CUERVA, E.; ALAVEDRA, P. Effects of the type of facade on the energy performance of office buildings representative of the city of Barcelona. Ain Shams Engineering Journal, v. 9, n. 4, p. 3325-3334, 2018. https://doi. org/10.1016/j.asej.2017.04.009
PRIETO-SANDOVAL, V.; MEJÍA-VILLA, A.; ORMAZABAL, M.; JACA, C. Challenges for ecolabeling growth: lessons from the EU Ecolabel in Spain. The International Journal of Life Cycle Assessment, v. 25, p. 856-867, 2020. https://doi. org/10.1007/s11367-019-01611-z
ROE, B.E.; TEISL, M.F.; DEANS, C.R. The Economics of Voluntary Versus Mandatory Labels. Annual Review of Resource Economics, v. 6, n. 1, p. 407-427, 2014. https://doi.org/10.1146/annurev-resource-100913-012439
SANTOS, C.R. Estratégias bioclimáticas de projetos para melhores desempenhos ambientais em universidades no sul baiano. Revista Brasileira de Ciências Ambientais (Online), v. 55, n. 1, p. 122-144, 2020. https://doi.org/10.5327/Z2176-947820200540 SCHIBUOLA, L.; SCARPA, M.; TAMBANI, C. CO2 based ventilation control in energy retrofit: An experimental assessment. Energy, v. 143, p. 606-614, 2018. https://doi.org/10.1016/j.energy.2017.11.050
SENNA, A.J.T.; ALVES, R.R.; SANTOS, N.R.Z.; COSTA, F.L. Determinação do índice de risco ambiental das instalações de uma unidade de uma instituição federal multicampi de ensino superior. Revista Eletrônica em Gestão, Educação e Tecnologia Digital, Santa Maria, v. 18, n. 1, p. 555-565, 2014. https://doi.org/10.5902/2236117012651
This is an open access article distributed under the terms of the Creative Commons license.
SILVA, O.A.V.O.L.; MOITA NETO, J.M.; LIRA, M.A.T. Análise envoltória de dados para a gestão energética em instituições de ensino superior multicampi. Revista Brasileira de Ciências Ambientais, n. 50, p. 78-96, 2018. https://doi.org/10.5327/ Z2176-947820180401
SILVA, O.A.V.O.L.; MORAIS, F.H.M.; LEITE, C.S.; CARDOSO, J.R.A.; SOUSA, W.V.C. Use of energy bills for energy management in multicampi universities. Espacios, (Caracas), v. 38, n. 12, p. 20, 2017.
SILVA, O.A.V.O.L.; SANTOS, F.F.P.; BARBOSA, F.R.; LEITE, C.S. Electricity use management based on international protocol: a proposal for UFPI, Brazil. Espacios, Caracas, v. 37, n. 11, p. 26, 2016.
SILVA, O.A.V.O.L.; SANTOS, F.F.P.; BARBOSA, F.R.; LEITE, C.S. Etiquetagem de edificações comerciais, públicas e de serviços: um retrato da (in)eficácia do programa no Piauí. Carta CEPRO, Teresina, v. 27, p. 43-54, 2015.
SPENGLER, L.; JEPSEN, D.; ZIMMERMANN, T.; WICHMANN, P. Product sustainability criteria in ecolabels: a complete analysis of the Blue Angel with focus on longevity and social criteria. The International Journal of Life Cycle Assessment, v. 25, p. 936-946, 2020. https://doi.org/10.1007/s11367-019-01642-6
UNITED NATIONS ORGANIZATION (UN). Plataforma Agenda 2030: Acelerando as transformações para a Agenda 2030 no Brasil. New York: ONU, 2015a. Available at: <http://www.agenda2030.com.br>. Accessed on: Apr. 24, 2018.
UNITED NATIONS ORGANIZATION (UN). Transforming our world: the 2030 Agenda for Sustainable Development. New York: ONU, 2015b.
WONG, I.L.; KRÜGER, E. Comparing energy efficiency labelling systems in the EU and Brazil: implications, challenges, barriers and opportunities. Energy Policy, v. 109, p. 310-323, 2017. https://doi.org/10.1016/j.enpol.2017.07.005