Vu Anh Tran
UMinho|20 12 July 2012 Vu Anh T ran Evaluation of diet ar y carbohydrate and rosmarinic acid on intestinal e
xpression of glucose transpor
ter
s and digestive enzymes
Evaluation of dietary carbohydrate and
rosmarinic acid on intestinal expression of
glucose transporters and digestive enzymes
Escola de Ciências
Dissertation Master
Master in Biotechnology and Bioentrepreneurship in
Medicinal and Aromatic Plant (MBBPAM)
Main Supervisor:
Prof. Doctor Cristina Pereira-Wilson
and Co-supervisor:
Prof. Doctor Cristovao
̃ Lima
Vu Anh Tran
July 2012
Evaluation of dietary carbohydrate and
rosmarinic acid on intestinal expression of
glucose transporters and digestive enzymes
INVESTIGAÇÃO, MEDIANTE DECLARAÇÃO ESCRITA DO INTERESSADO, QUE A TAL SE
COMPROMETE;
Universidade do Minho, ___/___/______
iii
I would like to express my deepest gratitude and appreciation to my supervisors, Prof. Cristina Pereira-Wilson and Prof. Cristovao Lima for assisting and suggesting significant advice to enhance my research, for inspiring the best in me to complete the route of my dissertation and most of all, for always understanding my situation.
I would like to thank to Prof. Simon Lee, Institution of Chinese Medicine Sciences, University of Macau, for his support in data and samples, in the cooperation with this project. I’m also very grateful to Prof. Alberto Dias, Director of MBBPAM course, for his supports during my 2 year studying in University of Minho, Portugal.
Of course I cannot forget to thank all lovely, friendly and kindly ladies in animal biology lab (Biology department, University of Minho), especially Dalila, Cristina, Carla and Alice, for everything you helped me during nearly one year in this my “second home”.
I wish to present my special thanks and affection to my parents, and my younger brother for your unconditional support and encouragement through all this lengthy period. Lastly, I would like to extend my warmest thanks to Erasmus Mundus Euro Asia program for approving and giving me an opportunity to experience the study life in Europe
v
The impact of dietary habits on human health is well known and diet plays a significant role in chronic and age related diseases. This study had the following objectives: (1) to characterize the effects of different types of dietary carbohydrate on the expression of the digestive enzyme sucrose-isomaltase (SI) and of the glucose transporters SGLT1 and GLUT2 (sodium dependent transporter and facilitated diffusion, respectively) in intestinal epithelial cells, and (2) describe the effects of the phytochemical agent RA on the modulation of these processes.
Carbohydrate digestion and absorption by the intestine determine the rise in glucose levels of the blood after a meal and in diabetic patients these processes are increased which contributes to the hyperglycemia that characterizes the disease. Other dietary constituents, namely phytochemicals, may have a beneficial effect in this scenario by decreasing carbohydrate digestion and/or intestinal glucose uptake. This study shows that when carbohydrates are removed from the diet there is a marked decrease in SI, SGLT1 and GLUT2 not only at the apical membrane of enterocytes but also in enterocyte whole cell homogenates. Upon reintroduction of diets rich in carbohydrate (glucose or amylopectin) for 7 or 14 days, there is a marked increase in the enterocyte expression of the three proteins. The effects are more pronounced in the glucose diet which suggests a decisive role for luminal glucose on the adaptive response to increasing dietary carbohydrates.
The phytochemical RA demonstrated to decrease the extent of the adaptive increase in the digestive enzyme as well as in the glucose transporters revealing its potential as a regulator of intestinal glucose absorption.
vii
Os efeitos da alimentação têm grande impacto sobre a saúde humana. Este trabalho tinha como objectivos (1) caracterizar os efeitos de diferentes fontes de hidratos de carbono na dieta de ratos sobre a expressão de enzimas digestivas e transportadores de glucose no epitélio intestinal (2) descrever os efeitos do agente fitoquímico RA na modulação destes processos. Como é sabido, a digestão e absorção de hidratos de carbono pelo intestino são processos que determinam a subida de glucose no plasma associado à dieta e podem, em doentes diabéticos por exemplo, estar aumentados o que agrava a hiperglicemia presente nestes doentes. Outros constituintes da dieta, nomeadamente agentes fitoquímicos, podem intervir beneficamente neste processo diminuindo a velocidade de digestão dos hidratos de carbono complexos e/ou eficiência do transporte de glucose para a circulação através de efeitos não só na actividade de enzimas digestivas mas também na expressão de transportadores de glucose na membrana apical de enterócitos. Assim, este estudo mostra que quando se retiram os hidratos de carbono da dieta de ratos previamente alimentados com uma dieta normal (contendo amido) os níveis da enzima sacarose-isomaltase e dos transportadores de glucose SGLT1 (sodium dependent glucose transporter 1) e do GLUT2 (difusão facilitada) baixam muito significativamente não só na membrana apical de enterócitos (BMM) como também nos extractos celulares totais de mucosa intestinal. Ao reintroduzir dietas isocalóricas ricas em hidratos de carbono de diferentes tipos – glucose ou amilopectina – por 7 ou 14 dias produzem adaptações ao nível da enzima e das proteínas transportadoras cuja expressão aumenta. Estes efeitos são mais pronunciados no caso da dieta com glucose (do que na dieta contendo amilopectina) o que indica um papel determinante da glucose lumenal livre na estimulaçãp destes mecanismos adaptativos. Os resultados confirmam ainda que a regulação do transporte da glucose e da sacarose-isomaltase parecem estar associados.
O agente fitoquímico testado (RA) demonstrou ter potencial para conter estas respostas adaptativas ao aumento de glucose livre no lúmen do intestino o que revela que poderá ser útil no controle da glicemia.
Este trabalho é o resultado de uma colaboração com o Doutor Simon Lee da Universidade de Macau, China.
ix ACKNOWLEDGMENT ... iii ABSTRACT...v RESUMO ... vii TABLE OF CONTENTS ... ix LIST OF FIGURES... xi
LIST OF TABLES... xii
CHAPTER 1: INTRODUCTION ...1
1.1. Glucose homeostasis... 1
1.2. The small intestine... 2
1.3. Carbohydrate digestion, absorption and glucose transporters (SGLT1, GLUT2)... 2
1.3.1. Carbohydrate digestion ... 2
1.3.2. Glucose transporters (SGLT1 & GLUT2)... 5
1.4. Sources of bioactive compounds from medicinal plants ... ...7
1.5. Rosmarinic acid...8
CHAPTER 2: MATERIALS AND METHODS...11
2.1. Chemicals and solutions... 11
2.1.1 Brush Border Membranes (BBM) isolation solutions ... 11
2.1.2. Western blot solution ... 11
2.2. Animal... 18
2.3. Methods... 19
2.3.1. Preparation of brush-border membrane vesicles (BBMV)... 19
2.3.2. Western blot... 23
2.3.3. Experimental design………...27
CHAPTER 3: RESULTS AND DISCUSSION...31
CHAPTER 4: CONCLUSION...39
xi
Figure 1. Cross section and small structure of small intestine ... 2
Figure 2. Sucrose-Isomaltase structure... 3
Figure 3. Regulation of apical GLUT2 in enterocytes by calcium and taste receptors. GLUT, glucose transporter; PKC, protein kinase; PLC, phospholipase C; SGLT, sodium-dependent glucose transporter; Cav1.3, nonclassical neuroendocrine L-type voltage-dependent calcium channel (George L.Kellet et al., 2008) ... 4
Figure 4. The secondary structure of SGLT1... 6
Figure 5. Secondary structure of GLUT2 (Kazuaki et al., 2005)... 6
Figure 6. Structure of rosmarinic acid (Toth J. et al., 2003) ... 8
Figure 7. Gel after being prepared. ... 24
Figure 8. Gels and running buffer inside an electrophoresis system. ... 25
Figure 9. Effects of diets and RA on SI level in jejunal BBM... 32
Figure 10. Effect of diets & Rosmarinic Acid (RA) on SI expression ... 33
Figure 11. Effect of diets & Rosmarinic Acid (RA) on SGLT1 expression ... 34
Figure 12. Effects of diets and RA on SGLT1 level in jejunal BBM... 34
Figure 13. Effect of diets & Rosmarinic Acid (RA) on GLUT2 expression... 36
xii
Table 1. RA’s occurrence in the plant kingdom ...8 Table 2. Diets’ composition...28
1 CHAPTER 1
INTRODUCTION
Diabetes is increasing worldwide mainly due to non-healthy diets and lifestyles and dietary habits. According to WHO:
-More than 346 million people worldwide have diabetes. -Type 2 accounts for around 90% of all diabetes worldwide.
-Diabetes is predicted to become the seventh leading cause of death in the world by the year 2030.
So, what is diabetes? It is an increase in glucose concentration in the blood (plasma glucose), as a result of either lacking insulin produced by the pancreatic beta cells (type 1) or the body’s ineffective response to insulin (type 2). While type 1 cannot be prevented, type 2 can be.
1.1. Glucose homeostasis
Glucose homeostasis is the result of the balanced action of two pancreatic hormones, insulin and glucagon, to maintain blood glucose concentration in the range of 3.9 to 5.6 mM. Intestinal glucose absorption, endogenous glucose production by the liver (gluconeogenesis) and glucose utilization by the tissues (glucose clearance) are responsible for glucose concentration in blood. Although insulin, which removes glucose, and glucagon, which produces glucose, are consider as main factors for glucose concentration regulation, there are several other enzymes, substrates, and transporters that help to regulate the plasma glucose levels also (Aronoff et al., 2004).
Recent studies on diabetes focus on the small intestine where the absorption of glucose occurs. This means that we can control the plasma glucose concentration within appropriate limits for diabetic patients by reducing the glucose absorption ability of the intestine. There are several methods to do that such as inhibiting the glycosidase enzymes’ activity (carbohydrate digestion), or decreasing the expression of glucose transporters (SGLT1, GLUT2), which help to deliver glucose from food through the brush border membrane (BBM) of intestinal epithelial cells – enterocytes to the blood, and enhancing the incretion hormones secretion, which increase the insulin response to glucose and thereby helping to bring down plasma glucose after meal (Avezdo Mariza F. et al., 2008).
2
1.2. The small intestine
The small intestine is not only a digestive organ but also the place where amino acids, sugar, fatty acid particles, vitamins, electrolytes and water are absorbed. In human beings, the small intestine is about 2.8m long (Rhoades & Pflanzer, 2003) while it is 100cm long in rat (Miller, 1971). It includes three sections: duodenum (small portion), jejunum and ileum (both have similar length).
Figure 1. Cross section and small structure of small intestine (http://www.daviddarling.info/encyclopedia/S/small_intestine.html)
1.3. Carbohydrate digestion, absorption and glucose transporters (SGLT1, GLUT2) 1.3.1. Carbohydrate digestion
Plants (rice, potato, wheat, etc…) are major supply sources of carbohydrates in the human diet. Their main composition is starch which can be digested to glucose by salivary and pancreatic amylases, as well as by disaccharides of the enterocyte brush border membrane (lactase, isomaltase, and maltase) (Rhoades & Pflanzer, 2003; Drozdowski & Thomson, 2006b).
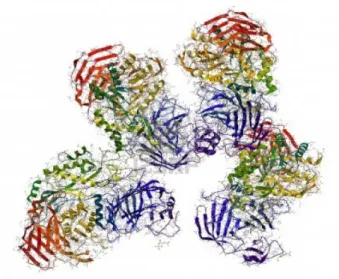
Sucrose-isomaltase (SI) is an apical membrane enzyme of small intestine, which is responsible for starch and sucrose digestion. SI, after being synthesized, is firstly attached to endoplasmic reticulum with N-glycosylation to become a high mannose precursor of 210kDa. Secondly, the precursor is terminal N- and O-glycosylated when moving to the Golgi apparatus. Finally, SI is translocated to the brush border membrane and is cut into sucrose and
3
isomaltase units by pancreatic proteases in order to digest starch and sucrose to simple sugars (Kazuki Mochizuki et al., 2010).
Figure 2. Sucrose-Isomaltase structure
(http://es.123rf.com/photo_12771469_sacarasa-isomaltasa-enzima-estructura-es-la-enzima-implicada-en-la-digestion-del-azucar.html)
Due to the importance of carbohydrate digestion and sugar absorption in small intestine, there are many studies on the effect of diets on the SI expression. According to Goda et al., 1994, a diet of high fat/carbohydrate ratio decreased sucrase, isomaltase and maltase activities, which also reduced the sucrase/isomaltase activity ratio (Goda et al., 1993). The cause of the decrease in SI activity ratio is explained by the change in glycosylation of SI, when it is synthesized from a single polypeptide, namely the reduction of unsialylated galactose from the glycosylated chain of the SI complex, (Kazuki et al., 2010).
Kazuhiro et al., 1999 demonstrated that fructose and sucrose diet (40% energy as fructose or sucrose) can enhance the transcription of SI and intestinal hexose transporters (SGLT1, GLUT5 and GLUT2) within short period of time (12h). On the other hand, the mRNA level of SI and GLUT5 couldn’t be enhanced by glucose or nonmetabolizable sugar (α-methyglucoside) within 12h. However, within a longer period of time (5 days), a high glucose diet could increase the SGLT1 and GLUT2 mRNA levels or both SI and SGLT1 transcription also were increased with a high-starch diet for 7 days. Researchers therefore suggested two mechanisms to explain gene expression of SI and intestinal hexose transporters due to the carbohydrate diets: the first one is a fast gene transcription stimulated by fructose
4
or sucrose (12h after meal) and the second one is generated by consumption of starch or glucose within long term period of time(≥5 days) (Kazuhiro et al., 1999).
1.3.1 Carbohydrate absorption
After being digested, these monosaccharides (glucose, fructose and galactose) are absorbed through the enterocytes (George L.Kellet et al., 2008; Figure 3).
Figure 3. Regulation of apical GLUT2 in enterocytes by calcium and taste receptors. GLUT, glucose transporter; PKC, protein kinase; PLC, phospholipase C; SGLT, sodium-dependent glucose transporter;
Cav1.3, nonclassical neuroendocrine L-type voltage-dependent calcium channel (George L.Kellet et al.,
2008)
The tight junctions help to join enterocytes together in order to sustain the polarity of enterocyte with a brush border membrane (or apical membrane) and a basolateral membrane. In addition, these junctions limit molecules to move from the lumen to the blood via a paracellular route (Woudstra & Thomson, 2002).
Specific glucose transporters (SGLT1, GLUT2) help glucose and other monosaccharides diffuse into cells since these molecules are hydrophilic and cannot go through the lipid bilayer by themselves. Besides glucose, galactose and fructose after being absorbed mostly will be converted to glucose in enterocytes (liver will be responsible for the remaining) for later storage or metabolism. (Wright et al., 2003).
5
In this study, we will focus mainly on two glucose transporters namely SGLT1 and GLUT2 so that firstly let’s have a look at them.
SGLT1, sodium-dependent glucose transporter, is the main transporter of glucose and
galactose from the lumen across the enterocytes. 2 Na+ ions and 260 molecules of water are
transported through the apical membrane along with the uptake of each glucose molecule (Wright et al., 2004). The majority of glucose after being absorbed into the enterocytes will be transported out of the cell by GLUT2, which is mainly located in the basolateral membrane of enterocytes. Besides the function as glucose transporters, GLUT2 can also transport galactose and fructose from the cytosol to the blood (Wright et al., 2003). In addition, GLUT5 facilitates the fructose transportation across the brush border membrane. These above things are based on the classical model of secondary active intestine glucose absorption. However, there are new evidences that GLUT2 also can play a role in apical glucose absorption like SGLT1, which means that GLUT2 can be translocated to the apical membrane (Figure 3).
1.3.2. Glucose transporters (SGLT1 & GLUT2)
SGLT1 (73 Da protein) is a member of the family of sodium dependent glucose
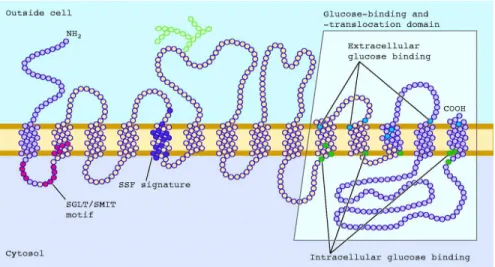
transporters, which is found abundantly in the apical brush border membrane of jejunum (it’s also located in ileum and duodenum but at lower levels) (Wright et al., 2007; Yoshida et al., 1995). Besides, SGLT1 can also be found in the cardiomyocytes (heart), luminal membrane of intracerebral capillary endothelial cells (brain) and the apical membrane of renal tubule cells (kidneys) (Bouche et al., 2004; Wright, 2001; Zhou et al., 2003; Elfeber et al., 2004). The secondary structure of SGLT1 is a 14 transmembrane α-helice with extracellular N and C terminus (Figure 4). It also has two phosphorylation site (between 6 & 7, 8 & 9 transmembrane helices) and one glycosylation site (between 5 & 6 transmembrane helices) (Wright, 1998). SGLT1 can also be divided into two regions, according to their function. The first, called the N-terminal region (from helices 1-9), plays a role in locating of SGLT1 and
binding Na+ whereas the second region, called the C-terminal region (from helices 10-14) is
responsible for sugar binding and transport (Wright et al., 2004; Panayotova-Heiermann et al., 1997; Suzuki et al., 2001).
Glucose and galactose can be transported into the cell against their concentration
gradients by SGLT1 due to the electrochemical gradient of Na+ (Bouche et al., 2004; Wright
et al., 2007). In addition, SGLT1 is also considered as a water and urea channel (Wright et al., 2002).
6
Figure 4. The secondary structure of SGLT1
(http://physiologyonline.physiology.org/content/19/6/370/F1.expansion.html).
Another important glucose transporter is GLUT2 (52-60 kDa in molecular weight), which is found mostly in the basolateral membrane of jejunum of the small intestine, liver, kidney and pancreatic β-cells (Hogan et al., 1991; Bouche et al., 2004). According to Figure
5, the secondary structure of GLUT2 consists of 12 transmembrane helices with intrancellular
N and C terminus and a larger intracellular loop, which connects 6th & 7th helice (Bouche et
al., 2004)
7
According to the classical model of glucose absorption, GLUT2 is considered to present only in the basolateral membrane. However, some recent studies showed that GLUT2 can be translocated to the brush border membrane in normal rats with high sugar meal.
GLUT2 can be a permanent resident of brush border membrane due to fructose and fat diet in type 2 diabetic experimental rats, which will enhance the absorption of sugar. (George L.Kellett et al., 2008). According to Oliver J.Mace et al., 2007, GLUT2 translocated rapidly to the brush border membrane due to high concentration of glucose in small intestine (30-200 mM) but low glucose concentration (≤20 mM) did not produce any effects in GLUT2 translocation. However, at low glucose concentration with the present of artificial sweeteners (1-2 mM), GLUT2 can also be trafficked to apical membrane. Sucralose, acesulfame potassium and saccharin (3 common artificial sweeteners) increase the level of apical GLUT2 (Oliver J.Mace et al., 2007).
1.4. Sources of bioactive compounds from medicinal plants
Using traditional medicinal plants as an antidiabetic therapy has been recorded long before the use of insulin in 1922 (Day, 1998). However, until now, scientists can’t find any natural source of insulin from plant to apply for T1DM patients. On the other hand, for T2DM, since insulin treatment is not the ideal approach, alternative medicines from herbs might be considered as good complementary treatment (Avezdo F. et al). For example, ginseng (Panax spp.), ivy gourd (Coccinia indicia), garlic and onion (Allium sativum and Allium cepa), holy basil (Ocimun sanctum), milk thistle (Silibum marianum), gurmar (Gymnena sylvestre), bitter melon (Momordica charantia), Aloe vera and Ginkgo biloba are considered as promising antidiabetic plants (Vuksan & Sievenpiper, 2005). Three mechanisms of these antidiabetic plants are the increase of glucose disposal-uptake by muscle and adipose tissues (e.g. ginseng, fenugreek, fig leaf, ivy gourd, bitter melon), the delay of glucose absorption in the gut (e.g. Aloe vera, ginseng, prickly pear cactus, fenugreek), and the glucose stimulated insulin secretion (e.g. ginseng, garlic, holy basil, bitter melon, gurmar) (Vuksan & Sievenpiper, 2005).
Since the hyperglycaemia results in production of more oxidative damage in cells, the antioxidant compounds from herbs (phenolic compounds, alkaloids, flavonoids and glycosides) may support their antidiabetic effects (Roberson & Harmon, 2006). Tanaka et al. also demonstrated in their studies with diabetic animals that antioxidants decrease diabetes progression.
8
1.5. Rosmarinic acid
Rosmarinic acid (RA), which is widely found in species of the Boraginaceae and the subfamily Nepetoideae of Lamiaceae, is an interesting biological compound. It can function as an antioxidant, ativiral, antibacterial and anti-inflammatory. RA’s chemical structure is an ester of caffeic acid and 3,4-dihydroxyphenyllactic acid (Figure 7)
Figure 6. Structure of rosmarinic acid (Toth J. et al., 2003) Rosmarinic acid has also been found from other plant families (Table 2)
Table 1. RA’s occurrence in the plant kingdom (Maike Petersen et al., 2002)
Previous studies showed that RA doesn’t exist long in the blood circulation (t=81
minute) and its toxicity is low (LD50 = 561mg/kg in mice) (Parnham and Kesselring, 1985).
Furthermore, RA is also applied in cancer treatment and cosmetic industry due to its anti-oxidant activity (D’Amelio, 1999). In addition, RA, which corresponds to 72% of the total phenolics in herb S.fruticosa, could play an important role in controlling the hypeglycaemic
9
since it decreased SGLT1 levels at the BBM as it decreased the level of heat shock protein-Hsp70, which has been reported to enhance the translocation of SGLT1 to the BBM (Mariza F.Azevedo et al., 2010).
In order to clarify the interrelation of SI and SGLT1 regulated in enterocytes by dietary carbohydrate, an experiment was performed with rats fed with glucose or amyplopectin. Glucose is readily absorbed in the intestine through BBM glucose transporters such as SGLT1 or GLUT2, and amylopectin needs to be digested by BBM enzymes such as SI in order for glucose to be released and absorbed. With the use of two diets above (glucose and amylopectin), we expect to see how independent is the upregulation of glucose transporters and SI in BBM of rats at 4 and 14 days after introduction of these diets to animals which were previously fed for 1 week on CH free diet (that helped to reduce the expression of SGLT1 and SI in BBM).
The effects of RA, previously demonstrated to reduce BBM SGLT1 expression in starch fed animals, is also tested in this study.
Total gene expression (SGLT1, GLUT2 and SI) in whole cell homogenates and the translocation to the BBM will be discussed with the parameters varying with diet, time and RA treatment.
11
CHAPTER 2
MATERIALS AND METHODS
2.1. Chemicals and solutions2.1.1 Brush Border Membranes (BBM) isolation solutions
Buffer 1: 1 l
100 mM manitol 18.22 g
2 mM Hepes/Tris, pH 7.1 0.477g Hepes (MHepes=238.5 g/mol)
(pH with 2M Tris)
Buffer 2: 500 ml
100 mM manitol 9.11 g
2 mM Hepes/Tris, pH 7.5 0.238 g Hepes (MHepes=238.5 g/mol)
0.1 mM MgSO4 0.5 ml stock MgSO4 100 mM
(pH with 2M Tris)
Buffer 3: 100 ml
300 mM manitol 5.466 g
20 mM Hepes/Tris, pH 7.5 0.477g Hepes (MHepes=238.5 g/mol)
0.1 mM MgSO4 0.1 ml stock MgSO4 100 mM
0.02% NaN3 0.2 ml stock 10% (w/v)
(pH with 2M Tris)
2.1.2. Western blot solution
2.1.2.1. Gel solutions
Resolving gel (*)
12 15ml (2 gels) 5% 8% 12% 10% 15% H2O UP 8,75ml 7.25ml 5,25ml 6,145ml 3,65ml 4x Tris-HCl/SDS, pH= 8,8 3,75ml 3.75ml 3.75ml 3,750ml 3.75ml 30% Acryl: 0,8%Bis 2,53ml 4.05ml 6ml 5ml 7,5ml 10% APS (100mg/ml) 75µl 75µl 75µl 75µl 75µl TEMED 30µl 30µl 30µl 30µl 30µl 7,5ml (1 gel) 5% 8% 12% 10% 15% H2O UP 4,375ml 3,625ml 2,625ml 3,073ml 1,825ml 4x Tris-HCl/SDS, pH= 8,8 1,875ml 1,875ml 1,875ml 1,875ml 1,875ml 30% Acryl: 0,8%Bis 1,265ml 2,025ml 3ml 2,500ml 3,75ml 10% APS (100mg/ml) 37,5µl 37,5µl 37,5µl 37,5µl 37,5µl TEMED 15µl 15µl 15µl 15µl 15µl
(*): Resolving gel used in this experiment is an 8% gel.
15 12-43
10 16-68
7.5 36-94
13 Stacking gel 30% Acrylamide/0,8% Bisacrylamide (USING MASK) 50ml 100ml 200ml Acrylamide (478) 14.6g 29.2g 58.4g Bisacrylamide (137) 0.4g 0.8g 1.6g
For 100ml: Add 29.2g de Acrylamide, 0.8g de N,N’-methylenebisacrylamide and H2O UP to
100ml. Filtrate a solution (filter 0.45µm) and keep a 4ºC, in dark.
4X Tris-HCl/SDS, pH 6.8 (0.5M Tris-HCl containing 0.4% SDS)
40ml 50ml 100ml
Tris base (128) 2,42g 3.025g 6.05g (pH=6.8 with HCl 6N) SDS (67) 0,16g 0.2g 0.4g
For 100ml: Dissolve 6.05g Tris base in 40ml H2O UP and adjust pH to 6.8 with 6N HCl, add
H2O UP to 100ml. Filtrate the solution (filter 0.45µm and syringe 20ml) and add 0.4g SDS.
Keep at 4ºC.
3,9% Acrylamide 1 Gel 2 Gels
H2O UP 3,05ml 6,1ml 4x Tris-HCl/SDS, pH= 6,8 1,25ml 2,5ml 30% Acryl: 0,8%Bis 650µl 1,3ml Bromophenol Blue 25µl (0.5%) 50µl (0.5%) ; 100µl (0,05%) 10% APS (100mg/ml) 25µl 50µl TEMED 20µl 40µl
14
4x Tris-HCl/SDS, pH 8.8 (1.5M Tris-HCl containing 0.4% SDS)
150ml 100ml 500ml
Tris base (128) 27.23g 18.15g 91g (pH=8.8 with HCl 6N)
SDS (67) 0.6g 0.4g 2g
For 100ml: Dissolve 18,15g Tris base in 60ml H2O UP and adjust pH to 8.8 with 6N HCl.
Filtrate the solution (filter 0.45µm e syringe 20ml) + 4ml SDS10X, add H2O UP until 100ml.
Keep at 4ºC.
10% APS (Ammonium Persulfate)
0,02g (20mg) APS (powder) + 200µl H2O UP
Bromophenol Blue (0.05% Bromophenol Blue in Tris-HCl 6.8)
5mg Bromophenol Blue + 10ml Tris-HCl 6.8 (adjust pH=6.8) 2.1.2.2. Buffers Towbin buffer 5X 5X 25mM Tris base 15.1g 192mM Glycine 72g H2O UP 1L
• Dissolve Tris base and Glycine in around 800ml H2O UP
• Add H2O UP until 1L
• Keep in 40C champer
Running buffer
400ml (for 2 gels)
Towbin buffer 5X 80ml
0.1% SDS 4ml (from the SDS 10% solution)
H2O UP 316ml
15
• Keep at 40C
Transfer buffer 5X (Semi-dry blotting)
1000ml 48mM Tris base 29.1g 39mM Glycine 14.65g 0.0375% SDS 1.875g H2O UP 1L Transfer buffer 150ml (1 gel) 300ml (2 gels) Transfer buffer 5X 30ml 60ml Absolute Metanol 7.5ml 15ml H2O UP 112.5ml 225ml TPBS (0.05% Tween20, PBS pH=7.4) PBS 10X 100ml H2O UP 900ml Tween20 500 µl Stripping buffer 250ml 62.5mM Tris-base 1.893g 2% SDS 5g 100mM 2-Mercaptoetanol 1.748ml
• Dissolve Tris base in 230ml H2O UP
• Adjust pH to 6.7 with HCl concentrated
• Add SDS and dissolve by gently stirring (to avoid making bubbles)
• Add H2O UP until 250ml and put all the solution in a bottle
16
• Keep the solution at room temperature in the hood
SDS Sample Buffer 2X (Laemmli sample buffer)
50ml
-0.125M Tris-HCl, pH 6.8 (stock 0.5M) 12.5ml
-20% Glycerol 12.6g (10ml)
-4% SDS (stock 10%) 20ml
-0,01% Bromophenol Blue (stock 0,5%) 1,0ml
-H2O UP 45ml
• Dissolve all the components in the solution
• Filtrate the solution with 0.22µm filter
• Make 900µl aliquots
• Keep at -200C
Before using, add 100µl DTT 1M in each 900µl aliquot. Reuse the solution remaining (keep at -200C) DTT 1M: 1ml H2O + 154.3mg DTT (40C, MW=154.3mg/ml) 2.1.2.3. Blocking solution 1 Membrane 2 Membranes TPBS 25ml 50ml 5% Skim milk 1.25 2.5g 2.1.2.4. Antibody solutions First Antibody 10ml 1% BSA 100mg
0.05% Sodium Azide (NaN3) 50µl (Stock 10%)
TPBS 10ml
17
* Volume varies depends on the 1st antibody prepared (see the manufacturer’s
recommendation)
Sodium Azide 10%: 1g azide + 10ml H2O UP
Secondary antibody (to be freshly made) 10ml
5% Skim milk 0.5g
TPBS 10ml
Secondary antibody 3µl*
*Volume can varies depends on the type of antibody used 2.1.2.5. Gel staining/distaining solutions
Gel staining solution
1000ml
0.1% Coomasive Blue 1ml
5% Ethanol 50ml
7% Methanol 70ml
H2O UP 879ml
-Immerse the gel in staining solution -Incubate at room temperature in 1h -The solution can be reused
Gel distaining solution
1000ml
25% Methanol 70ml
5% Acid Acetic 50ml
H2O UP 880ml
-Distain the gel during 30 minutes in the hood
18 Ethanol 95% 95ml ethanol Pure + 5ml H2O UP 76ml ethanol Pure + 5ml H2O UP SDS 10X 10g SDS (67) + 90ml H2O UP (Add H2O UP to 100ml) Membranas PVDF: 5,9 X 8,8 cm Papel Watman: 6,3 X 9,1 cm 2.2. Animal
100 small intestine samples collected from 10 groups of rat (10 samples/group). Experiment with 100 male rats with ~150g
Feeding regimes: HCD – normal rat chow
LCD – high protein, low carbohydrate diet (7days) HCD1 – high glucose diet (4 days and 15 days) HCD2 – high amylopectin diet (4 days and 15 days) (The different diets are isocaloric)
W – Tap water drinking
RA – rosmarinic acid in tap water drinking (~600ug/ml)
Groups of rats:
Group 1 (G1): 11 days on HCD/W diet
Group 2 (G2): ~7 days on HCD/W + 7 days on LCD/W
Group 3 (G3): 7d on HCD/W + 7d on LCD/W + 4 days on HCD1/W Group 4 (G4): 7d on HCD/W + 7d on LCD/W + 4 days on HCD1/RA Group 5 (G5): 7d on HCD/W + 7d on LCD/W + 4 days on HCD2/W Group 6 (G6): 7d on HCD/W + 7d on LCD/W + 4 days on HCD2/RA Group 7 (G7): 7d on HCD/W + 7d on LCD/W + 15 days on HCD1/W
19
Group 8 (G8): 7d on HCD/W + 7d on LCD/W + 15 days on HCD1/RA Group 9 (G9): 7d on HCD/W + 7d on LCD/W + 15 days on HCD2/W Group 10 (G10): 7d on HCD/W + 7d on LCD/W + 15 days on HCD2/RA
2.3. Methods
2.3.1. Preparation of brush-border membrane vesicles (BBMV)
This method can be used with fresh and frozen tissues.
All steps should be done at 4ºC 4ºC Room.
Procedure Notes
1. Place all the equipment in the 4ºC room some time in
advance to adapt to the correct temperature.
2. Place 50 ml of buffer 1 in the homogenizer container.
Take the sample (~2g) from the criotube (still frozen) and place in the 50 ml of buffer (wait about 2-3 min to defrost).
3. Homogenize (in the Waring Blender), at VLO, for 30 sec.
Wait about 1 – 2 min to slow down again the temperature of the system.
4. Homogenize again at VLO for 30 sec.
5. Filter the homogenate through a nylon filter (yellow) to
two 50 ml-tube (25 ml for each).
Take about 1 ml of crude homogenate (Hi)
Nylon yellow filters (0.45 µm)
Hi = total volume of 50 ml
Total volume: 2 x 50 ml = 100 ml diluted Hi
20
6. Add buffer 1 to each tube until 50 ml.
7. To each 50 ml-tube, add 200 µl of MgCl2 (2.5 M) to
obtain a final concentration of 10 mM MgCl2. Stir on ice
during 20 min. (3 in 3 minutes)
Meanwhile switch on the 50 ml-tube centrifuge for
cooling at 4ºC.
8. Centrifuge all tubes at 3,000 x g (Eppendorf Centrifuge
5804 R) for 10 min.
Meanwhile switch on the Avanti centrifuge for cooling
at 4ºC.
9. Reject the pellet and join supernatant from the same
sample in a 100 ml goblet. Divide sample for 3 tubes of Avanti centrifuge and centrifuge supernatant at 30,000 x g (15.749 rpm, JA25-50 rotor, Beckman Avanti J-25I) for 30 min.
(the divalent cations will crosslink with all
non-BBM membranes to
induce precipitation)
(At this point all
connective tissue,
intact-cells, debris, nuclei,
mitochondria, basolateral
and intracellular
membranes will collect in the pellet leaving BBM in the supernatant)
Be careful to correctly identify the goblet with the correct sample, and place on ice. Cover goblet with aluminium foil.
CALIBRATE VERY
WELL THE TUBES in a balance.
(centrifugation is to pellet the
21
10.Resuspend pellet of each tube with 10ml of buffer 2 (10 strokes – with a 5 ml syringe + a yellow tip). Join all the BBM from the same sample in one tube.
11.Centrifuge tubes at 30,000 x g (15.749 rpm, JA25-50 rotor, Beckman Avanti J-25I) for 45 min.
12.Resuspend pellet (BBM) in 1-2 ml of buffer 3 (first with a P1000 pipette and then passing through a 27 gauge needle at least six times).
Use a 1 ml or 2 ml syringe.
13. Make BBM granules in liquid nitrogen and keep it at -80ºC (for Western blot), or in liquid nitrogen (if it is to use in transport studies).
The second supernatant is discarded -contains only
soluble cytosolic proteins). Total volume: 3 x 11 ml = ~33 ml of diluted BBM CALIBRATE VERY
WELL THE TUBES in a balance.
(to “wash” BBM - to remove the last of the
MgCl2; BBM are
precipitated again)
(This procedure does not damage the membranes and helps to form the vesicles)
• Protein concentration
should be higher than ~5 – 7 mg/ml.
22
MATERIAL (for isolation of 2 samples - 2 rats)
2 boxes with ice
Waring Blender + Container 37-110 mL 1 50 mL graduated cylinder
1 forceps
4 50 mL-tube/rat 2 nylon filters P200 + tips
1 plastic Goblet for residues
2 glass Goblets >100mL + Aluminium foil 6 Avanti centrifuge tubes
P1000 + tips (for calibration of tubes in the balance) 2 5mL-syringe + 2 yellow tips
2 2mL-tubes
Container for liquid N2 to make BBM and Hi granules
Plastic spoon to recover BBM and Hi granules made in liquid N2 Criotubes to keep samples at -80ºC (Hi e BBMV)
Time counter
Liquid N2 + appropriate container Cleaning paper
Goblet to reject supernatant from centrifugation of BBM (to avoid pellet detachment when coming to the laboratory).
2.3.2. Determination of Protein (BRADFORD Method) Sample dilution:
Hi – dilute 1:2 or no dilution (20µl sample + 20µl buffer1 from protocol of BBMV isolation). BBMV – dilute 1:10 (4µl sample + 36µl buffer3 from protocol of BBMV isolation)
23
Make 2 Standard curves:
+ BSA 5mg/mL in buffer 1 to Hi + BSA 5mg/mL in buffer 3 to BBMV
Standards:
5mg/mL 3mg/mL 2mg/mL 1mg/mL 0.5mg/mL 0.25mg/mL
Pipette to a 96-well plate in the following order: Hi
-First:
5µl blank (buffer 1)
5µl standard (total of 6 standards in 6 wells)
5µl sample -Second:
250µl Bradford Reagent
Incubate 5-10 min, room temp.
BBM
-First
5µl blank (buffer 3)
5µl standard (total of 6 standards in 6 wells)
5µl sample -Second:
250µl Bradford Reagent
Incubate 5-10 min, room temp.
2.3.2. Western blot
2.3.2.1. Preparing the gel
-Resuspend all the necessary components (APS and TEMED should be added at the end) and pour quickly with p1000 into the two glasses.
24
-Immediately adding 95% ethanol on the top of the resolving gel and let it polymerize in 40
minutes. (Ethanol helps the gel avoid being contacted with O2, which inhibits the
polymerization).
-While waiting for the solidification of the gel, we can make the stacking gel (without adding APS and TEMED) and prepare the running buffer.
-After the first gel has solidified, pour out the ethanol and wash 2 times with H2O UP, then dry
with filter paper without touching the gel.
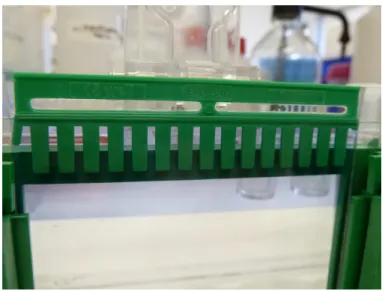
-Pour the stacking gel into the remaining empty space of the glasses, put the combs and wait for 15-20 minutes for the stacking gel gets solidified.
Figure 7. Gel after being prepared. 2.3.2.2. Electrophoresis
-Put the glasses with the gel into the electrophoresis system with the combs facing inward. -Pour the running buffer into the mini tank, fill the space between the gels and remove the bubbles.
25
Figure 8. Gels and running buffer inside an electrophoresis system.
-Cover and leave the tank with gel + buffer in 40C overnight or continue.
-Carefully remove the combs while the system is immersed in the running buffer and use p100 to wash the wells with running buffer.
-Prepare to run the samples treated with SDS in order to have the protein concentration around 20µg/µl.
-Load the wells (15 wells/gel) with the same volume:
+1st well: 5-10µl Molecular Marker All Blue Bio-Rad + 15-20µl SDS buffer
+ 13 next wells: 20-30µl samples (in order to have 20µg protein/well) + last well: SDS buffer
-Cover the tank and connect to the power:
+Run at 100V in 15 minutes to let the samples concentrate at the beginning of the separation gel.
+After that, run at 150V in 1 hour for separating the samples in the resolving gel. 2.3.2.3. Transfer – Semi dry blotting
-Prepare the transfer buffer: 300ml for 2 gels/ 150ml for 1 gel. (1)
-Incubate 3MM paper (2 papers/gel) in transfer buffer for 15 minutes with agitation. (2)
-Incubate the PVDF membrane, which was marked, hydrated 1 min in methanol, and washed 3X in water, in transfer buffer for 15 minutes with agitation. (3)
26
-After the electrophoresis running finished, remove the gel support and the stacking gel, make a mark on the opposite side to the marker on the resolving gel by cutting a square or a triangle; then place it in transfer buffer in 20 minutes with agitation.
*Note: (1), (2) and (3) should be prepared during 1 hour electrophoresis running. -Construct the sandwich in Trans-SD Blotting:
Cathode (top plate)
-Paper Watman 3MM (4) -Gel (3)
-PVDF Membrane (2) -Paper Watman 3MM (1) Anode (low plate)
Roll with the cylinder to remove bubbles. Dry the excess of liquid around the sandwich. The proteins with negatively charged due to the buffer will be transferred from the gel to the membrane in a cathode (-) to anode (+) direction.
-Place the lid, connect to the electric power and turning to 15V for 40 minutes (for gels 1.5mm) -After 40 minutes transferring, disconnect the equipment:
+Place the membranes in TPBS for 10 minutes, agitating 2X
+Place the gel in Coomassie for 20 minutes, then water and let it be agitated as long as you wish.
2.3.2.4. Marking with antibody – Immunodetection
-Remove the TPBS and incubate the membranes with blocking buffer in 1-2 hours at room
temperature with agitation, or leave overnight at 40C. This blocking step helps unoccupied sites
of the membrane be saturated and prevent the non-specific bindings of the antibodies.
-Remove the blocking solution and wash the membranes 3X with TPBS for 5-10-15 minutes.
-Incubate the membranes with primary antibody (*) at 40C overnight in the roller falcon.
-Take the membranes out of the primary antibody falcon (reusable) and wash 3X in TBPS for 5-10-15 minutes.
27
antibody can be anti-rabbit, anti-mouse or anti-goat…depends on the primary antibody) Note:
(*): primary antibodies used are SGLT1 (ab 14686, Abcam), GLUT2 (Anti-Glut2 Millipore, 07-1402) and SI (Sucrase isomaltase L-20, sc-27608, Santa Cruz).
(**): secondary antibodies used are Anti-rabbit IgG, HRP-linked Antibody, Cell Signaling, 7074 and Donkey anti-goat IgG-HRP: sc-2033, Santacruz.
2.3.2.5. Detection
-Turn on the PC and activate Program Quantaty One 4.6>File>ChemidocXRS (*)
-Prepare a solution Amersham ECL TM Kit or Millipore Western Blotting Detection Kit
1A:1B (40C) – Adding 400µl solution A + 400µl solution B (for one membrane) and mix well.
-Remove the membrane from the TPBS buffer and put it on a plastic; pour the solution prepared before onto the membrane and leave in 1 minute.
-Dry the membrane by dripping it on the absorbent paper then put it in a plastic membrane. Reveal the membrane inside the ChemidocXRS system.
-In the apparatus:
+UV filter (the tab)>button EpiWhite : for marker photo +Chemi filter>disconnect button EpiWhite: for bands photo -In the PC:
+(*)>select>cristovao membrane>zoom>freeze>auto expose: for marker photo
+select>chemidoc HS>Iris open>choose exposure time (first: 20 second)>manual expose -Photo saves: File>Save as and File>Export JPEG>Export
-Quantify bands: Open file you want to quantify>Volume button Quick Guide>Button 4th>circling bands>button 9th>vol Adj>done.
2.3.3. Experimental design
The animals were fed a regular rat chow for 1 week before being fast sampled and introduced of the low carbohydrate diet - LCH diet (see composition in Table 3). A week later, the animal were sampled again and assigned (10 per group) to 4 different treatments:
28
+High glucose diet (HGD)-rosmarinic acid (RA). +High amylopectin diet (HAD)-water (W).
+High amylopectin diet (HAD)-rosmarinic acid (RA).
Table 2. Diets’ composition
Diets Composition
LCH HGD HAD
Casein, %
Amylopectin corn starch, % Glucose, %
Cellulose powder (68% CF), % L-Cysteine, %
Minerals & trace elements, % Vitamin premix, % Choline Chloride, % Soybean oil, % 53,300 28,000 --- 6,000 0.500 6,000 1,000 0,200 5,000 20,500 --- 61,000 6,000 0,300 6,000 1,000 0,200 5,000 20,500 61,000 --- 5,000 0,300 6,000 1,000 0,200 6,000 Crude protein, % Crude fat, % Crude firbe, % Crude ash, % Starch, % Sugar, % (1) 47,3 5,2 4,1 5,7 28,0 0,8 18,3 5,1 4,1 5,3 --- 61,6 18,3 5,1 4,1 5,3 60,2 0,8 Energy (Atwater), MJ/kg kJ% Protein kJ% carbohydrate 15,3 52 35 15,8 19 69 15,8 20 68
29
kJ% Fat 13 12 12
Fatty acid, % of diets C14:0 C16:0 C18:0 C20:0 C16:1 C18:1 C18:2 n6 C18:3 n3 0,05 0,60 0,26 0,03 0,03 1,37 2,66 0,33 0,03 0,55 0,24 0,03 0,03 1,33 2,65 0,33 0,03 0,55 0,24 0,03 0,03 1,33 2,65 0,33
31
CHAPTER 3
RESULTS AND DISCUSSION
In this study, rats fed a normal diet for 7 days (NFD), were fed a low carbohydrate diet (LCH) for another 7 days in order to decrease enterocyte levels of sucrose-isomaltase (SI), sodium dependent glucose transporter 1 (SGLT1) and glucose transporter 2 (GLUT2), proteins involved in carbohydrate digestion and glucose absorption. After this, the animals were divided in groups and the diets changed to high glucose (HGD) or high amylopectin (HAD) with or without rosmarinic acid in the drinking water. Small intestinal mucosal samples were taken at 4 and 14 days.
After the 7 days on the low carbohydrate diet (LCD) decreases in protein levels of SI, SGLT1 and GLUT2 were observed. These results are in agreement with previous data reported by us and others (Azevedo et al., 2011).
Generally, upon the reintroduction of CH (as glucose or as amylopectin), we observed an increase in expression of SI, SGLT1 and GLUT2 in whole cell homogenates. However, for these proteins to play a role in carbohydrate digestion and absorption from the intestinal lumen, they need to be translocated to the brush border membrane (BBM) of enterocytes. Therefore, the data is presented as BBM levels and whole cell levels of each of the proteins. We interpreted increases in whole cell homogenate levels of the above proteins as the result of increase gene expression and the increase in BBM expression levels as a consequence of protein translocation from the cell’s cytosol to the apical membrane. The effects of diet (type of carbohydrate) will be discussed first and the modulation by RA will be presented last.
32
Effect of diets & Rosmarinic Acid (RA) on SI’s expression and translocation
Figure 9. Effects of diets and RA on SI level in jejunal BBM (♦) (♦) Legend:
d – Days
RA – Rosmarinic Acid
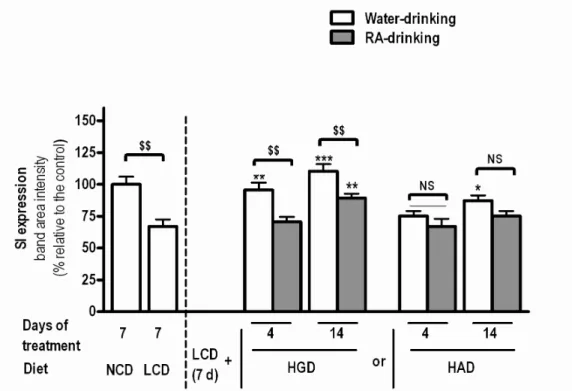
NCH – Normal Carbohydrate Diet LCH – Low Carbohydrate Diet HGD – High Glucose Diet HAD – High Amylopectin Diet Statistics (unpaired t-tests):
$ - P<0.05; $$ - P<0.01; $$$ - P<0.001 when compared with each other NS – Not significant (P>0.05) when compared with each other
* - P<0.05; ** - P<0.01; *** - P<0.001 when compared with LCD group
# - P<0.05; ## - P<0.01; ### - P<0.001 when compared with the respective treatment group for 4 days.
33
Relative the LCD, when either glucose or amylopectin were introduced in the diet there is an increase in SI at the BBM which is more significant in the glucose diet than in amylopectin diet (Figure 9). These results are interesting since amylopectin and not glucose is the substrate to this enzyme.
In the whole cell homogenates of HAD animals there is no increase in SI expression relative to the LCD animals at 4 days with a very small increase present at 14 days (Figure 10). Total SI expression levels in the glucose diet were similar to those in the NCD which indicates that in this group less than 4 days were needed to recover normal SI expression. From our data, it seems that free luminal glucose plays an important role in the induction of both translocation (Figure 9) and expression of SI (Figure 10).
Figure 10. Effect of diets & Rosmarinic Acid (RA) on SI expression in jejunal whole cell homogenates (♦)
34
Effect of diets & Rosmarinic Acid (RA) on SGLT1 expression and translocation
Figure 11. Effect of diets & Rosmarinic Acid (RA) on SGLT1 expression in jejunal whole cell homogenates (♦)
Figure 12. Effects of diets and RA on SGLT1 level in jejunal BBM (♦)
SGLT1 has been shown to increase in parallel with SI in response to increased CH in the diet. In whole cell homogenate, SGLT1 expression increased after the LCD with glucose but not amyplopectin. (Figure 11). However, BBM SGLT1 increased in both glucose and
35
amylopectin diet (Figure 12). This seems to indicate that the presence of glucose, even in low amounts (HAD) is responsible for the translocation of SGLT1 to the BBM, a process that does not require a de novo synthesis of SGLT1. When luminal glucose is high (HGD), in addition to a translocation effect, glucose seems to also have an effect on increasing SGLT1 gene expression.
36
Effect of diets & Rosmarinic Acid (RA) on GLUT2 expression and translocation
Figure 13. Effect of diets & Rosmarinic Acid (RA) on GLUT2 expression in jejunal whole cell homogenates (♦)
37
With regards to GLUT2, there seems not to be a consistent increase in gene expression after reintroduction of CH (Figure 13). However, there was a very significant effect of luminal glucose on GLUT2 translocation to the BBM, where it is usually present in very low amounts since it is a basolateral protein (Figure 14). This effect of glucose on GLUT2 translocation to the BBM has also been reported by Kellet et al., 2008.
Regarding RA’s effect in whole cell homogenate levels of SI and SGLT1, it decreased both SGLT1 and SI expression in HGD (but not HAD). When analyzing BBM levels of the protein, we found a significant decrease of SI in HAD animals and 14 day glucose fed animals (Figure 10). This effect seems to be similar to the one on BBM SGLT1 of HGD animals. However, in HAD animals, RA only decreased BBM SGLT1 level at 4 day (not 14 days like in SI’s case). RA had also already been shown to decrease BBM SGLT1 level in rat enterocytes (Azevedo et al., 2011). In that previous report, where a significant effect of RA was demonstrated already at 4 days, the animals had been fed a starch diet (which is composed by amylose and amylopectin), not a glucose diet. The effect of RA on starch and amylopectin fed animals seem to suggest that RA inhibits the digestive process to which SI contributes which is in agreement with SI data. In fact, RA significantly decreased SI BBM levels in HAD group (Figure 9).
In general, we can see that RA effects on BBM SGLT1 and SI levels follow the same pattern and could be explained by an inhibition of both SI and SGLT1 translocation.
In glucose fed animals, at 4 days, RA did not decrease either SGLT1 or SI in the BBM, although it decreased total protein levels (SI and SGLT1 whole cell homogenates). So, RA seems to be inhibiting the expression of these two genes but not translocation.
In case of RA effects on GLUT2, there was no effect on gene expression of GLUT2 (whole cell homogenate). However, in HGD fed animals, RA decreased BBM GLUT2 which may be the result of inhibition of GLUT2 translocation to the BBM. This effect of RA was not apparent in HAD fed animals where GLUT2 expression in BBM was not induced.
Our results show that:
-RA decreases BBM translocation of GLUT2 induced by high luminal glucose
-RA decreases SGLT1 gene expression rather than translocation to the BBM induced by high luminal glucose that is not prevented at 4 days. However at low luminal glucose (4 day
38
HAD), RA shows a inhibition in SGLT1 translocation to the BBM, but not gene expression inhibition.
-RA decreases SI gene expression and seems also to be effective preventing its BBM translocation.
39
CHAPTER 4
CONCLUSION
In conclusion, our study shows that HGD and HAD increase the level of BBM protein of SI and SGLT1 whereas only HGD seems to have an effect on increasing the gene expression of these protein in total homogenates. In addition, from our data, it is suggested that free luminal glucose at low amount (HAD) may responsible to enhance mainly the translocation of SI and SGLT1 whereas higher amount of luminal glucose may result in the increase in gene expression of these two protein.
GLUT2, on the other hand, just has the significant increase in translocation to the BBM due to the present of free luminal glucose. HGD and HAD did not affect consistently on the gene expression of GLUT2.
Rosmarinic acid has a down regulation effects to GLUT2, SGLT1, and SI.
The fact that diets (HGD, HAD) and RA affects to SGLT1 and SI in the same pattern, suggests that SGLT1 and SI expression is control by similar mechanism. Since we found no effect of RA on SGLT1 and SI BBM level at 4 day HGD fed animals , it is suggested that RA may interferes to some factors that control the transcription process of these two proteins. One of these factors can be “the binding of histone acetyl-transferase GCN5 and acetylation of histone H3/H4 on these genes” (Seiya Inoue, 2011). So that, we suggest doing further experiments to check whether RA helps decrease the binding of GCN5 and acetylation of histone H3/H4 on the transcription process of these two genes.
41
BIBLIOGRAPHY
Aronoff SL, Berkowitz K, Shreiner B & Want L, 2004. Glucose metabolism and regulation: beyond insulin and glucagon. Diabetes Spectrum 17, 183-190.
Avezdo Mariza F. et al., 2008. Evaluation of the antidiabetic efficacy and safety of medicinal plants of genus Salvia. Biology department, University of Minho, Portugal.
Azevedo Marisa F. et al., 2011. Rosmarinic acid, major phenolic constituent of Greek sage herbal tea, modulates rat intestinal SGLT1 levels with effects on blood glucose. Mol Nutr Food Res 55, 1-11.
Azevedo Mariza F. et al., 2010. Ursolic acid and luteolin-7-glucoside improve lipid profiles and increase liver glycogen content through glycogen synthase kinase-3. Phytother Res 24, S220-S224.
Bouche C et al., 2004. The cellular fate of glucose and its relevance in type 2 diabetes. Endocr Rev 25, 807-830.
Day C, 1998. Traditional plant treatments for diabetes mellitus: pharmaceutical foods. Br J Nutr 80, 5-6.
Drozdowski LA & Thomson AB, 2006b. Intestinal sugar transport. World Gastroenterol 12, 1657-1670.
Elfeber K et al., 2004. Localization of the Na+ - D-glucose cotransporter SGLT1 in the
blood-brain barrier. Histochem Cell Biol 121, 201-207.
F.S D’Amelio, 1999. Botanicals, a phytocosmetic desk reference. CRC press London, 361. George L.Kellet et al., 2008. Sugar absorption in the intestine: the role of GLUT2. Annual Rev.Nutr.28, 35-54.
Goda et al., 1994. Dietary carbohydrate and fat independently modulate disaccharidase activities in rat jejunum. American Institute of Nutrition.
Hogan A et al., 1991. Glucose transporter gene expression in early mouse embryos. Development 113, 363-372.
Kazuaki Ohtsubo et al., 2005. Dietary and genetic control of glucose transporter 2 glycosylation promotes insulin secretion in suppressing diabetes. Cell 123, 1307-1321.
42
Kazuhiro Kishi et al., 1999. Sucrase-isomaltase and hexose transporter gene expressions are coordinately enhanced by dietary fructose in rat jejunum. American society for nutritional sciences.
Kazuki Mochizuki et al., 2010. Feeding rats a high fat/carbohydrate ratio diet reduce jejunal S/I activity and unsialylated galactose on glycosylated chain of S-I complex. Life Sciences 86, 524-531.
Maike Petersen et al., 2003. Rosmarinic acid. Phytochemistry 62, 121-125.
Miller DL, 1971. Rat small intestine: development, composition and effects of perfusion. Am J Dig Dis 16, 246-254.
Oliver J.Mace et al., 2007. Sweet taste receptors in rat small intestine stimulate glucose absorption through apical GLUT2. J Physiol 582, 379-392.
Panayotova-Heiermann M et al., 1997. Five transmembrane helices form the sugar pathway
the Na+/glucose cotransporter. J Biol Chem 272, 20324-20327.
Parnham MJ and Kesselring K, 1985. Rosmarinic acid. Drugs of the future 10, 756-757
Rhoades & Pflanzer, 2003. Human physiology 4th ed. CA, US: Thomson Learning, Inc.
Brooks/Cole. Chapter 22: The gastrointestinal system.
Roberson RP & Harmon JS, 2006. Diabetes, glucose, and oxidative stress: A case of double jeopardy for the pancreatic islet beta cell. Free Radic Biol Med 41, 177-184.
Seiya Inoue et al., 2011. Jejunal induction of SI and SGLT1 genes in rats by high-starch/low-fat diet is associated with histone acetylation and binding of GCN5 on the genes. J Nutr Sci Vitaminol 57, 162-169.
Suzuki T et al., 2001. The apical localization of SGLT1 glucose transporter is determined by the short amino acid sequence in its N-terminal domain. Eur J Cell Biol 80, 765-774.
Toth J. et al., 2003. Rosmarinic acid-an important phenolic active compound of lemon balm (Melissa officinalis L.)
Vuksan V & Sievenpiper JL, 2005. Herbal remedies in the management of diabetes: lessons learned from the study of ginseng. Nutr Metab Cardiovasc Dis 15, 149-160.
Woudstra & Thomson AB, 2002. Nutrient absorption and intestinal adaptation with ageing. Best Pract Res Clin Gastroenterol 16, 155-162.
43
Wright EM et al., 1997. Regulation of Na+/glucose cotransporters. J Intern Med 200, 287-293.
Wright EM et al., 2002. Molecular basis for glucose-galactose malabsorption. Cell Biomed Biophys 36, 115-121
Wright EM et al., 2003. Intestinal absorption in health and disease – sugars. Best Pract Res Clin Gastroenterol 17, 943-956.
Wright EM et al., 2004. Surprising versatility of Na+-glucose cotransporters: SLC5.
Physiology (Bethesda) 19, 370-376.
Wright EM et al., 2007. Active sugar transport in health and disease. J Intern Med 261, 32-43. Wright EM, 1998. Glucose galactose malabsorption. AM J Physiol 275, G879-G882.
Yoshida A et al., 1995. Immunohistochemical localization of Na+-dependent glucose
transporter in the digestive tract. Histochem J 27, 420-426.
Zhou L et al., 2003. Human cardiomyocytes express high level of Na+/glucose cotransporter 1