M
ASTER OF
S
CIENCE IN
FINANCE
M
ASTERS
F
INAL
W
ORK
PROJECT
EQUITY RESEARCH
:
BHP
BILLITON
LTD
PEDRO
FILIPE
HENRIQUES
CAIRES
M
ASTER OF
S
CIENCE IN
FINANCE
M
ASTERS
F
INAL
W
ORK
PROJECT
EQUITY RESEARCH
:
BHP
BILLITON
LTD
PEDRO
FILIPE
HENRIQUES
CAIRES
S
UPERVISOR
:
VICTOR
MAURÍLIO
SILVA
BARROS
i
Abstract
This work aims to present a company valuation on BHP Billiton Ltd elaborated with
ISEG’s Finance Master Work Project. This Equity Research follows the format
recommended by the CFA Institute (Pinto, Henry, Robinson & Stowe, 2010)
We choose BHP Billiton Ltd because of its market presence, and the fact that is
recovering from a major accident in one of their subsidiaries. The author also had a
previous interest in the industry.
The equity research is issued considering all the publicly available information on the
company as of October 29
th, 2018. We use the Discounted Cash Flows method to
achieve our final target price.
The assumptions considered in the valuation result from a careful analysis of the
company’s data, industry main drivers and future market prospects. Our final
recommendation stands for HOLD, with a price target of $50.39/sh and an upside
potential of 11.26%, with medium risk.
Our recommendation is
supported by BHP’s expected higher production of
commodities which is offset by the market performance in the next years. It is expected
a slowdown in the prices of the commodities, from iron ore to coal. Even though, copper
and oil are expected to modestly increase, its impact it is not significant given the
company’s business structure.
A slowdown in the main importer of all commodities is expected – China. This country
is moving from a consumption economy to a services economy, impacting the market
for commodities. An overall decrease in the consumption of raw materials is expected
by this country.
JEL classification: G10; G32; G34.
Keywords: Equity Research; Valuation; Mergers & Acquisitions; BHP Billiton Ltd;
Mining Industry, China
Resumo
Este trabalho pretende apresentar uma avaliação da empresa BHP Billiton Ltd,
elaborado de acorde com o Projeto de Trabalho Final de Mestrado em Finanças no
ISEG. Esta avaliação segue o formato recomendado pelo CFA Institute (Pinto, Henry,
Robinson & Stowe, 2010)
A escolha da BHP Billiton Ltd foi feita devido à sua presença no mercado e ao fato de
estar a recuperar de um grande acidente numa das suas subsidiárias. O autor já tinha
interesse anterior na indústria.
Esta avaliação é emitida considerando toda a informação publicamente disponível a
29 de outubro de 2018. A principal metodologia usada utilizada para aferir o
preço-alvo é através dos Fluxos de Caixa Descontados (DCF)
Na avaliação consideramos várias premissas que resultaram de uma análise cuidada
dos dados históricos da empresa. A recomendação é de MANTER, com um
preço-alvo de $50.39 por ação e uma potencial valorização de 11.26%.
A nossa recomendação é suportada por uma superior produção esperada das
matérias primas da BHP, o que é contrastado por uma menor performance do
mercado nos anos vindouros. É esperada uma desaceleração nos preços das
matérias-primas, desde o minério de ferro até ao carvão. Apesar da modesta subida
dos preços do cobre e do petróleo, o impacto destas subidas não é muito significativo
na performance da empresa devido à sua estrutura de negócio.
Um decrescimento do maior importador de matérias-primas é esperado nos próximos
anos – China. A economia deste país está a se mover de uma economia de consumo,
para uma economia de serviços, o que impacta significativamente o mercado. Uma
redução generalizada no consumo de matérias-primas é esperada neste país.
Classificação JEL: G10; G32; G34.
Palavras-Chave: Equity Research; Avaliação de Empresas; Fusões e Aquisições;
BHP Billiton Ltd; Indústria Mineira, China
iii
Acknowledgements
This project represents of an important stage of my life, filled with much effort,
dedication and hard work. However, none of this would be possible without the support
of all the people that are close to me and my hear: my family, girlfriend, professors and
friends.
To my late grandfather Luís. For all the strength that he gave in my childhood and for
transmitting that strength through my grandmother, Nazaré after passing away.
To my dad José, my mom Dalila, my sister Sofia and my girlfriend Joana, for the
unconditional support, encouragement and valuable insights throughout my life that
made me achieve all my personal and professional goals.
To my colleagues and friends, for the friendship and good moments along this journey.
And last but not least, to my supervisor, Victor Barros, for the guidance, patience and
valuable insights that pushed myself to always do better and for the long hours spent
discussing and improving this project.
Index
Abstract
i
Resumo
ii
Acknowledgements
iii
Index
iv
List of Figures
v
List of Tables
vii
1.
Research Snapshot
1
2.
Business Description
2
3.
Management and Corporate Governance
5
4.
Industry Overview and Competitive Positioning
6
5.
Investment Summary
15
6.
Valuation
16
7.
Financial Analysis
21
8.
Investment Risks
22
Appendices
26
Appendix 1: Statement of Financial Position 26 Appendix 2: Income Statement 28 Appendix 3: Cash Flow Statement 30 Appendix 4: Key Financial Ratios 31 Appendix 5: Forecasting Assumptions 32 Appendix 6: Discounted Cash Flows Assumptions 38 Appendix 7: Discounted Cash Flows Analysis 40 Appendix 8:Dividend Discount Model Analysis 41 Appendix 9: Dividend Discount Model 42 Appendix 12: Multiples Comparables 43 Appendix 13: Corporate Governance 45
References
47
v
List of Figures
Figure 1 – Share Price
1
Figure 2 – EBIT estimations
1
Figure 3 – Employees and Contractors 2018YE
2
Figure 4 – BHP Segment Revenue 2018YE
2
Figure 5 – EBITDA Margin and Contribution 2017 YE
2
Figure 6 – Total copper production
3
Figure 7 – Shareholder Type
4
Figure 8 – Geographical Distribution of Shareholders
4
Figure 9 – World GDP Growth
6
Figure 10 – China and India GDP Growth
6
Figure 11 – Contribution to growth in China
6
Figure 12 – Contribution to growth in India
6
Figure 13 – United States GDP Growth
7
Figure 14 – Australia GDP Growth
7
Figure 15 – Euro Zone GDP Growth
7
Figure 16 – Inflation Rate Euro Zone
7
Figure 17 – Iron Ore Prices
8
Figure 18 – Production of Crude Steel (‘000 mt)
8
Figure 19 – Iron Ore Market Share 2017
8
Figure 20 – Manufacturing, Mining and Housing as a % of DGP - China
8
Figure 21 –World Demand vs Supply (‘000 mt)
8
Figure 22 – Copper Prices ($/mt)
9
Figure 23 – Copper Demand and Supply (‘000 mt)
9
Figure 24 – Copper Market Share
9
Figure 25 – Copper Demand by Region
9
Figure 26 – Copper Demand by Sector
9
Figure 27 – Energy Consumption 2017
10
Figure 28 – Coal Consumption
10
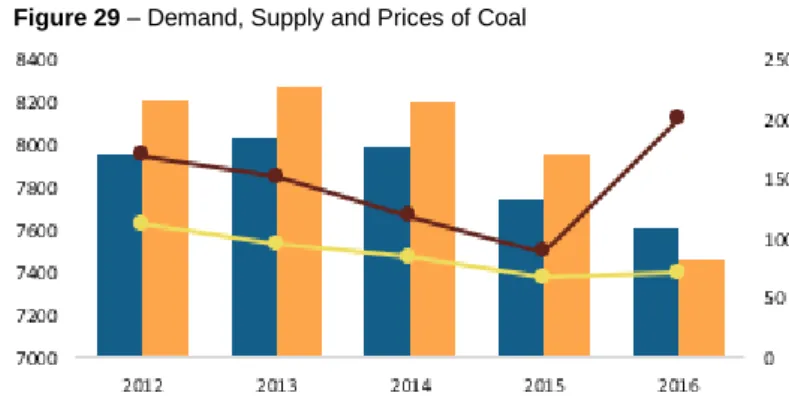
Figure 29 – Demand, Supply and Prices of Coal
10
Figure 30 – Proven Reserves of Coal
10
Figure 31 – Supply and Demand of Oil (‘000 barrels)
11
Figure 33 – Oil Consumption 2017
11
Figure 34 - Cost of a barrel of Oil as of April 9th, 2018
12
Figure 35 – Production of Gas
12
Figure 36 – Proven Gas Reserves
12
Figure 37 – Demand and Supply of Gas
12
Figure 38 – M&A Activity in the Petroleum Industry
13
Figure 39 – Interest Rate USD/AUD
13
Figure 40 – Interest Rate USD/CLP
13
Figure 41 – Freight Rates in the main routes
13
Figure 42 – Porter 5 forces
14
Figure 43 – Forecasted EBITDA ($Bn)
15
Figure 44 – Forecasted Debt and Net Debt ($Bn)
15
Figure 45 – Iron Ore Forecasted production (mm tons)*
16
Figure 46 – Copper Forecasted Production (mm tons)*
16
Figure 47 – Coal Forecasted Production (‘000 tons)*
17
Figure 48 – Petroleum Forecasted Production (mm boe)*
17
Figure 49 – Cost of Goods Sold ($Bn)
18
Figure 50 – Main Costs (Ex-COGS) ($Bn)
18
Figure 51 – Capex Breakdown
18
Figure 52 – Yearly D&A
18
Figure 53 – Dividend and Interim Dividend ($Bn)
20
Figure 54 – EBITDA, EBIT and Net Income Evolution
21
Figure 55 – Industry and BHP’s Return on Equity
21
Figure 56 – BHP’s Current, Quick and Cash Ratios
21
vii
List of Tables
Table 1 – Analysts Risk Assessment
1
Table 2 – Market Profile
1
Table 3 – BHP Sensitivity Analysis
1
Table 4 – Valuation Output
1
Table 5 – Shareholders Ownership
4
Table 6 – BHP Board of Directors
5
Table 7 – Executive leadership team
5
Table 8 – Oil Density and Sulphur content by Region
11
Table 9 – SWOT Analysis
14
Table 10 -Valuation Summary
15
Table 11 – WACC Assumptions
19
Table 12 – Sensitivity Analysis to Changes in Payout Ratio
19
Table 13 – BHP Peers
20
Table 14 – Sensitivity Analysis. Terminal Growth Rate and WACC
24
Table 15 – Sensitivity Analysis: Market Risk Premium and Beta
24
Source: Reuters, The Author
Source: The Author
Source: Thomson Reuters
Source: The Author, Company Data
Source: The Author, Company Data
*DCF considering all the cash from
Source: The Author, Company Data
Research Snapshot
(2019HYE Price Target of $50.39/sh; 11.26% Upside Potential; Medium Risk; Final Recommendation: HOLD)
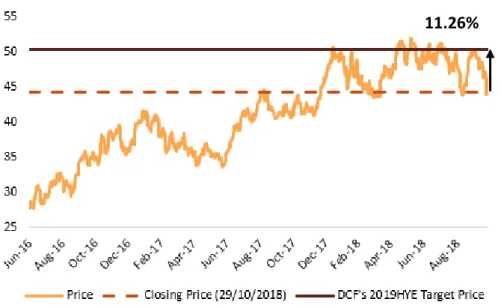
Figure 1 – Share Price
Our final recommendation for BHP Billiton Ltd stands for HOLD with a 2019HYE target price of $50.39 and an upside potential of 11.26% in comparison with last closing price on October 29th, 2018, although with
medium risk.
The target price is computed using the DCF approach as the main model. To corroborate this recommendation, we used to other methodologies – the DDM and the market approach.
Even though we expect an overall increase in BHP’s production, a general stagnation of the commodity markets will influence the company’s revenues. A decrease in the company’s main source of revenue (iron ore) is expected throughout the following years at a CAGR of -0.93%. In addition, a generalized stagnation is expected on the biggest market in the world for commodities – China. BHP is a mature company that we expect to remain in the market for long years having stable earnings, improving its efficiency in mining and exploration of new sources of income, but the commodities market is expected to slowdown and significantly affect the company’s overall performance.
EBIT is expected to decrease by $2.2Bn from 2019HYE to 2020HYE due to impacts on the Onshore US sale of assets. We anticipate an overall growth in the company’s production due to ongoing projects for maintenance and exploration. However, this is expected to yield less cash compared to other years. Revenue should increase, but it remains stable throughout our valuation period due to a slowdown in the commodities market, mainly driven by China’s expected GDP slowdown. BHP operates in a mature market with high barriers to entry, intense competition and low profit margins and the company wants to
BHP Billiton
HOLD
Medium Risk October 2019New York Stock Exchange
1.
4.19%
Table 1 – Analysts Risk Assessment
Table 2 – Market Profile
Figure 2 – EBIT estimations
Table 4 – Valuation Output Table 3 – BHP Sensitivity Analysis
2
B
usiness Description
BHP Billiton (BHP) was created in 2001 after the merger of BHP and Billiton. Together, they form a Dual Listed Company with BHP being traded in Australia and Billiton in The United Kingdom. Billiton has its origins in the Netherlands around 1860 and BHP began its operations in 1885, meaning that BHP Billiton has over 130 years of history. The headquarters of the company are in Melbourne, Australia and the company had in 2017YE more than sixty thousand employees and contractors all around the world. In addition, BHP Billiton is the World’s biggest mining company by market capitalization with over US$90 billion in 2017. BHP Billiton is quoted in 5 different markets: The London Stock Exchange, the New York Stock Exchange (as BHP and as BBL) (2 quotes because it was traded before the merger in 2001 by both companies on this market), the Australian Stock Exchange and the Johannesburg Stock Exchange.
BHP Billiton Limited is one of the world’s leading resources company with 420 subsidiaries and equity investments. The Company engages in the production of various commodities, including iron ore, metallurgical coal, copper and uranium, and its segments include Copper, Iron Ore, Petroleum and Coal.
The Iron Ore segment is the main source of revenue for the company, totaling 38.20% of revenues with over 230Mt produced in 2017YE. In addition, EBITDA margin was 62.07% and the segment contributed 44.72% to the company’s overall EBITDA. The Key drivers of this segment were the higher pig iron production in China and a preference for higher grade materials which increased iron ore prices. Seaborne supply also increased mainly from Brazil and Australia and a supply response was observed in price-sensitive origins, especially India. However, the market is under pressure in the short-term due to high inventory levels in China and the supply growth from both seaborne and domestic suppliers. In the medium, to long-term, it is expected that the committed projects will ramp-up production and a further flattening of the cost curve.
The Copper segment is responsible for 21.77% of company revenues and includes the mining of copper, silver, lead, zinc, gold, uranium and molybdenum. Moreover, this segment had an EBITDA margin of 42.53%, contributing 17.47% to the overall EBITDA. The Key drivers of profitability in this segment were stronger Chinese demand and increased mine disruption. In the short-term, it is expected that increased scrap availability and higher production due to ongoing projects will be adequate to cover growth in demand. In the long run, demand growth is expected to be solid with China transitioning to a consumption-based economy and emerging countries increasing demand.
2.
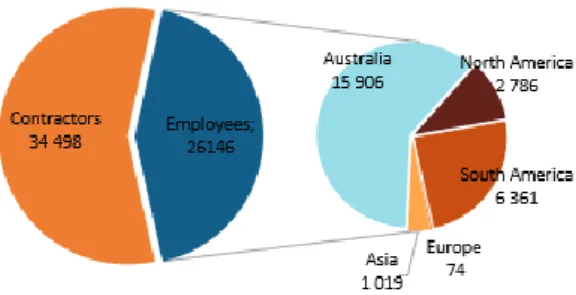
Figure 3 – Employees and Contractors 2018YE
Source: Company Data
Figure 4 – BHP Segment Revenue 2018YE
Source: Company Data
Figure 5 – EBITDA Margin and Contribution 2017 YE
The Coal segment accounts for 19.79% of the revenues and it engages in mining of metallurgical coal and thermal (energy) coal. Coal comprises 18.64% of the company’s EBITDA with a segment EBITDA of 49.93%. Key drivers on metallurgical coal were the constraints in Chinese supply and seaborne demand which increase its price. Although the price increased, it was followed by a decrease due to supply constraints easing. At the end of the year 2017, natural disasters increased prices and they are expected to return to marginal cost levels in the short run. In the long run, the outlook is uncertain because of China’s coal supply reform policy, but the emerging economies are expected to support seaborne metallurgical coal. In what concerns energy coal, its drivers are the Chinese seaborne robust growth demand and in the long run, India and South East Asian demand is expected to grow modestly, offsetting weaknesses in OECD countries.
The Petroleum segment represents 17.95% of the Company’s revenue and it is engaged in the exploration, development, and production of oil and gas. This segment EBITDA is 59.12% and it contributes with 20.02% to the company’s overall EBITDA.
The Company extracts and processes minerals, oil and gas from its production operations located primarily in Australia and the Americas. The company’s businesses include Minerals Australia, Minerals Americas, Petroleum and Marketing. The Company manages product distribution through its global logistics chain, including freight and pipeline transportation. Its businesses include Minerals Australia, Minerals Americas, Petroleum and Marketing.
In the Future, we expect that one of the company’s lowest mined commodity to become more prominent, lithium. Due to its durability, to the fact that is used for batteries, amongst others, its demand will increase, and the company might find a different source of revenue. This is also one of the reasons why we maintain a recommendation of HOLD. It is uncertain whether this market will growth to a point where it becomes significant in the company’s portfolio, even managing to substitute one of the other segments (for instance, petroleum), however it is due to the projected higher production on the other segments and to the exploration and ambition of new projects that we maintain our recommendation.
Company Strategies
Cost efficiencies – Focused on further gains: Since FY2012 BHP has reduced unit costs by 40%. To increase productivity the company aims to increase the connectivity across the assets and commodities along with a simple portfolio and standardized systems.
Latent Capacities – Attractive returns, limited risk: The company is
aiming to get more production or replace it, with the existent infrastructures at a lower cost, through optimizing opportunities existent in the mines, rigs, ports, rails and processing facilities.
Major projects – Timed for value and returns: Implement and develop
the “Mad Dog Phase 2” project which has the potential of production of 140 thousand gross barrels of crude oil per day. To further increase
Figure 6 – Total copper production
4
current mines is decreasing), the company wants to implement the “Spence Growth Option” project which is expected to have 185ktpa of incremental copper production in concentrate with the first production scheduled for 2021. At last, BHP is continuing to investigate the feasibility of one of the best undeveloped potash resources in the world through the “Jansen Potash” project in the province of Saskatchewan, Canada
Exploration – Positive results reduce the risk for future wells: Finding
new deposits of oil and copper through targeted exploration, because the production of these commodities is decreasing and its demand is forecasted to increase. There were recent positive drilling results in the US Gulf of Mexico for oil and in the Caribbean for Trion.
Technology – Improves safety, lowers cost and unlocks resource:
Continuity of the development and introduction of innovative technologies to increase efficiency and to improve safety. For instance, the diversified portfolio that the company has, allows the use of the same/adapted technology in different areas of business.
Shareholder Structure
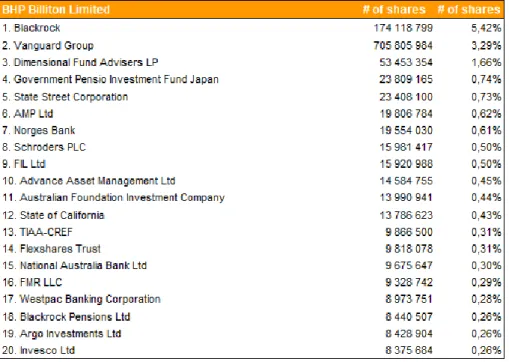
BHP Billiton Limited shareholder structure is divided into two main of investors, the corporate/institutional investors which hold 71% of BHP Billiton Ltd shares and private investors holding 29% of the company. The management team holds 739 566 shares as of 30 June 2017 of the company, which corresponds to around 0.2% of the total shares of the company. This means that the shares management holds do not compromise governance.
BHP Billiton Limited has one substantial shareholder that holds 5.42% of the shares of the company. A list of the twenty major shareholders is listed below.
Figure 7 – Shareholder Type
Source: Company Data & Bloomberg
Figure 8 – Geographical Distribution of Shareholders
Source: Company Data Table 5 – Shareholders Ownership
Management and Corporate Governance
The company follows an Anglo-American governance model composed by a Board of Directors in which the members of it constitute the four main committees: Risk & Audit Committee, Remuneration Committee, Nomination & Governance Committee and Sustainability Committee.
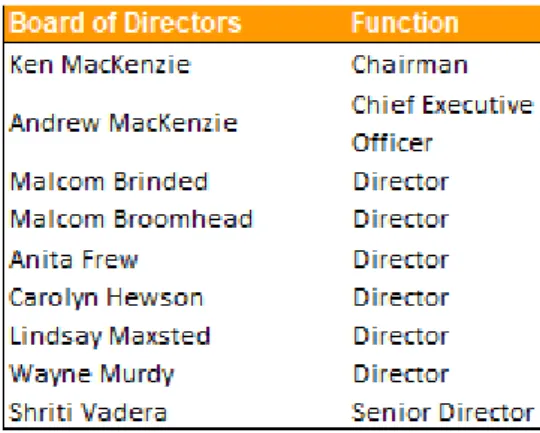
BoD (Board of Directors): The BoD is composed by 9 directors plus
the appointment of Terry Bowen and John Mogford to the Board effective 1 October 2017, meaning that the Board will have 11 members. The non-executive member Directors are independent of management. (see Appendix)
Risk & Audit Committee: Consists of 4 directors and the Chairman is
Lindsay Maxstead. She is responsible for the oversight and monitorization of financial reports, external and internal auditing.
Remuneration Committee: Consists of 4 directors whose Chairman
is Carolyn Hewson and it oversees and monitors remuneration policy.
Nominations & Governance Committee: It is constituted by 4
directors and its Chairman is the same as the Chairman of the BoD, Ken MacKenzie. The committee oversees and monitors renewal and succession planning.
Sustainability Committee: Composed 3 directors whose Chairman is
Malcom Brinded and it is responsible for the oversight and monitorization of material HSEC matters.
External Auditor: The company has KPMG as the main external
auditor, but the company is going to appoint EY to votes in the next Annual General Meeting. (see Appendix)
Social Responsibility
BHP Billiton Limited operates around the globe and it has a direct impact on the landscape and environment of development areas. Because of that, after the exploration of the land, the company focus on a combination of rehabilitation, ongoing management or on a transition to an alternative use when consulted with the local community.
After the Samarco dam failure on 5 November 2015, the company created the Fundação Renova which is implementing programs to restore the environment and rebuild the communities affected by the disaster. The Fundação Renova is relocating and rebuilding communities, consulting with the affected community members. The relocation process involves the identification and acquisition of land, design, and planning the urban development. In addition, compensation and financial assistance are being given to all communities affected by the dam failure, either directly or indirectly. In our opinion, BHP follows a strong corporate governance model. The company ensures that shareholders have an important role in the direction it should follow. They have several fundamental rights such as the appointment and removal of directors and the auditors as mentioned above. They also have the right to reject or approve the annual business report. In addition, the fact that all the directors on the board are independent
3.
Table 6 – BHP Board of Directors
D
Source: Company Data
Table 7 – Executive leadership team
6
Source: IMF
Source: India National Bureau of Statistics,
OPEC
Industry Overview and Competitive Position
World Economic Outlook
The Global Economic outlook is favorable. A recovery of the economic outlook is underway due to better investment, trade rates and the generally improved confidence in the markets. For the upcoming years, a growth is expected between 3.5% and 4%. Global growth is expected to be sustained in the next years. Although China is decelerating its growth, there are other countries which are having increasingly higher development and growth, especially the Emerging and Developing Economies (EMDEs) mainly due to an increase in commodity imports. Nevertheless, there are some risks related to financial stress, increased protectionism, and rising geopolitical tensions. The development of EMDEs should drive the demand for industrial metals, energy, and fertilizers.
China & India Outlook
Growth in China achieved 6.8% of GDP growth in 2017 and it is expected to continue to slow down even for values below 6% in 2022F, which are values not seen since 1990. China’s economy performed better than expected in 2017 due to a higher than expected recovery of exports, the continued fiscal support and the effect of reforms as well as a minimum positive contribution from net trade. In addition, China increased commodity imports, enforced production and consolidated foreign demand. Despite this positive side, Chinese growth is expected to be 6.5% in 2018 and to have an average of 6.3% in the following 2 years. Long-term fundamental drivers of potential growth are expected to slow progressively as the working age population falls and the capital stock matures. Finally, the economic structure is expected to continue to shift from industry to services and growth drivers will shift to consumption from investment and exports. The latter structural change will probably induce a less volatile underlying growth rhythm in the long run. China is the largest manufacturing and exporting economy in the world and the second largest in imports, so the performance of this country is a significant factor in the global economic system. We expect an overall stagnation in the commodities market, with its values of supply and demand trending to stabilization and even to an expected decrease in the coming years (10-20 years) as China’s economy shift from a commodities economy to a services economy.
In India, economic growth is projected to strengthen to above 7% with energy and metals demand rising at a similar pace. A gradual recovery due to the impact of the roll-out of Goods and Services Tax (GST) is expected. In the longer run, the GST will create a single market by boosting corporate investment, productivity, and growth with the reduction of the cost of capital equipment. In addition, real estate regulation and demonetisation of high denomination bills has been encouraging and India’s short-term outlook is solid, driven by consumer demand.
4.
Figure 9 – World GDP Growth
Source: IMF
Figure 10 – China and India GDP Growth
Figure 11 – Contribution to growth in China
Source: China National Bureau of Statistics,
OPEC
Source: IMF
Source: IMF
Source: IMF
United States Outlook
Growth in the United States picked up to 2.2% in 2017 supported by the strengthening of the private investment. There is a continuation in private consumption increase and even though real income gains are modest, wage growth is moderate and the personal ratings rate fell further than expected. The medium-term outlook for the US is uncertain due to a slowdown in the automotive and housing sectors despite the spending and consumer confidence being strong, which may affect demand. Progress on growth-enhancing infrastructure spending and tax reform has been slow and monetary conditions are expected to be even more restrict. Projected protectionism policies would cut consumer purchasing power and productivity growth. U.S. growth is expected to reach 2.3% in 2018 and then it will tend to moderate and remain below 2% yearly.
Australia Outlook
The economy will continue its growth at a robust pace. Business investment outside the housing and mining sectors will pick up, with exports boosted as new resource-sector capacity comes on stream. The increase in the strength of the labor market and household incomes is going to sustain private consumption and inflation and wages will pick up gradually. Australia’s central bank projects to start raising the policy rate in late 2018 and the expectations of this move, together with macro-prudential measures, are helping the cool the housing market. The fiscal position is strong and the government is committed to gradually close the budget deficit. The government has prudential macro measures in place to contain risks associated with potential large house price corrections.
Eurozone Outlook
Europe’s short-term outlook has improved, with most countries in the region now experiencing growth in domestic demand. With inflation remaining below target the target 2%, the ECB is expected to keep interest rates low and unchanged during the following year, but to gradually scale back asset purchases. While financial fragilities remain, downside risks have been reduced. In the northern regions, which are more internationally competitive, lower saving rates would boost growth and help to rebalance demand within the eurozone. In the southern part of Europe and to prevent longer run stagnation, microeconomic reform is required.
Commodity Industries
The mining sector, as well as the commodities market has deep correlations with the world infrastructure, framework, and growth. The growth a country has is due to its ability to improve and develop its systems and infrastructure. As part of this, commodities are essential to this growth as they affect the Housing, Military and Manufacturing sectors of the country’s economy. Nevertheless, it is important to have a deep understanding of each of them to understand and to know their supply and demand drivers as well as their price drivers.
Figure 13 – United States GDP Growth
Figure 14 – Australia GDP Growth
Source: IMF
Figure 15 – Euro Zone GDP Growth
8
Source: Bloomberg
Source: Bloomberg
Source: Bloomberg
Source: Bloomberg Source: Bloomberg
Iron Ore Segment
To be considered iron ore, the concentration of iron must range between 48.2% and 72.4%, which means that it needs to be highly concentrated to be economically viable, even though it is the fourth most abundant element in the world. In 2017 and in the previous years, China was the main driver of iron ore demand, reaching 67.8% of world market demand in that year. 98% of world mined iron ore is used in the production of Steel which is a major component used in infrastructures, property, automobile, machines and weapons industries.
China is restricting environment regulation on mining operations to improve air quality and as such, the supply for steel is decreasing. Steel demand is highly correlated with GDP, unemployment and interest rates, which directly affects the economy to a higher demand for high concentration iron ore is expected. The main drivers of iron ore price are steel demand, Chinese demand, world supply, steel scrap supplies, and input prices.
Steel scrap supplies are a substitute on the production of steel from mined iron ore. This means that a drop of 58% was registered between 2013 and 2015 from an average of 135.89 US$/mt to 57.2US$/mt on a CAGR of -35.12%. The iron ore price is expected to remain between 40US$/mt and 60US$/mt for the next 5 years.
There is an overall negative expected outlook for the iron ore market as suggested by a steadier worldwide demand in the last years mostly driven by a negative outlook in China manufacturing market. Even though there is still a positive 2,12% CAGR for Crude Steel production when we consider the period from 2007-2016, the last 3 years present a decreasing CAGR of -0,83%. When we look at China’s GDP, the absolute values of the combination of Housing, Mining and Manufacturing has been decreasing in the past years at a CAGR of -4,70%, also visible from its decrease as a percentage of GDP from 47% in 2013 and 2014 to 43% in 2016.
The market for iron ore has four main companies that are price makers for this commodity, amongst them, BHP. The barriers to the entry of new competitors in this market are high but a rise in the price of the commodity can attract new players into the market, mainly due to the exploration of new projects with lower production costs, decreasing the power of the big four (BHP, VALE, FMG, and RIO). This market has a very important characteristic: Low degree of product differentiation regarding the concentration of Fe in the ore. The highest the concentration, the higher the premium that is paid because of its higher productivity when manufacturing steel which is the main use of iron ore. Although there is a higher market for premium ores, there is a substitution effect in inferior concentration ores, if the price pays off.
Figure 17 – Iron Ore Prices
Figure 18 – Production of Crude Steel (‘000 mt)
Figure 19 – Iron Ore Market Share 2017
Source: Bloomberg
Source: Bloomberg
Source: Bloomberg
Source: BP Statistical Review of World Energy Source: BP Statistical Review of World Energy
Source: Bloomberg The perception of the slowdown of China’s economy reflects on the
demand for iron ore having a CAGR of -0.13% in the last 3 years, reflecting a turn in the industry. The Supply, on the other hand, is expected to decrease while high-cost producers leave the market, by the end of 2022F mainly by the ramp-up of recent low-cost exploration projects in Brazil and Australia. For 2017 the 62%-concentrated Iron Ore contract with delivery in had a yearly average price of US$ 68,45, reaching US$ 57.00 by 2018F and US$ 50.80 at the end of the decade. For the beginning of the following decade, prices are expected to reach US$ 51.70.
Copper Segment
Copper is one of the most widely used metals found in the world. It can be obtained through mines and its supply comes directly from it and from scrapped and reutilized copper products. Both supply and demand followed an upward movement this last years with a CAGR of approximately 2.9% (Figure 23). Most of the copper demand derives from 5 main industries: building and equipment accounting 30% (Figure 24) each, Infrastructure accounting for 15%, Transportation for 13% and the Industrial sector accounting for 12%.
The main drivers of copper price are the emerging markets because infrastructure represents such an important part of demand, being China and India the main consumers of this commodity (Figure 25). In addition, the US Housing Market uses copper in everything they produce, therefore, factors that affect US housing demand like mortgage rates, US GDP and demographics play a key role in the copper industry. Moreover, supply disruptions like political or environmental issues have a big impact in copper prices since a large portion of copper is produced in South America which is known by the nationalization of the mining industry, meaning that the local governments have a big influence in the commodity price. Finally, the substitution effect can lead to lower demand, for instance, aluminum can be used instead of copper for certain and specific products. The copper prices have been falling up until 2016 to 4868US$/mt (Figure 22). In 2017 there was a small rise in price to 6,050US$/mt and it is expected to continue its rising at a modest CAGR of 1.13%. BHP Billiton represents 10% of total copper production in the world being the fifth major producer of this commodity. This means that BHP production and performance directly affects the market and its stability (Figure 24)
Figure 22 – Copper Prices ($/mt)
Figure 23 – Copper Demand and Supply (‘000 mt)
Figure 24 – Copper Market Share
10
Source: BP Statistical Review of World Energy
Source: BP Statistical Review of World Energy
Source: BP Statistical Review of World Energy
Source: BP Statistical Review of World Energy
Coal Segment
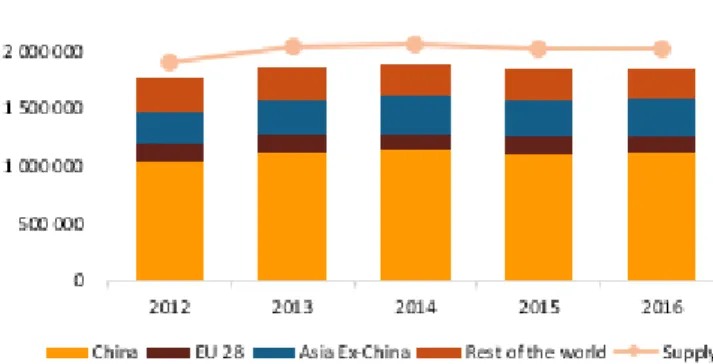
Coal has been one of the most used energy sources throughout history and still nowadays accounts for 28% of energy consumption worldwide. Coal can be divided into two main categories: Thermal and Coke Coal. The one needed for the steel industry (the majority of BHP’s sales) is coke or metallurgical coal because it is more refined and purer. Coal has four main uses: Power generation, Steel Industry, Miscellaneous industries such as aluminum refineries or paper manufacturers and Specialty products like filters or resins. China is the main consumer of Coal being responsible for 51% of the commodity consumption (Figure 27). After China, Asia Ex-China accounts for 23% of the consumption with Europe only accounting for 12% of the total. The downfall of the supply and demand over the last years is due to China’s policies about the environment and green production processes (Figure 28).
The main drivers of coal prices are emerging market demand like electricity consumption in developing countries, the substitution effect because as technologies improve, cost competitive substitutes for coal may emerge. Moreover, there are environmental concerns relating to the footprint emitted by coal and innovative technologies may affect prices. Finally, transportation costs are also the main driver of coal price because these costs can exceed the coal price at the mine. The market for coal is extremely hard to quantify in terms of market share because every major country has its own production and consumption of the commodity due to the fact it is readily more available. Some sources place BHP amongst the five major producers of this commodity but it extremely difficult to assess the accuracy of this information. The reason behind this lack of accuracy is because companies controlled by the governments and private companies can have higher production in this commodity than public companies. As it can be seen in Figure 30, the US is the country with the highest reserves of coal with 22.1%, with China right after it with 21.4%. Russia, Australia, and India fill up the top 5 of countries with the highest proven reserves of coal with 14.1%, 12.7% and 8.3% respectively. As it can be seen, the high-consumer commodities countries are in this list, which means its imports of this commodity are more scarce than other commodities in which the countries are not as abundant in reserves as coal.
Figure 27 – Energy Consumption 2017
Figure 28 – Coal Consumption
Source: BP Statistical Review of World Energy,
OPEC
Source: Bloomberg
Source: BP Statistical Review of World Energy,
OPEC
Source: BP Statistical Review of World Energy,
OPEC
Petroleum Segment
Oil
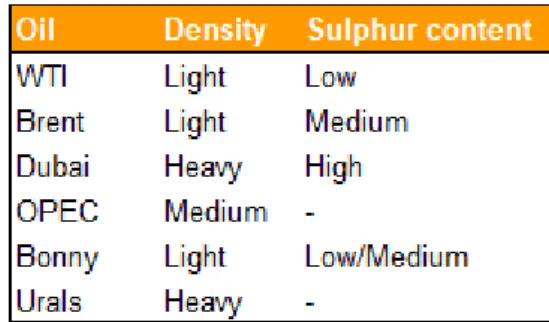
Petroleum is the worlds most used commodity. It creates fuel for cars, trains and other motorized vehicles, but this is only less than half of the use that oil has. In fact, less than half of a barrel is consumed for fuel and the rest of it is used to make consumer goods such as computers and synthetic textiles. There are many types of oil and the differences amongst are in density and Sulphur content (Table 4).
The distinct types of it are West Texas Intermediate (WTI), Brent Crude Oil, Dubai Crude, OPEC Reference Basket, Bonny Light and Urals. Each is different in its characteristics making them particularly valuable for certain specific industries.
In Figure 32 can be seen a selection of oil prices. The positive correlation is evident because oil is known as a “fungible” commodity which means that specific grades of oil are identical for oil trade purposes, and the downward path has an average CAGR of -20.27%. The main drivers of oil prices are supply and demand and the facility that exists in the movement of oil limits the influence of one or another producer in the global market. In addition, new types of oil are emerging pressing down the oil prices however, the extraction costs of the former mean these oils are only competitive in a lower supply and therefore higher price environment. Finally, higher expected demand is expected due to the increasing world population, increased energy consumption in developing countries and growth in the petrochemical, aviation and road transportation. In what concerns supply and demand, it is possible to verify that supply is always higher than demand at a CAGR of 1.69% and 1.58% respectively Figure 31).
Oil consumption (Figure 32) in 2017 is characterized by a strong consumption of Asia Pacific with 34.8% and North America with 24.7%. However, the highest consumption country is, in fact, the US with 20.6% of total consumption followed by China with 12.%.
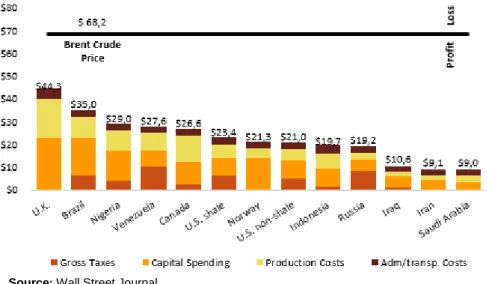
In Figure 34 can be seen the barrel cost breakdown by gross taxes, capital spending, production costs and Administrative and transportation costs as of the 9th of April 2018 per country. This shows
us that the U.K. has the lowest profit per barrel at $23.9, with Saudi Arabia being the leader in profit per barrel with over $59.
BHP operates more than half of the operations it maintains in oil. The other percentage comes mainly from British Petroleum. In what concerns the position of the company in the market, BHP is a price taker which is quite different from all the previous segments. Even though the company does not affect directly the market, it has direct relations with one of the most powerful companies in the world (BP) and proof of that comes from ownership in some explorations of BP and the latter operating some that BHP has interest on.
Table 8 – Oil Density and Sulphur content by Region
Figure 31 – Supply and Demand of Oil (‘000 barrels) Figure 32 –Oil prices ($/barrel)
12
Source: Wall Street Journal
Figure 35 - Cost of a barrel of Oil as of April 9th, 2018
Source: BP Statistical Review of World Energy,
OPEC
Source: BP Statistical Review of World Energy,
OPEC
Source: BP Statistical Review of World Energy,
OPEC
Natural Gas
Natural gas is mainly composed of methane which is created like oil and is usually found with oil, so it is natural that a company that sells oil also does business in natural gas. Although readily more available than oil, natural gas still has its niches in specific areas of the world, mainly in 3 countries (Iran, Russia, and Qatar) which hold almost 50% of the world’s reserves (Figure 35). Even though the U.S. is not the country with the highest reserves, it is the country with more production of natural gas (Figure 36). The fact that the U.S. reserves do not look promising for the future, it may imply the fact that they might be preparing to import more natural gas, further increasing the demand for the commodity. Demand and Supply for this commodity have been increasing at a steady CAGR of around 1.5% for the last 5 years and the prospects for its continuation of growth are good (Figure 37). The main drivers for the price of this commodity are its production, for instance, in periods of high production in the U.S., the prices for gas decreased and in periods with lower production, the prices increased significantly. The weather is another crucial driver of natural gas because hurricanes and storms can have an impact on its production having direct implications on the price. Another driver is the economic growth because if the economy grows, then the industrial and the commercial sectors will grow, implying greater consumption of the commodity, thus affecting its price. The supplies in storage can also affect the price since in periods of low demand, the stored gas is enough to satisfy the demand and it absorbs the production, preventing the prices from falling too far. At last, the threat of substitutes is a driver because it competes directly with other main sources of energy from renewables to fossil fuels.
In competitive positioning, natural gas is like oil. The company is a price taker, but it has strong relations with one of the biggest in the market (BP). This comes from the fact that usually gas is found in the layer of rock above oil, which means that the same wells that extract oil, extract gas resulting on the same relations with BP than in oil.
Figure 34 – Production of Gas
Figure 36 – Proven Gas Reserves
Source: Bloomberg
Source: Bloomberg
Source: Bloomberg
Source: Bloomberg
M&A Activity in the Petroleum industry
At it can be seen in Figure 38, oil price is positively correlated with the M&A existent and the volatility on it has a negative impact on the latter activity. This can be an indicator when trying to foresee the oil price. If there is a crescendo in the M&A deals this can indicate a surge in the oil price and vice-versa.
Exchange rates
BHP is highly exposed to exchange rates since it affects purchases, sales, COGS, Freight rates and Debt. Costs of locally sourced equipment and operating costs are influenced by fluctuation in this 2 specific exchange rates USD/AUD and USD/CLP. Most of the company sales are in USD, so a surplus in this currency is maintained to try to provide some reduction in the relative exposure to this foreign exchange.
Looking in depth to the 2 main currencies the company works with, the USD/AUD (Figure 39) is much more stable than USD/CLP (Figure 40), due to government issues in Chile and both economies growth. The USD/AUD has been stable throughout the last 13 years with estimates for this exchange to be between the last year’s numbers, around 1.0~2 AUD to buy 1 USD. However, a disparity in volatility can be seen when one looks at the exchange rate between USD/CLP. The company is much more exposed to this currency than to AUD, with the CLP estimates ranging between 500~750 CLP to buy 1 USD in 2021F.
Freight rates
Geographically, Australia is more distant from Europe than China, making the freight rates for the latter far cheaper than for Europe with an average difference of 6$/mt. As it can be seen in Figure 41, freight rates can evidently change the price paid by the importing country depending on its location. China buyers pay far fewer freight rates than European buyers. This can lead Europe to buy the commodities, for instance, in Brazil where the freight rates are minor than from Australia. In what concerns oil, the company mainly sell this commodity and gas directly to the country where it produces (the U.S. and Australia), resulting in the freight rates either being sunk costs (pipelines) or simply non-existent, where the buyer goes to the source to get its goods.
Figure 38 – M&A Activity in the Petroleum Industry
Figure 39 – Interest Rate USD/AUD
Figure 40 – Interest Rate USD/CLP
14
Source: The Author
Source: The Author
Porter 5 forces
The threat of new entrants is also low due to high barriers of entry, as the industry is very capital intensive and cost-competitive. Time is needed for exploration and building up the know-how for a cost-efficient production.
The bargaining power of suppliers is medium. Freight rates and oil prices have been declining because of increasing supply and price wars in recent years, even though both industries have big players that can influence the prices.
The bargaining power of buyers is low to medium. The steel industry has a few major players which are mainly located in China and if they arrange some deals, they can influence the price of the commodities. The threat of substitute products is low to medium with new supply coming from lower quality iron ore (pig iron) and from scrap.
The industry itself has a medium to high intensity of competitive rivalry with the biggest players always searching for ways to reduce costs, to have higher outputs and to gain market share.
Table 9 – SWOT Analysis
Source: The Author, Company Data
Source: The Author, Company Data
Source: The Author, Company Data
*Net Debt assuming that the cash received on the sale of Onshire US assets is fully distributed
Investment Summary
The final recommendation for BHP Billiton stands for HOLD. This recommendation derives from our target price of $50.39/sh for 2019HYE with a low to medium risk assessment and an upside potential of 11.26% from October 29th, 2018.
The exposure to markets with high growth potential (especially China and India) is going to drive BHP’s revenues for the upcoming years. Demand is expected to remain at its current growth value with a slight decline in China, yet not affecting the company due to positive prospects in the Indian market. The sale of the onshore US assets increased the company’s Cash and cash equivalents because it is cash sale and BHP did not clarify plans for the excess cash.
It is expected that BHP returns to 2015FY profits, before the Samarco dam failure, at the beginning of the next financial year. We expect a net income of $7.5 bn by 2019HYE, although adjusting to $7.0bn by 2023HYE as a consequence of expected commodity prices instability. The expected synergies and investment in maintenance is expected to increase EBITDA margins for the forecast period. These synergies result in a higher EBITDA in 2023HYE of $22,73bn +3.4% than in 2019HYE $21,99bn. The EBITDA margin is expected to increase +164bps from 2018FY to 35.44% 2019HYE, decreasing right after that due to commodities price instability and a slight decrease in the same.
Valuation methods
Our final price target of $50.39/sh was computed using the Discounted Cash Flow (DCF) method through the Free Cash Flow to the Firm (FCFF. However, we still used two other methodologies: Dividend Discount Model and the Multiples Valuation.
EBITDA and Net Operating Cash Flows to be main KPI’s
We assume the main costs, between COGS and Selling, General and Administrative, as last 4 years average except when we realized the presence of synergies in the COGS. In the case of SG&A we saw an increase from 2018FY to 2019HYE (22.26% of revenues to 27.64% respectively), mainly because of reversals in 2018FY of an impairment of intangibles due to the disposal of Onshore US assets. We predict Net Operating Cash flows of $29.04bn in 2019HYE due to the cash retained from the disposal. Nevertheless, by 2023HYE it is expected the Net operating cash flows to stabilize at $17.95bn.
Debt
Debt is expected to be stable around 2018FY figures as the company already reached its target net debt levels (between $10,0bn and $15,0bn) and because the majority of the debt that BHP has is of long-term. The short-term debt is expected to slightly increase due to ongoing projects and the need to finance them. In the perpetual period, the company expects to maintain a stable leverage.
Investment Risks
BHP is subject to a variety of risks, from economic or market risks to operational or environmental risks and the investor should be aware of these risks. To assess these risks, we performed a sensibility analysis to give a better understanding of the most important factors that affect the final DCF valuation.
5.
Table 10 -Valuation Summary
Figure 43 – Forecasted EBITDA ($Bn)
16
Source: The Author, Company Data
*Top-down Approach (Appendix 6)
Source: The Author, Company Data
*Top-down Approach (Appendix 6)
Valuation
We use the FCFF as the main valuation methodology to estimate the fundamental value of BHP. This method of valuation was used because it was the one that gives us the best estimation of the future price of the company given that our objective was the focus on long-term value for the investors and stable leverage rations in the long-run. This also highlights the characteristics of the company, its opportunities, its threats and its business model overall. Nevertheless, we also computed two additional models, the Dividend Discount Model and the Market Multiples. Because of this, our valuation is very sensitive to several factors detailed below. The prices of all commodities were established throughout a series of researches. For some commodities we used the World Bank Forecasts, whilst for others it was used, for instance, KPMG’s forecasts. For all however, it was taken into account the emergent stagnation of the Chinese market.
Revenues
To forecast revenues, we split the company into four main sources of revenues, being Iron Ore, Petroleum, Coal and Copper by EBITDA contribution as of 2018HYE.
Iron Ore
For Iron Ore, we used a top-down approach due to the fact the company is a major player in this market accounting for 14% of the total production of this commodity when considering only public listed companies as of 2017 YE. As total Iron Ore produced worldwide is much higher, the total production by the company accounts only for 8.35% as of 2017 YE, being nonetheless the second highest producer of it falling only short to Vale SA. There is an overall optimism in this market and analysts and experts expect an annual growth of 1.2% on the production of the commodity. The company predicts of strength its efforts in growing in this market alongside with its successful negotiations with the Australian harbor responsible for the shipping of an additional 10 thousand tons of material to be exported. A stable demand, despite the evident slowdown of China’s consumption which is offset by India’s growth as a forecasted GDP growth of 5.8% and 8.2% respectively in five years suggests, we expected a modest growth in the market share of the company. With the forecasted plans, the demand and considering all the other factors we expected 244 dry metric tons of material to be sold in 2019HYE up to 257 dry metric tons by 2023HYE. We reserved a percentage for any extraordinary item that might occur from adverse weather conditions to strikes. We used the World Bank forecasted prices for all the commodities as they are already a consensus between analysts and experts in the commodity market. We predict the price of Iron Or to be 60$/dmt in 2019HYE down to 57.80$/dmt by 2023HYE.
Copper
For Copper, we used the same approach as for Iron Ore. We used a top-down approach and adjusted the total market share of the company from a market only accounting for public companies to an overall market. India is expecting a huge growth in the consumption of this asset as it has already been seen in the last few years and as such and alongside with analysts and World Bank predictions we assume an overall growth in the production of Copper of 3.7% yearly, starting
6.
Figure 45 – Iron Ore Forecasted production (mm tons)*
Source: The Author, Company Data
*Bottom-up Approach (Appendix 6)
Source: The Author, Company Data
*Bottom-up Approach (Appendix 6)
in 2019. Given the above, the company is expected to produce around 1.618 million tons in 2019HYE up to 2.040 million tons in 2023HYE. A small percentage is reserved for extraordinary items (1% of total Copper sales) and the World Bank forecast prices used are from 6816$/mt to 6883$/mt in 2019HYE and 2023HYE respectively.
Coal
For Coal, we used a bottom-up approach due to the fact the company is no longer a major player in the world market for this commodity as it is for the above two. As coal is more abundant in the world, the countries that have it within their borders exploit it and use it. As such, the macro evaluation of the coal market is extremely difficult as the public companies do not give a clear image of the global market. Overall, we expect a recovery of the coal mines with the new exploration found in the Pilbara region as well as the permits accept by the Australian government to increase exploration and extraction of the mineral by BHP. In our valuation, we divided the coal in metallurgical and energy coal because they are used for different purposes and have different yields in the market. In our forecasts, we predict a growth of 1% annually in the period studied with the total coal sold returning close to 2016 values. As per the yields used, we also made the approach separately: for metallurgical coal we used the forecasted prices from KPMG report on 2017YE metallurgical coal, which returns a 2019HYE of 160$/mt and 130$/mt by the end of 2023. For energy coal, we used World Bank assumptions which are already adjusted for China’s slowdown. Even though it is expected that India is going to offset the lack of demand from China we still expect a decrease in the price of energy coal from 75$/mt in 2019HYE to 63.50$/mt in 2023HYE.
Petroleum
For the last main commodity sold by BHP, we also used a bottom-up approach because the company is not a major player in this market, even though they own wells that are operated by BP (British Petroleum – a major player in this market) and vice-versa. In 2018FY the company announced a big Onshore US sale to BP to reduce their risk and to eliminate what was a bad investment at the time yielding year after year of losses because of high values of expenses related to these assets. In this segment, we divided the production in Crude Oil and concentrate, Natural Gas and Natural Gas Liquids (NGL). As the sell of the onshore assets has an impact on each of the explored products we did an extensive decomposition and forecast of each product by region accounting for the fact that the deal of the sale is done in October 2018 which means that the company still produces for the first fiscal quarter of 2019FY. Because of that, we reduced 75% of the expected loss in production in 2019HYE and the remaining 25% in 2020HYE. Overall, and accordingly with the company disclosures of proved reserves we expect an increase in the overall production as disclosed although given the sale of Onshore US assets the production will decline from 192.4 million Boe in 2018FY to 139.7 in 2019HYE, 123.3 in 2020HYE and by the end of 2023HYE we expect a total production of 128.6 million Boe for the total segment. As for expected prices in this segment, we expect an increase (CAGR 0.69%) in the period for Crude Oil and concentrate, a small increase in the forecasted prices for NGL (CAGR 2.34%) and for Natural Gas it is expected also a small increase (CAGR 4.23%). As the time passes, we expect an overall increase in the price of oil since it is a non-renewable commodity and its use and scarcity adjusts supply and demand daily. As it gets more scarce, we expect an increase in price.
Figure 47 – Coal Forecasted Production (‘000 tons)*
Figure 48 – Petroleum Forecasted Production (mm boe)*
18
Source: The Author, Company Data
Source: The Author, Company Data
Source: The Author, Company Data
Source: The Author, Company Data Overall, we expect an increase in revenues always adjusting for any
slowdown in China’s demand and for exceptional items that can occur every day, especially where the company has open pit mines.
Main Costs
To project the costs associated with the production of the commodities we looked at the company globally, because BHP Billiton does not disclose the costs by commodity. For that, we accounted for the impact on direct COGS of the sale of Onshore US assets and reduced this value by 2000M$ in 2019HYE and by 500M$ by 2020HYE due to the sale happening in October 2018. Nevertheless, we expect a decrease in the COGS due to higher expense accounted for maintenance in CAPEX, as it is predicted by the company. After analyzing the industry one can conclude that the company has an advantage in the costs compared with most of the companies in the market. COGS are expected to be 7641M$ by 2019HYE and to decrease to 6996M$ by 2023HYE. Other expenses are Selling, General and Administrative (Operating Expenses) where we account all the other expenses related to the sale of the product amongst others. In this case, we expect an increase in these expenses mainly due to external services from 11,224M$ in 2019HYE to 11,889M$ in 2023HYE because of completion of projects in which BHP Billiton is not the operator of the mine and must contract externally.
Furthermore, we expect freight and transportation to increase from 2,328M$ in 2019HYE to 2,471M$ by 2023HYE because of higher port authorization in Australia harbor and the expected increase in oil prices. In what concerns external services one can expect a decrease in the same not only due to the Onshore US assets sale but also to the company strategy to reduce its external dependency, however, this will still account for 12.78% of revenues at a level of 5,191M$ in 2019HYE and 12.91% of revenues by 2023HYE.
CAPEX, D&A, and Impairment
BHP Billiton plans for CAPEX are to be below $8,0M annually. As such and based on the company plans and projects to develop, we estimate that the company will have a CAPEX of $7,5M in 2019HYE, with an extra Expenditure for exploration of $0.9M in the forecasted period. This is due to the need for finishing ongoing projects and to increase efficiency in the already established mines and sites. In addition, from the $7,5M, we also reserved $1,0M annually of the above for maintenance of existing machinery to create synergies mainly in Australia.
For D&A value, we used the same percentage as for D&A for Property, Plant, and Equipment for 2018FY. The combination of Capex with the percentage used to forecast D&A results in the decrease of the total amount of Net Book Value of Property, Plant, and Equipment. We do not expect any further permanent reduction in any of the company’s Property, Plant and equipment, as such we made impairments as of 2018FY.
Debt Strategy
As part of BHP’s strategy for Debt, the company aims to keep net debt between $10 Billion and $15 Billion throughout its life. This is to maintain the creditor’s confidence and the company rating in the main
Figure 49 – Cost of Goods Sold ($Bn)
Figure 50 – Main Costs (Ex-COGS) ($Bn)
Figure 51 – Capex Breakdown
Source: The Author
Source: The Author credit agencies as well as to control the cyclicality of its operating cash
flows. We expect a slight growth on debt from 2018FY up to 2023HYE (from 23.93% to 26.34% respectively of total assets) due to an increase in Capex mainly because of investment BHP expects to increase synergies. Refer to figure 44.
WACC Assumptions
For discounting the FCFF we used the WACC method. Our initial rate for 2019HYE is 5.74%, decreasing to 5.67% in 2023HYE. On terminal value, we assume that the company will have 70% of equity to 30% of the debt
For beta, it was done a correlation between the 200 biggest mining companies and the S&P 500 index. It was used 60 monthly observations throughout the last 5 years.
We used as risk-free rate 10-year government bond from Australia since the company is based there and we expect a terminal value of 1.50%. For BHP we used an industry risk premium because the company has a sensitivity to how the industry is operating even though, BHP is a major player in the market. For the cost of debt, we used the 10-year bonds the company has in the market that have a value of 3.25%.
Although we see a slight decrease in the weight of equity when compared with the weight of debt, one can expect an average 70% as the weight of equity and 30% respectively as the weight of debt for the terminal value. This is due to the fact that the company wants to invest heavily in maintenance and in finishing its pending projects, increasing consequently the Capex.
We reached a low WACC due to the considered low Market Risk Premium. Even though, the company is subject to high risk in the market, the company’s portfolio diversity and its hedging strategies offset a more riskier market.
Terminal Value Assumptions
Terminal value extremely impacts our valuation. Using the DCF approach the terminal value accounts for 80.52% of our enterprise value. As per the growth rate used we used an overview of the growth rate for the industry as well as some peers expected growth rates and adjusted for the fact that BHP Billiton is already a matured company a “cash cow” in the BCG matrix which means that has high and stable earnings with high and stable cash flows, high market share and relatively low market growth rate and company as whole. Therefore, the growth rate used is 1.50%. In the terminal period, it was used the net debt, however there is no consensus in the market on what is the most appropriate item to use.
Dividend Discount Model
Another absolute valuation methodology was used: the Dividend Discount Model. This model was used to access BHP intrinsic value and compare it with our DCF final price.
Using this approach we have a lower valuation of $41.03/sh with a downside potential of -6.61%.
Table 11 – WACC Assumptions
Table 12 – Sensitivity Analysis to Changes in Payout Ratio
20
Source: The Author, Company Data
Source: The Author
BHP has a clear policy of paying dividends. This policy states that at least 50% of the net income is attributable to its shareholders. Therefore, dividends are linked to the company’s earnings.
The company always pays an interim dividend which we expect to be $2bn every year due to the expected stability of BHP.
Historically, BHP always paid a dividend to its shareholders. Even when the company had negative EPS of $1.2/sh due to Samarco dam failure, the company distributed a dividend of $0.19/sh.
Multiples Valuation
A relative valuation was also made to compare BHP to its market peers. Using this approach, we reached a final target price of USD $45.66 (-9.86% than the DCF model), meaning the BHP is slightly overvalued related to its peers.
In our valuation using this method, we used three enterprise-value multiples: The EV/SALES, EV/EBITDA and EV/CFO. We selected these ratios because we wanted to focus on BHP performance when comparing with its peers on an operational level. We did not want to focus on the differences in capital structure.
However, due to the following reasons, we considered this the least reliable valuation model:
1. Multiples reflect how the market is developing which may disrupt negatively our valuation when the market in undervaluing comparable firms and vice-versa.
2. In any type of valuation, there is always some bias, there is always something which is not 100% real and with this type of valuation, the lack of transparency concerning the underlying assumptions makes it vulnerable to manipulation.
3. Nevertheless, several steps were taken to find the most suitable companies in the sector and because BHP is a leading company in the industry we found some companies that may have inconsistent valuations of value where important variables like cash flow potential, growth, risk or being in a different stage of the BCG Matrix were ignored.
Figure 53 – Dividend and Interim Dividend ($Bn)