1 Parte da Tese de Doutorado do primeiro autor, apresentada ao Programa de Pós-Graduação em Engenharia Agrícola da Universidade Federal de Viçosa - U FV
2 Faculdade de Agronomia e Medicina Veterinária/UnB, CEP 70910-970, Brasília, DF. Fone: (61) 3307-2803. E-mail: [email protected] 3 D EA/U FV, Av. P. H . Rol fs s/n, CEP 36570-000, Vi çosa, M G. Fone: (31) 3899-1874. E-mail: lfaroni@ufv. br; [email protected];
4 D TA/UFV. Fone: (31) 3899-2227. E-mail: [email protected]
Effect of the ozonization process on the quality
of peanuts and crude oil
1Ernandes R. de Alencar1, Lêda R. D . Faroni2, N ilda F. F. Soares3, M arta C. S. Carvalho3 & Katiane F. Pereira3
ABSTRACT
The purpose of this study was to evaluate the effect of ozone on the quality of peanut grains and crude oil extracted from these grains. Peanut samples of 1 kg w ere used, with a moisture content of 8.0% w.b. and stored in 3 L glass recipients. The ozonization process utilized ozone gas concentrations of 13 and 21 mg L-1, temperature of 25 ºC, exposure periods of 0, 24, 48, 72 and 96 h, and a flow rate of 1.0 L min -1. Evaluation of peanut quality consisted of analysis for moisture content, electrical conductivity, lipid concentration and peanut color. The qualitative parameters of the crude oil evaluated w ere free fatty acids, peroxide index and iodine index. In general there w as no alteration in peanut quality due to ozone, except for the coloration of the peanuts. W ith regard to parameters related to the crude oil extracted from the peanut, there were no qualitative alterations due to ozone exposure. It was concluded that, despite depigmentation of the skin surrounding the peanuts, the quality of the peanuts and the extracted crude oil is not affected by exposure to ozone gas at concentrations up to 21 mg L-1, for up to 96 h.
Key words: ozone, qualitative changes, coloration
Efeito do processo de ozonização na qualidade
dos grãos e do óleo bruto de amendoim
RESU M O
O propósito deste trabalho foi avaliar o efeito imediato do ozônio na qualidade dos grãos de amendoim e do óleo bruto extraído desses grãos. Utilizaram-se amostras de 1 kg de grãos, com teor de água de 8,0% b.u., acondicionadas em recipientes de vidro com capacidade de 3 L e no processo de ozonização, as concentrações de 13 e 21 mg L-1, temperatura de 25 ºC, períodos de exposição de 0, 24, 48, 72 e 96 h e vazão do gás de 1,0 L min-1. Para avaliação da qualidade dos grãos foram analisados os parâmetros teor de água, condutividade elétrica, teor de lipídios e coloração dos grãos. Q uantificaram-se, para a avaliação da qualidade do óleo bruto, o teor de ácidos graxos livres, o índice de peróxido e o índice de iodo. Em geral, não ocorreu alteração da qualidade do amendoim em virtude a exposição ao ozônio, exceto para a variável coloração dos grãos. Com relação aos parâmetros relacionados ao óleo bruto, não ocorreram alterações qualitativas devido a exposição ao ozônio. Concluiu-se que, apesar de ocorrer despigmentação da película que envolve os grãos de amendoim, a qualidade dos grãos e do óleo bruto extraído não é afetada pela exposição ao gás ozônio em concentrações de até 21 mg L-1, por até 96 h.
Palavras-chave: ozônio, alterações qualitativas, coloração
Revista Brasileira de
Engenharia Agrícola e Ambiental
v.15, n.2, p.154–160, 2011
I
NTRODUCTIONOzone gas (O3) is an allotropic form of oxygen that can be
produced synthetically by means of electrochemical discharge. During the production process of this gas, oxygen molecules (O2) are separated, producing highly reactive free radicals, which react with other oxygen molecules, resulting in ozone gas (Novak & Yuan, 2007).
Features such as high reactivity and penetrability, and spontaneous decomposition into a non-toxic product (oxygen) make ozone gas an important alternative for the food industry. Another key feature is its high oxidation potential, making it one of the most potent sanitizers known, and a strong antimicrobial agent. In 2001, FDA (U.S. Food and Drug Administration) approved the use of ozone as an antimicrobial agent in food, both in the gas phase and dissolved in water (FDA, 2001). The exposure time required for the inactivation of microorganisms depends on the microbial species, and on the concentration of ozone, and any concentration smaller than 0.02 mg L-1 is enough to treat pure water. The gas acts directly
on the microorganisms and destroys their cell wall (Stucki et al., 2005).
Ozonation has been used in Europe to sanitize water for human consumption. Currently, this technology is being used for other purposes, such as to treat swimming pool water; to sanitize gallons of water, surfaces of food, plants, and food processing equipments; to disinfect carcasses; to preserve fruits and vegetables; to control pests of insects in stored grain; to reduce aflatoxin levels in food (Mckenzie et al. 1998; Prudente & King, 2002; Mendez et al., 2003; Pereira et al., 2008; Sousa et al., 2008).
The ability of the ozone to inactivate or inhibit the growth of microorganisms, and reduce aflatoxin levels in foods, makes this gas an important alternative to peanut, as far as food safety is concerned. The peanut, which has high nutritional value, is considered an ideal substrate for the development of the fungi that produce aflatoxins Aspergillus flavus, A. parasiticus and
A. nomius, and the presence of this mycotoxin is one of the factors that most compromise the quality of peanut (Pitt, 2000; Blesa et al., 2003; Ehrlich et al., 2007; Nakai et al., 2008). The aflatoxins which are produced by these fungi are highly carcinogenic, teratogenic, and mutagenic, and the four main primary mycotoxins are aflatoxins B1, B2, G1 and G2 (Li et al., 2009). Out of these four primary mycotoxins, aflatoxin B1 has the most toxicity and is considered to have greater carcinogenic potential, classified by the International Agency of Research on Cancer as group I compound, in other words, with the potential to cause primary hepatocellular carcinoma in humans (IARC, 1993; Williams et al., 2004; Baird et al., 2006).
Considering that ozone can be an alternative for the quality control of peanuts, as far as food safety is concerned, operating both in the inhibition of the potentially aflatoxigenic fungi, and in the reduction of the aflatoxin levels; more work is needed to evaluate the effects of this gas in the quality of peanut grains and peanut sub-products. The need for more works on this subject is justified by the fact that the ozone gas is able, according to Victorin (1992), to oxidize organic cellular components, such as amino acids and polyunsaturated fatty
acids. Therefore, it is necessary to establish concentrations of the gas, and appropriate exposure periods of time, so that the quality of peanut is preserved, regarding the physical and chemical aspects. Hence, the aim of this study is to evaluate the quality of the peanut grains and of the crude peanut oil extracted from these grains, after the process of ozonation in different combinations of concentration, and in different exposure periods of time.
M
ATERIAL ANDMETHODSThe work was carried out at the Department of Pre-Processing and Storage of Agricultural Products in the Department of Agricultural Engineering - DEA, and at the Packaging Lab of the Department of Food Technology - DTA, both are located at the Federal University of Viçosa - MG.
To assess the effect of the insertion of ozone gas in peanut (Arachis hypogaea L.), grains with moisture content (m.c.) of about 8.0% of w.b. were used. The ozone gas was obtained through an ozone generator, based on the method of Dielectric Barrier Discharge (DBD), developed by the Department of Physics, from the Instituto Tecnológico de Aeronautica (ITA), in São José dos Campos, Brazil. In the process of ozone generation, oxygen with purity of 90 ± 3%, and free of humidity, was used as input. It was obtained from the Mark 5 Plus Oxygen Concentrator.
The concentration of ozone was determined through the iodine method, described by Clesceri et al. (2000), which is the bubbling of ozone in 50 mL of potassium iodide solution (KI) 1
N, with production of Iodine (I2). To ensure the displacement
of the reaction to the production of I2, it was necessary to acidify the mean with 2.5 mL of sulfuric acid (H2SO4) 1 N. The solution was then titrated with sodium thiosulfate (Na2S2O3 ) 0.005 N, using a solution of 1% starch, as an indicator.
During the process of ozonation, 1 kg of peanuts, packed in 3L glass recipients at temperature of 25 °C, were ozonized at concentrations of 13 and 21 mg L-1, with gas flow of 1.0 L min-1,
for periods of 0, 24, 48, 72 and 96 h. During the control treatment
(0 mg L-1), the grains were exposed to oxygen gas.
Qualitative analysis of ozonized peanuts Moisture content
The moisture content of peanut grains was determined by the gravimetric method in a forced-air circulation oven and temperature of 130 ± 1 ºC, as recommended by ASAE (2002), S401.1 method.
Lipid content
The lipid content of peanuts was determined according to the norms of AOCS (2009), Ac 3-44 method in soxhlet apparatus for 6 h using petroleum ether as solvent. The lipid content was calculated as a function of the dry matter mass of the sample and the lipid fraction extracted, according to Eq. 1:
100 * m L (%) Lipids
L - mass of lipids in the sample, g
m - mass of the sample in terms of dry matter, g
Electrical conductivity
The electrical conductivity of the solution containing peanut grains was performed using the system of glass or mass conductivity (Vieira et al., 2001), aiming to evaluate the increase in membrane permeability, as grains deteriorate.
Color of grains
The evaluation of the color of peanut grains was performed
with the ColorQuestTM II Tristimulus Colorimeter, reaching the
coordinate values L, a, and b from the Hunter system. With the values of coordinates L, a, and b, it was possible to obtain parameters related to the hue angle h (Eq. 2), to the color
saturation or chroma C (Eq. 3), and to the color difference E
(Eq. 4) (Little, 1975, Francis, 1975).
) a b arctang(
h
) b (a
C 2 2
2
0 2
0 2
0 a a (b b )
L L
E
where:
L - measurable in terms of intensity from white to black
a - measurable in terms of intensity of red and green
b - measured in terms of intensity of yellow and blue
L0, a0 - b0 - coordinates obtained before the ozonation of peanut grains
Qualitative analysis of the crude oil extracted from ozonized peanut grains
Free fatty acids
The free fatty acids (FFA) were determined in accordance with the norms of AOCS (2009), Method Ca 5a-40 and expressed as % of oleic acid. The FFA was calculated using Eq. 5:
m Vs) (Va 28.2 f N FA
F
where:
N - normality of NaOH solution
f - correction factor of the NaOH solution
Va - volume of NaOH 0.01 N spent for the sample, mL Vs - volume of NaOH 0.01 N spent in titration without oil sample, mL
m - mass of sample, g `
Peroxide Index
The peroxide index (PI) was determined according to the
norms of AOCS (2009), Cd 8-53 Method. The PI (mEq kg-1) was
calculated through Eq. 6:
m
Vs) (Va 1000 f N I
P
where:
f - correction factor of the Na2S2O3 solution
Va - volume of Na2S2O3 0.1N standardized spent for the
sample titration, mL
Vs - volume of Na2S2O3 0.1N standardized spent in titration without oil sample, mL
N - normality of Na2S2O3 solution
Iodine index
The determination of iodine was performed in accordance with AOCS (2009) norms, Method Cd 1b-87. The iodine value was obtained by Eq. 7:
m Va Vs f 1.27
I
where:
I - mass of iodine absorbed per 100 g of sample, g
f - correction factor of the Na2S2O3 solution
Vs - volume of Na2S2O3 0.1N standardized solution spent
in titration without oil sample, mL
Va - volume of Na2S2O3 0.1N standardized solution spent
for the titration of the sample, mL
Experimental outline
The experiment was conducted in split plots, in which there were concentrations of (0.13 and 21 mg L-1), and in the subplots
the periods of exposure to gas (0, 24, 48, 72 and 96 h), in a completely randomized outline with three replications. Initially the variance at 5% of probability was analyzed, and then there was the analysis of regression. In the analysis of variance the SAEG Software 9.0 was used. To obtain the regression equations and the plotting of graphs, the software SigmaPlot 2001 was used.
R
ESULTSANDDISCUSSIONSQuality of ozonized peanut grains
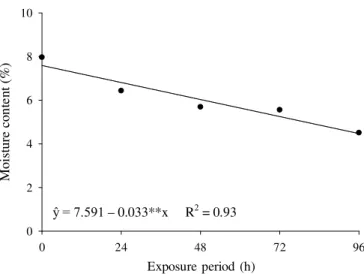
On Figure 1, there is the regression curve that describes the behavior of the moisture content of peanuts in different periods of exposure. Regardless of the exposure of peanuts to oxygen
gas (control), and ozone gas (13 and 21 mg L-1), there was a
significant decreasing (p < 0.05) of moisture content of the grains in the different periods of exposure. The estimated mean value of moisture content of the grains decreased from 7.6% to 4.4% when the exposure time was 96 h.
The use of oxygen, which is free of humidity, as input for the generation of ozone, and in the control treatment, explains the reduction of moisture content in peanuts (Figure 1). The loss of water during the ozonation process is due to the high hygroscopicity of peanut grains. It is important to note that in other products, such as fruits, ozone can react with the cuticle, (2)
(3)
(4)
(5)
(6)
which is a structure whose main function is to control the loss of water th rough transpiration, and with lipopr otein components, accelerating the loss of water (Rao et al., 2000).
The lipid content in peanuts remained around 45%, regardless of their exposure to oxygen and ozone gas, at different periods of exposure (p > 0.05). The implication of this behavior is that the ozone gas does not affect the chemical composition of peanuts. Corn, soybeans, and wheat grains, were ozonated by Mendez et al. (2003), at the concentration of 50 ppm for 30 days. These authors also found no change in the chemical constitution of the ozonized grains, and there were no alterations in the content of amino acids and lipids.
Regarding the variable electrical conductivity of the solution that contained the peanut grains, there was no significant variation by the interaction of ozone gas concentration and exposure periods and these two factors were analyzed separately (p > 0.05). The average values of the electrical conductivity of the solution that contained the grains, exposed or not to the ozone gas, at different periods of exposure, remained within the range of 80 and 90 S g cm-1.
The variable electrical conductivity is directly related to the cell membrane integrity, and to the physiological quality of the grains; poorly structured membranes and damaged cells are associated to the process of deterioration (Heslehurst, 1988). The peanut grains which were exposed to the ozone gas at
concentrations of 13 and 21 mg L-1, for up to 96 h, were not
affected physiologically. Similar results concerning the physiological quality of the grains were obtained by Santos (2008) for maize exposed to ozone gas at concentration of 100 ppm, for 180 min. Instead, Rozado et al. (2008) observed a significant increase in the electrical conductivity of the solution that contained the grains which had been exposed to ozone gas at concentration of 50 ppm, for 264 h.
Regarding the color saturation parameter, there was no significant variation by the interaction with the ozone gas concentration, nor with the exposure period, nor with any of these two factors, when analyzed separately (p > 0.05), however, the process of ozonation of peanuts in the different
combinations of gas concentration and exposure periods, resulted in a significant change (p < 0.05) of hue angle and color difference. Changes in hue angle and color difference, regarding the grain that were exposed to oxygen and to ozone
gas at concentrations of 13 and 21 mg L-1, at different periods
of exposure are shown in Figures 2 and 3, respectively.
Exposure period (hours)
0 24 48 72 96
M o is tu re c o n te n t (%) 0 2 4 6 8 10
* * Significant at 1% of probability through test F
Figure 1. Moisture content of peanut grai ns exposed to oxygen and to ozone, at concentrations of 13 and 21 mg
L-1, and at different periods of exposure
Figure 2. Regression curves of hue angle (h) of peanuts that were exposed to oxygen and to ozone gas, at
concentrations of 13 and 21 mg L-1, and at different periods
of exposure (h)
Figure 3. Regression curves of color difference of the grains
(E) of peanuts that were exposed to oxygen and to ozone
gas, at concentrations of 13 and 21 mg L-1, and at different
periods of exposure (h)
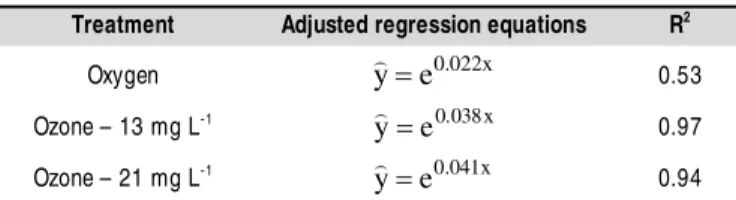
The adjusted regression equations and their respective coefficients of determination relative to the hue angle and to the difference in color of peanuts that were exposed to oxygen
and to ozone gas, at concentrations of 13 and 21 mg L-1, in
different periods of exposure, are presented in Tables 1 and 2, respectively.
The change in the color of peanuts grains can be explained by the depigmentation of its skin, of reddish color, by the ozone gas. Some pigments such as tannins, leuco-anthocyanins, flavanone and phlobaphene are found in the skin of these grains
Exposure period (hours)
0 24 48 72 96
0 21 24 27 30 33 36 39 Control
Ozone - 13 mg L-1 Ozone - 21 mg L-1
H u e an g le ( h )
Exposure period (hours)
0 24 48 72 96
0 5 10 15 20 25 30 35 40 45 50 55 60 65 70 Control
Ozone - 13 mg L-1 Ozone - 21 mg L-1
C o lo r d if fe re n ce ( E )
ŷ = 7.591 – 0.033**x R2 = 0.93
Exposure period (h)
Exposure period (h)
(Stansbury & Hoffpauir, 1952). The depigmentation observed in the peanut skin can be attributed to the high oxidation potential of the ozone gas, which is equivalent to 2.07 mV. It is important to notice that the ozone gas is able to degrade various organic compounds in foods, for instance the carotenoids and the anthocyanins (Mustafa, 1990; Henry et al., 2000; Guzel-Seydim et al., 2004; Tiwari et al., 2009). Another important aspect is that the capacity that the ozone gas has for bleaching and depigmentation makes it a different alternative for the food industry, for instance, for the bleaching of wheat flour and of refined sugar (Fernández et al., 2006; László et al., 2008).
What stands out, however, is that the change observed in the color of the skin that wraps the grains is not decisive in terms of quality, since one of the techniques adopted to add value to the product is peeling or bleaching. This technique is defined by Brasil (2009) as the procedure that consists on the removal of the skin which surrounds the peanut, through thermal and mechanical processes, to attend the consumer market or to reduce the levels of contamination and defects.
Quality of the crude oil extracted from ozonized peanut grains
The percentage of free fatty acids from crude oil remained within the range of 0.90 and 1.10%, regardless of the treatment with oxygen and ozone gas, at different periods of exposure (p > 0.05). The average values of free fatty acids from crude oil extracted from the grains, which had been exposed or not to ozone gas, remained below the limits required by ANVISA (1999) for selling crude peanut oil, which is 2.00%. These results confirm those obtained by Akbas & Ozdemir (2006), who found no increase in the percentage of free fatty acids in the crude oil extracted from pistachios ozonized at concentrations of 5.0, 7.0
and 9.0 mg L-1, in exposure periods of up to 420 min.
The peroxide value of crude peanut oil did not change significantly as a result of the concentration interaction of ozone gas and exposure time, and these two factors when
analyzed separately (p > 0.05). It is possible to notice that the average values of the peroxide index remained below the 10 meq kg-1 sample, which is the limit that has been established in
Brazil for selling crude peanut oil (ANVISA, 1999). Similar results were obtained by Faroni et al. (2007) for crude oil extracted from corn, which were ozonized at a concentration of 50 ppm, for 168 h.
Regarding the parameter iodine index of crude oil extracted from peanuts, the concentration interaction of ozone gas, and exposure period, was not significant (p> 0.05). There was also no significant variation due to factors related to either ozone gas concentration, or exposure time, when
analyzed separately. The mean iodine value was 96.8 gI2 100
g-1 ofsample, staying, therefore, within the maximum and
minimum limits established by the Brazilian legislation in order to sell this product, despite the high potential of the ozone to oxidize unsaturated fatty acids (Gómez et al., 2008). According to the Brazilian laws, the iodine index of crude peanut oil
should remain within the range of 80 and 105 gI2100g-1 of
sample (ANVISA, 1999). These results confirm the studies of Mendez et al. (2003), who found no significant change in the profile of saturated and unsaturated crude oil extracted from cor n , soybean an d wh eat which wer e ozon ized at a concentration of 50 ppm, for 30 days.
C
ONCLUSIONS1. The analysis and interpretation of the data showed that despite the high oxidizing power of the ozone gas and its ability regarding the depigmentation of the skin of the peanuts, the quality of the grains, and the quality of the crude peanut oil are not affected by the ozone, at concentrations of up to 21 mg L-1,
and at exposure periods of up to 96 h.
L
ITERATURE CITEDAkbas, M. Y.; Ozdemir, M. Effect of different ozone treatments on aflatoxin degradation and physicochemical properties of pistachios. Journal of Science of Food and Agriculture, v.86, p.2090-2104, 2006.
ANVISA - Agência Nacional de Vigilância Sanitária. Regulamento técnico para fixação de identidade e qualidade de óleos e gorduras vegetais. Resolução nº 482, de 23.09.1999.
AOCS - American Oil Chemists’ Society. Official methods and recommended practices. 6.ed. Champaign: AOCS, 2009. 1200p.
ASAE - American Society of Agricultural Engineers. Moisture measurement - Peanuts. In: Standards. St. Joseph: ASAE, 2002. p. 600-601.
Baird, R. E.; Trigiano, R. N.; Windham, G.; Williams, P.; Kelley, R.; Abbas, H. K.; Moulton, J. K.; Scrugges, M. L. Comparison of aflatoxigenic and nonaflatoxigenic isolates of Aspergillus flavus using DNA amplification fingerprinting techniques. Mycopathologia, v.161, p.93-99, 2006.
Table 1. Adjusted regression equations and their respective
coefficients of determination (R2)relative to the hue angle
(h) of peanuts that were exposed to oxygen and to ozone
gas, at concentrations of 13 and 21 mg L-1, and at different
periods of exposure (h)
* * Significant at 1% of probability through test F
Table 2. Adjusted regression equations and their respective
coefficients of determination (R2) relative to the color
difference (E) of peanuts that were exposed to oxygen
and to ozone gas, at concentrations of 13 and 21 mg L-1,
and at different periods of exposure (h)
Treatment Adjusted regression equations R2
Oxygen ye0.022x 0.53
Ozone – 13 mg L-1 0.038x
e y
0.97
Ozone – 21 mg L-1 0.041x
e y
0.94
Treatment Adjusted regression equations R2
Oxygen y 28.184
Ozone – 13 mg L-1 y28.1070.066**x 0.89
Blesa, J.; Soriano, J. M.; Molto, J. C.; Marin, R.; Manes, J. Determination of aflatoxins in peanuts by matrix solid-phase q dispersion and liquid chromatography. Journal of Chromatography, v.1011, p.49-54, 2003.
Brasil. Ministério da Agricultura, Pecuária e Abastecimento. Instrução Normativa nº 3, de 28 de janeiro de 2009, Diário Oficial da União. 29.01.09, Brasília, DF.
Clesceri, L. S.; Greenberg, A. E. Eaton, A. D. Standard methods for the examination of water and wastewater. Denver: American Water Works Association, 2000. 1220p.
Ehrlich, K. C.; Kobbeman, K.; Montalbano, B. G.; Cotty, P. J.
Aflatoxin-producing Aspergillus species from Thailand.
International Journal of Food Microbiology, v.114, n.2, p.153-159, 2007.
Faroni, L. R. D.; Pereira, A. M.; Sousa, A. H.; Silva, M. T. C.; Urrichi, W. I. Influence of corn grain mass temperature on
ozone toxicity to Sitophilus zeamais (Coleoptera:
Curculionidae) and quality of oil extracted from ozonized grains. In: IOA Conference and Exhibition. 2007, Valência, Espanha. Proceedings... Valência. IOA: 2007. v.1, p.1-6. FDA - Food and Drug Administration. Secondary direct food
additives permitted in food for human consumption. Federal Register, v.66, n.123, p.33829-33830, 2001.
Fernández, L. A.; Bataller, M.; Rey, R. P.; Véliz, E.; Hernández, C.; Alvarez, C. Use of ozone in the decolorization of sugar industry liquors. Science and Engineering, v.28, p.261–267, 2006.
Francis, F. J. The origin of tan-1 a/b. Journal of Food Science,
v.40, p.412, 1975.
Gomez, M. F. D.; Téllez, G. M.; Hernández, R. I. M.; Alaiz, M.; Garcés, R. Estudio analItico de especies oxigenadas en el aceite de teobroma ozonizado. Química Nova, v.31, n.3, p.610-613, 2008.
Guzel-Seydim, Z.; Greene, A. K.; Seydim, A. C. Use of ozone in the food in dustry. Lebensmittel-Wissenschaft un d-Technologie, v.37, p.453-460, 2004.
Henry, L. K.; Puspitasari-Nienaber, N. L.; Manuel Jarén-Galán, M.; Breemen, R. B. V.; Catignani, G. L.; Schwartz, S. J. Effects of ozone and oxygen on the degradation of carotenoids in an aqueous model system. Journal of Agricultural and Food Chemistry, v.48, p.5008-5013, 2000.
Heslehurst, M. R. Quantifying initial quality and vigour of wheat seeds using regression analysis of conductivity and germination data from aged seeds. Seed Science and Technology, v.16, p.75-85, 1988.
IARC - International Agency for Research on Cancer. IARC monographs on the evaluation of carcinogenic risks to humans: some naturally occurring substances, food items and constituents, heterocyclic aromatic amines and mycotoxins. IARC, v.56, p.26–32, 1993.
László, Z.; Hovorka-Horvath, Z.; Beszedes, S.; Kertesz,
S.; Gyimes, E.; Hodur, C. Comparison of the effects of ozone,
UV and combined ozone/UV treatment on the color and microbial counts of wheat flour. Ozone: Science and Engineering, v.30, n.6, p.413-417, 2008.
Li, P.; Zhang, Q.; Zhang, W.; Zhang, J.; Chen, X.; Jiang, J.; Xie, L.; Zhang, D. Development of class-specific monoclonal antibogy-based ELISA for aflatoxinas in peanut. Food Chemistry, v.115, p. 313-317, 2009.
Little, A. Off on a tangent. Journal of Food Science, v.40, p.410-411, 1975.
Mckenzie, K. S.; Kubena, L. F.; Denvir, A. J.; Rogers, T. D.; Hitchens, G. D.; Bailey, R. H.; Harvey, R. B.; Buckley, S. A.; Phillips, T. D. Aflatoxicosis in turkey poults is prevented by treatment of naturally contaminated corn with ozone generated by electrolysis. Poultry Science, v.77, p.1094– 1102, 1998.
Mendez, F.; Maier, D. E.; Mason, L. J.; Woloshuk, C. P. Penetration of ozone into columns of stored grains and effects on chemical composition and performance. Journal of Stored Products Research, v.39, n.1, p.33-44, 2003. Mustafa, M. G. Biochemical basis of ozone toxicity. Free Radical
Biology and Medicine, v.9, p.245–265, 1990.
Nakai, V. K.; Rocha, L. O.; Gonçalez, E.; Fonseca, H.; Ortega, E. M. M.; Corrêa, B. Distribution of fungi and aflatoxins in a stored peanut variety. Food Chemistry, v.106, p.285-290, 2008.
Novak, J. S.; Yuan, J. T. C. The Ozonation concept: Advantages of ozone treatment and commercial developments. In: Tewari, G.; Juneja, V. K. (ed.). Advances in thermal and non-thermal food preservation. Ames: Blackwell Publishing, 2007. p.185-193.
Pereira, A. M.; Faroni, L. R. D.; Sousa, A. H.; Urruchi, W. I.; Paes, J. L. Influência da temperatura da massa de grãos
sobre a toxicidade do ozônio a Tribolium castaneum. Revista
Brasileira de Engenharia Agrícola e Ambiental, v.12, p.493-497, 2008.
Pitt, J.I. Toxigenic fungi: Which are important? Medical Mycology, v.38, p.17–22, 2000.
Prudente, A. D.; King, J. M. Efficacy and safety evaluation of ozonation to degrade aflatoxin in corn. Journal of Food Science, v.67, n.8, p.2866-2872, 2002.
Rao, M. V.; Koch, J. R.; Davis, K. R. Ozone: A tool for probing programmed cell death in plants. Plant Molecular Biology, v.44, p.345–358, 2000.
Rozado, A. F.; Faroni, L. R. D.; Urruchi, W. M. I.; Guedes, R. N.
C.; Paes, J. L. Aplicação de ozônio contra Sitophilus zeamais
e Tribolium castaneum em milho armazenado. Revista Brasileira de Engenharia Agrícola e Ambiental, v.12, p.282-285, 2008.
Santos, J. E. Difusão e cinética de decomposição do ozônio no
processo de fumigação de grãos de milho (Zea mays). Viçosa:
UFV, 2008. 54p. Tese Doutorado
Sousa, A. H. ; Faroni, L. R. D.; Guedes, R. N. C.; Tótola, M. R. ; Urruchi, W. I. Ozone as a management alternative against phosphine-resistant insect-pests of stored products. Journal of Stored Products Research, v.44, p.379-385, 2008. Stansbury, M. F.; Hoffpauir, C. L. Estimation of skin content of
peanut meals and relative skin pigment content of isolated proteins. Journal of the American Oil Chemists’ Society, v.29, n.9, p.370-372, 1952.
Stucki, S.; Schulze, D.; Schuster, D.; Stark, C. Ozonization of purified water systems. Pharmaceutical Engineering, v.25, n.1, p.1-7, 2005.
Victorin, K. Review of genotoxicity of ozone. Mutation Research, v.277, p.221-238, 1992.
Vieira, R. D.; Tekrony, D. M.; Egli, D. B.; Rucker, M. Electrical conductivity of soybean seeds after storage in several environ-ments. Seed Science and Technology, v.29, p.599-608, 2001.