MOMENTUM AND CONTRARIAN STRATEGIES IN THE
PORTUGUESE STOCK MARKET
Pedro Filipe Silveira Inácio Rodrigues Pereira
Master in Finance
Dissertation
Tutor:
Prof. Doutora Sofia Brito Ramos, Assistant Professor of Finance and Director of Master in Finance, ISCTE Business School, Finance Department
i Agradecimentos
Com estes agradecimentos pretendo reconhecer aquelas pessoas que contribuíram para a realização desta dissertação.
Em primeiro lugar gostaria de agradecer à minha orientadora, Prof. Doutora Sofia Brito Ramos pela confiança em mim depositada e por todo o apoio prestado durante a execução deste projecto. O seu contributo em muito me ajudou, e dele guardo uma lição para a vida: Nós somos sempre capazes de fazer mais do que aquilo que julgamos conseguir fazer.
Gostaria também de agradecer à minha família, à minha namorada e aos meus amigos por toda a força e apoio que me deram nesta importante etapa da minha vida.
ii Key words Momentum strategy Contrarian strategy Asset Pricing Market anomalies
JEL Classification System
G11 - Portfolio Choice; Investment Decisions
G14 - Information and Market Efficiency; Event Studies G12 - Asset Pricing
iii SUMÁRIO EXECUTIVO
Esta dissertação desenvolve estratégias de obtenção de rendibilidades através da extrapolação de performances passadas, com base em dois estilos principais de investimento: estratégias
momentum e estratégias contrarian.
As estratégias momentum consistem no investimento a curto prazo (sobretudo de três a doze meses) nas acções que tenham obtido as melhores rendibilidades num passado recente (de três a doze meses). O primeiro estudo académico neste âmbito foi o de Jegadeesh e Titman (1993). A racionalidade destas estratégias assenta na sub-reacção (under-reaction)
As estratégias contrarian baseiam-se na compra das acções que tenham obtido as piores rendibilidades nos últimos três a cinco anos, e depois investi-las durante períodos de tempo similares. De Bondt and Thaler (1985, 1987) foi o primeiro estudo a evidenciar a rentabilidade destas estratégias. Estas estratégias assentam na hipótese da sobre-reacção (over-reaction).
Estudos realizados em diversos países têm evidenciado que as estratégias momentum e
contrarian permitem auferir rendibilidades superiores às do mercado. Todavia, em alguns
países existe alguma controvérsia relativamente a este assunto.
Os estudos realizados em Portugal neste âmbito são muito escassos. Os mais relevantes e com um maior grau de profundidade, são apenas dois: Alves e Duque (1996) e Soares e Serra (2005).
Alves e Duque (1996) realiza o estudo das estratégias contrarian usando uma pequena amostra de acções para o período de 1989-1994, obtendo resultados inconclusivos.
Soares e Serra (2005) engloba uma amostra de 82 acções (com liquidez considerável) para o período de 1988 até 2003. Os resultados apontam para a rentabilidade das estratégias
contrarian (que se baseiam na hipótese da sobre-reacção) mesmo após os factores de risco e
outros terem sido considerados. Quanto às estratégias momentum (baseadas na hipótese da sub-reacção) estas permitem obter rendibilidades consideráveis mas após o risco ser levado em consideração, a evidência neste sentido é fraca.
Esta dissertação procura acrescentar valor à actual literatura financeira, nacional e internacional.
iv Neste sentido, debruça-se essencialmente em saber se é possível obter rendibilidades superiores às do mercado usando as célebres e tradicionais estratégias momentum e
contrarian, no sentido de reforçar ou contradizer os resultados evidenciados sobretudo por
Soares e Serra (2005) sobre o mercado português de acções. Ainda neste âmbito procura identificar se as estratégias mais rentáveis são as momentum ou contrarian e quais especificamente são mais lucrativas. Outro aspecto relevante prende-se em saber se os resultados são economicamente e estatisticamente significativos. Por fim, esta dissertação procura descobrir outras formas de obter rendibilidades mais elevadas, usando tendências de performance passadas.
Procurando dar resposta a esta última questão foram desenvolvidas estratégias de investimento “inovadoras” que consistem na compra de acções sempre que se verifiquem dois requisitos: a rendibilidade no mês precedente ao investimento tem de ser maior que Js (5% ou 10%) e nos meses anteriores a este mês a rendibilidade média terá de ser superior a Jm (30% ou 40%). Caso estas duas condições não se verifiquem, o modelo desenvolvido considera que o melhor é investir a uma taxa de juro “sem risco” (por exemplo dum depósito a prazo) e, por conseguinte, assume essa rendibilidade para esse período. As estratégias inovadoras podem também ser divididas em duas sub-estratégias: “seguir os vencedores” (comprar acções que escrupulosamente preenchem os dois requisitos) e “seguir os vencedores ou iniciantes” (comprar acções que cumprem o requisito Js, mas que por terem entrado na bolsa muito recentemente não existe informação disponível para comparação com o Jm).
A amostra usada neste estudo é constituída por todas as acções da bolsa portuguesa (PSI) para o período de Janeiro de 1997 até Dezembro de 2008. As estratégias usam períodos de investimento de um a sessenta meses, e períodos de formação/passados entre um a trinta e seis meses. No caso específico do estudo das estratégias contrarian para a amostra de 1999-2008, o período de formação foi estendido até sessenta meses.
As estratégias momentum, contrarian e inovadoras foram calculadas por dois métodos distintos: o CAR ou AAR (períodos sobrepostos) e o BHAR (períodos não sobrepostos). Tanto as estratégias momentum e contrarian, como as estratégias inovadoras, foram todas desenvolvidas e calculadas através de programas criados no Visual Basic aplicado ao Excel, sendo criado um UserForm que permite calcular automaticamente qualquer estratégia que o investidor/utilizador pretenda, sem o mínimo esforço. Nas estratégias momentum e contrarian apenas é requerida a inserção do número de portfolios, e do período ou períodos de formação
v (m) e investimento (n) que se pretendem calcular. Nas estratégias inovadoras o utilizador insere o período ou períodos de investimento (n) e de formação (s e m), as rendibilidades para
Js e Jm, e escolhe ainda entre “seguir os vencedores” ou “seguir os vencedores ou iniciantes”.
No que concerne aos resultados obtidos, estes evidenciam a rentabilidade das estratégias
momentum e apoiam a hipótese da sub-reacção.
As três melhores rendibilidades (cerca de 1.5% de rendibilidade média mensal) resultam do investimento no grupo dos maiores vencedores (Portfolio 1), sendo as acções alocadas por sete grupos.
Os resultados são consistentes a alterações no tamanho dos portfolios (três, cinco e sete) e ao uso de períodos sobrepostos e não sobrepostos. Contudo, aquando da divisão do período do período de 1997-2008 em dois, o período de 2003 a 2008 aufere rendibilidades consideravelmente superiores ao período de 1997-2002.
As estratégias inovadoras que permitem obter rendibilidades médias superiores são as estratégias a curto prazo até 12 meses que adoptam “seguir os vencedores ou iniciantes” com
Jm = 30% ou 40%, e Js = 5%.
O modelo criado das estratégias inovadoras é de extrema utilidade, pois que, permite auferir rendibilidades acima dos 2.5% de média mensal se consideramos as três melhores estratégias, o que supera de forma abismal as melhores rendibilidades obtidas com as três melhores estratégias momentum ou contrarian (cerca de 1.5%).
Adicionalmente, a capitalização também foi usada no cálculo das estratégias inovadoras, mas o seu uso não incrementou as rendibilidades, bem pelo contrário, diminui-as.
Os resultados das estratégias inovadoras apresentam consistência a variações nos períodos de tempo, e ao uso de períodos sobrepostos e não sobrepostos.
Finalmente, acresce referir que a maioria dos resultados das estratégias momentum,
vi DISSERTATION SUMMARY
This thesis studies whether momentum and contrarian strategies are profitable on the Portuguese stock market and whether it is possible to obtain higher returns based on past performance trends. The time period analyzed is 1997-2008.
The momentum strategy is based on the under-reaction hypothesis. This suggests that stocks that have had the best (worst) results in the recent past will continue to have better (worse) results in the near future, and therefore a trading strategy that buys winner stocks and sells the losers would provide significant abnormal returns. On the other hand, the contrarian strategy is based on the overreaction hypothesis which assumes the opposite behaviour from stock returns, and hence recommends buying losers and selling winners.
Short term strategies show momentum profitability, thus supporting the under-reaction hypothesis. For longer periods, contrarian profitability (and overreaction) is also considerable but not so evident.
An “innovative” investment strategy was developed that provides much higher returns than momentum and contrarian strategies. It is based on two upward past trends: if the past returns for the two defined periods preceding the holding period were equal or higher than the percentages defined, this stock is bought; otherwise, a safer investment such as a deposit with a risk-free rate is preferable.
Results are not statistically significant but are economically relevant.
Finally, results are robust to changes in the time-period, number of stocks included in the portfolios and after considering transaction and custody costs.
vii RESUMO DA DISSERTAÇÃO
Esta dissertação analisa a rendibilidade das estratégias momentum e contrarian na bolsa portuguesa (PSI) no período de 1997 a 2008. Estuda também a possibilidade de obter rendibilidades superiores extrapolando rendibilidades passadas.
A estratégia momentum é baseada na hipótese da sub-reacção. Isto sugere que as acções que tenham tido melhores (piores) resultados num passado recente continuarão a ter melhores (piores) resultados num futuro próximo e, portanto, uma estratégia de investimento que compra acções vencedoras e vende as perdedoras, permitirão alcançar rendibilidades superiores. Por outro lado, a estratégia contrarian baseia-se na hipótese de sobre-reacção que assume o comportamento oposto da rendibilidade das acções e, consequentemente, recomenda a compra das perdedoras e a venda das vencedoras.
As estratégias de curto prazo demonstram a rentabilidade das estratégias momentum, apoiando a hipótese da sub-reacção. Os resultados obtidos para períodos longos evidenciam uma rentabilidade considerável das estratégias contrarian (e da sobre-reacção), mas não tão evidente.
Uma estratégia “inovadora” foi desenvolvida, permitindo auferir lucros consideravelmente superiores aos obtidos com as estratégias momentum e contrarian. Esta pressupõe duas condições: caso as rendibilidades passadas nos dois períodos definidos precedendo o período de investimento forem iguais ou superiores às percentagens definidas, a acção é comprada, caso contrário, investimentos mais seguros são preferíveis, tais como, os depósitos (taxa de juro sem risco).
Os resultados não são estatisticamente significativos mas são economicamente relevantes. Finalmente, os resultados são consistentes às alterações nos períodos de tempo, ao número de acções incluídas nos portfolios, e depois de considerados os custos de transacção e de custódia.
viii TABLE OF CONTENTS
1 – Introduction...1
2 – Literature review...6
3 – Data...13
4 – Momentum and Contrarian strategies...14
4.1 – Methodology...14
4.2 – Empirical Findings...18
5 – Innovative strategies...38
5.1 – Methodology...38
5.2 – Empirical Findings...53
6 – Focusing on profits and not on the returns as explanatory factors...61
7 – Conclusion...62
8 – References...65
ix FIGURE INDEX
Figure 1 – UserForm for Momentum and Contrarian strategies using overlapping periods. Example of K12-J6 strategy with stocks ranked according to their past performance into seven portfolios...5
Figure 2 – UserForm for Innovative strategies using overlapping periods. Example of
K9-J1-J2 strategy with Jm = 40% and Js = 5% for “Follow the winners or starters”...5
Figure 3 – Monthly average returns from Portfolio 1 (top winner portfolio) to Portfolio 5 (top loser portfolio) for the short-term strategies (formation and holding periods until twelve months)...21
Figure 4– Monthly average returns for the long-term from 1999 to 2008, for the five portfolios, using overlapping periods. P1 and P5 are the portfolios composed by top winner stocks and top loser stocks, respectively...27
Figure 5 - A practical example: Strategy K3 J1 J5 with Js = 5% and Jm = 30%...40
Figure 6 – Overall monthly average returns of all strategies (K1-K60) from “follow the winners” and “follow the winners or starters” for each possible combination of Js (5% or 10%) and Jm (30% or 40%). The overlapping method was used...53
Figure 7 - Overall monthly average returns of all strategies divided into short-term strategies
(K1-K12) and medium-long term strategies (K18-K60) from “follow the winners” and “follow
the winners or starters” for each possible combination of Js (5% or 10%) with Jm (30% or 40%). The time period is from 1997 until 2008 and the Overlapping periods were used...54
Figure 8- Overall monthly average returns of all strategies divided into short-term strategies
(K1-K12) and medium-long term strategies (K18-K60) from “follow the winners” and “follow
the winners or starters” for each possible combination of Js (5% or 10%) with Jm (30% or 40%). The time period is from 1997 until 2008 and the Non-Overlapping method was used...55
x Figure 9 – Monthly average returns of “follow the winners” or “follow the winners or starters” (overlapping method) above PSI and PSI-20 during 1997-2008...56
Figure 10 – Monthly average returns for the most profitable strategies for “follow the winners” and “follow the winners or starters” during 1997-2008 (overlapping method). The first three columns are the three most profitable strategies from the “follow the winners” while the other three columns represent the most profitable strategies of “follow the winners or starters”...57
Figure 11 – Mean of the monthly average returns from “follow the winners” and “follow the winners and starters” for all Kn Js Jm for the four combinations of Js and Jm, both with and without capitalization. The time period is 1997-2008 and the overlapping method was used...59
Figure 12 – Monthly average returns for the most profitable strategies for “follow the winners” and “follow the winners or starters” with and without capitalization, during 1997-2008 (overlapping method). The first three bars are the three most profitable strategies from the “follow the winners” while the other three bars represent the most profitable strategies of “follow the winners or starters”...60
xi TABLE INDEX
Table 1 – Studies documented on momentum strategies...8
Table 2 – Studies documented on contrarian strategies...12
Table 3 – Short-term monthly average returns using overlapping periods and five portfolios in which stocks were equally allocated (with just one exception: when the number of stocks was not multiple of 5, the extra stocks were allocated to P1, P2, P3 and P4). The investment period starts in January 1997 and ends in December 2008...18
Table 4 – Monthly average returns on PSI-20 and PSI...20
Table 5 – Number of short-term strategies with positive returns, returns above PSI and returns above PSI-20...22
Table 6 - Long-term monthly average returns using Five Portfolios (1997-2008) and Overlapping Periods...23
Table 7 – Number of strategies with positive returns, positive returns above PSI and positive returns above PSI-20 for the 45 medium-long term holding period strategies………24
Table 8 – Mean of the average monthly returns by portfolio and by investment time-period for short and medium-long term. Each investment period is divided into short-term strategies (K1-K12), medium-long term strategies (>K12) and overall strategies (K1-K60) which means all periods analyzed (from 1 month until 60 months strategies). The difference between top winners and top losers is also computed (P1-P5)...29
Table 9 – Monthly average returns (gross rates) for the three most profitable strategies
(K1-J6, K3-J3, and K6-J3). It was used overlapping periods and the five portfolios. Results are
shown for the four periods: 1997-2008, 1997-2002, 2003-2008 and 1997-2007...30
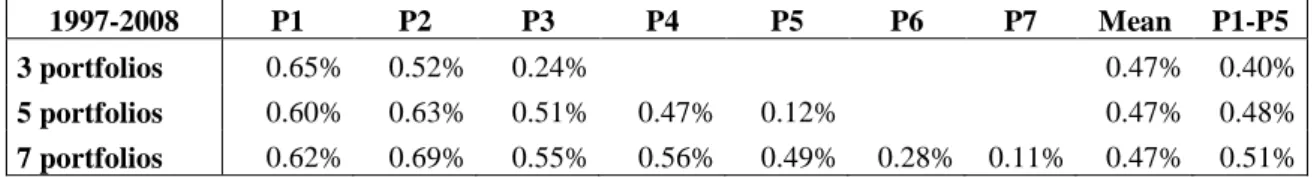
Table 10 – Mean of the monthly average returns for 1997-2008 for the three, five and seven portfolios...30
xii Table 11 – Monthly average returns for the three most profitable strategies attained with the top winner portfolio, from ranking the stocks into three, five and seven portfolios...31
Table 12 – Mean of the monthly average returns for three, five and seven portfolios (1997-2008)...31
Table 13 – Non-overlapping method - Monthly average returns for the most profitable strategies for the three, five and seven portfolios (which belong to the winner portfolio)...32
Table 14 – Abnormal monthly returns from the overlapping method compared with the non-overlapping method...32
Table 15 – Number of stocks per portfolio according to the ranking into three, five or seven portfolios (1997-2008)...33
Table 16 – Monthly average returns with 100% portfolio rotation for the most profitable strategies based on rankings (3, 5 and 7 portfolios)...34
Table 17 – Calculation of returns after accounted for costs for K6-J3 for P1 from the seven portfolios ranking, assuming 100% portfolio rotation. The amounts are in Euros...35
Table 18 - Monthly average returns with 75% portfolio rotation (for the 5 portfolios) and 78% portfolio rotation (for the 7 portfolios) for the most profitable strategies...36
Table 19 - Returns calculation after accounting for costs of K6-J3 for P1 from the seven portfolios ranking, assuming 78% portfolio rotation. The amounts are in Euros...37
Table 20– Monthly average returns of PSI and PSI-20 during 1997-2008...56
Table 21 – Monthly average returns for the three most profitable strategies from “follow the winners” and the three most profitable strategies for “follow the winners or starters”, for four time periods: 2008, the two sub-periods which are 2002 and 2003-2008, and
1997-xiii 2007 in order to exclude the effect of the sub-prime crisis. The overlapping method was used...58
Table 22 – Ten different scenarios (amounts to invest) for the strategy K1 J1 J8 of “follow the winners” with Js=5% and Jm=40%...58
1 1 – Introduction
All investors need an investment philosophy. Investment strategies should be guided by organized and consistent thoughts about markets (and the way they work) and the types of mistake others make, so that investors can clearly define a strategy to guide their investments. Investors without an investment philosophy tend to switch from strategy to strategy, driven simply by recent success which in turn will increase the transaction costs and probably make them incur losses (Damodaran, 2003).
By constructing an active investment philosophy, it is assumed that markets are inefficient but this raises two different issues: which stocks will be more underpriced and how long will these inefficiencies last. For instance, if an investor buys an underpriced stock, how long should he/she hold the asset before the stock returns to its true value? This is the reasoning behind momentum and contrarian strategies.
Therefore, in order to beat the market and take advantage of market anomalies, an investor should carefully define an investment style. This thesis will focus on the two main investment styles: contrarian and momentum strategies.
Contrarian strategies consist of buying long-term past losers (stocks with the lowest performance during the previous three to five years) and holding them over the subsequent three to five years (holding period). The literature initiated by De Bondt and Thaler (1985, 1987) justified this long-term return reversal by the irrationality of investors who tend to overweight recent information and underweight past data when revising their prospects. Thus, investors are too optimistic about good news and too pessimistic about bad news (market overreaction), which can make the stock prices move away from their fundamental values. As a result, stocks with a long record of bad news tend to become underpriced and have high returns in the subsequent period (and vice-versa).
Conversely, momentum strategies are based on buying short-medium term winners (stocks with the highest returns over the last three to twelve months) and holding them for the same period. The first academic study in this field came from Jegadeesh and Titman (1993). Given that performance persists in medium-term periods (“return continuation”), stocks should be bought when others are most bullish about them and sold when others are most bearish. This view is based on the under-reaction phenomena; this states that stocks under-react to new information over periods from one to twelve months, and tend to gradually incorporate it into
2 prices, thus showing positive self-correlations over these periods. Good and positive news will have a positive impact on near future returns.
The existence of abnormal returns provided by momentum and contrarian strategies has been documented in some countries, although there is some controversy about the results. Studies are not unanimous about such evidence.
To date, few studies have addressed the Portuguese stock market. A couple studies international markets and consider Portugal as just one of a number of countries included in the sample. For example, “Global Momentum Strategies – A Portfolio Perspective” provided by Griffin, Ji, and Martin (2003) illustrates that Portugal has no price momentum profits at a five percent statistical significance level. Studies that focus more on the Portuguese market include that of Alves and Duque (1995) which analyzed the contrarian strategies applied to a small sample of Portuguese stocks between 1989 and 1994 and showed inconclusive results. The findings of the more recent and broader study by Soares and Serra (2005) support superior returns of contrarian strategies and provide weak evidence in favor of profitability of momentum strategies after risk has been accounted. They give great emphasis to behavioral models to explain the negative correlations in long term (overreaction) and positive correlations in short term (under-reaction) between formation and holding periods. Most results are not statistically significant.
I will extend the current literature focusing on three main issues:
- Are returns in the Portuguese stock market really abnormal? If so, which strategy seems to be more profitable: momentum or contrarian?
- Are they economically/statistically significant?
- Is it possible to get higher returns using return past trends?
I will apply momentum and contrarian strategies in the Portuguese Stock Market to determine whether there are momentum and contrarian profits and to obtain the most profitable strategies.
I will develop an “innovative” investment strategy based on two upward past trends which use percentages to define whether or not investment should be made in given stock: if the past returns for the two defined periods preceding the holding period were equal to or higher than the defined percentages, the investment should be made in that stock; otherwise, a safer investment such as a deposit with a risk-free rate is preferable.
3 The period under analysis for the holding periods is from January 1997 until December 2008 (144 months) and the period for the formation/past periods is from January 1994 until December 1996. The strategies are based on holdings periods ranging from one to sixty months, and formation periods from one and thirty-six months. The sample is composed of all Portuguese stocks.
Momentum and contrarian strategies were executed using overlapping and non-overlapping periods; stocks were ranked according to their past performance into three portfolios, five portfolios and seven portfolios. All strategies were executed in Visual Basic applied to Excel. The UserForm that was developed executes any strategy and simply requires the insertion of the number of portfolios desired, the holding period(s) and the formation period(s). The UserForm can be seen in figure 1
The “innovative strategies” were executed using the overlapping periods and non-overlapping periods, both with and without capitalization in order to determine its effects on profitability. In “innovative strategies”, the investor only buys the stocks that meet the following requirements: the performance during the month preceding the holding period must have been higher than Js (5% or 10%) and the performance during the months previous to the month preceding the holding period must be higher than Jm (30% or 40%). There are then two sub-strategies: “follow the winners” (buying stocks that rigorously fulfill these assumptions) and “follow the winners or starters” (buying stocks with no available data for the evaluation of Jm due to very recent entry in the stock market but that fulfill the Js requirement). A UserForm was developed in Visual Basic applied to Excel; this is user friendly and allows the execution of any strategy. The user only needs to fill the following parameters in the textboxes: defining the holding period(s) and the formation periods (s and m), defining the percentages for Js and
Jm, and choosing between “Follow the Winners” (FW) or “Follow the Winners or Starters”
(FWS). The UserForm can be seen in figure 2
The results obtained here provide evidence on momentum profitability (and under-reaction) in the Portuguese stock market for the 144 month period analyzed (1997-2008). The evidence on contrarian profitability is weak and consequently there appears to be no over-reaction (long term strategies generate low returns). However when the period from 1999 to 2008 is analyzed the contrarian profits are considerable, especially for the non extreme loser portfolio (P4) which reinforces the evidence provided by Soares and Serra (2005). Interestingly the highest mean return on long term strategies is provided by the intermediate portfolio.
4 Ranking the stocks into seven portfolios and then choosing the top winner portfolio provides the three most profitable strategies (close to 1.5% monthly average returns).
Results are robust to changes in portfolio sizes (three, five and seven portfolios) and to overlapping and non-overlapping periods. There is a considerable difference in returns in favour of the 2003-2008 only when the sample is divided in two sub-periods.
The “innovative strategies” provide higher mean results by implementing strategies for short-term periods (K1-K12) from “follow the winners or starters” with Jm=30% or 40% and
Js=5%.
The most profitable “innovative strategies” (higher than 2.5% monthly average returns) undoubtedly provide much higher returns than the most profitable strategies provided by momentum and contrarian strategies. This provides evidence on the importance of the creation of the “innovative strategies” model.
The use of capitalization in the stock market using innovative strategies provides clearly lower results.
Results from innovative strategies are robust for changes in time periods (1997-2002, 2003-2008, and 1997-2007) and using overlapping and non-overlapping periods.
Most results from momentum, contrarian and innovative strategies are not statistically significant.
The paper is organized as follows. Firstly, section 2 makes a brief review of the literature. Section 3 describes the data used in the sample. Afterwards the thesis is divided in two main parts: section 4 is comprised of momentum and contrarian strategies; and section 5 of the “innovative” investment strategies. Each part includes the respective methodology and empirical findings which are carefully and accurately explained. Afterwards there is section 6 that emphasises the focus on profits and not on the returns as explanatory factors. Finally, section 7 presents the main conclusions of the paper.
5 Figure 1 – UserForm for Momentum and Contrarian strategies using overlapping periods. Example of K12-J6 strategy with stocks ranked according to their past performance into seven portfolios.
Figure 2 – UserForm for Innovative strategies using overlapping periods. Example of
6 2 - Literature review
This section gives a brief literature review on momentum and contrarian strategies, the possible causes pointed out for their abnormal average returns and their contradictions or compatibility.
2.1 – Momentum strategies
It is widely acknowledged that momentum strategies can generate significant profits. Jegadeesh and Titman (1993) is the first academic study that provides evidence on abnormal returns in the US market by using momentum strategies. Specifically, it consists of buying stocks that provided high returns over the previous three to twelve months and selling stocks that produced low returns over the same period. This strategy allows investors to earn profits of around one percent per month during the following year. Momentum strategy tries to take advantage of the market’s under-reaction as it usually takes one to twelve months to incorporate the new information into prices, allowing “return continuation” on medium-term periods.
Research on momentum strategies has also been conducted in other countries.
Rouwenhorst (1998) provided evidence of momentum profits in the European market and was the first one to develop international evidence of momentum profits at the individual stock level. The time period under analysis was from 1980 to 1995 and the sample was composed of 2190 stocks from twelve European countries: Austria, Belgium, Denmark, France, Germany, Italy, Norway, Spain, Sweden, Switzerland, the Netherlands and United Kingdom. This international momentum strategy yields one percent profit per month after accounting for the risk. Moreover, momentum profits are presented in each of the twelve countries used in the sample and last around one year. Not only is return continuation present in all size deciles, but it is negatively related to firm size, and therefore small firms hold higher return continuation than large ones. The results obtained are very similar to those of the previous study by Jegadeesh and Titman on the United States stock market, thus suggesting an exposure to a common component that may be driving the profitability of these strategies. The findings of this paper reinforce the idea of market inefficiency and make it clear that results obtained on the U.S. market were not achieved by chance. The same author also found momentum profitability in 6 out of a sample of 20 emerging equity markets.
7 Some controversy is found in the Australian stock market: some authors support the idea that momentum strategies are profitable and statistically significant (Liew and Vassalou, 2000; Hurn an Pavlov, 2003; Demir, Muthuswamy, and Walter, 2004), while others take a contrasting position, showing evidence that momentum profits do not exist using monthly data (Durand, Limkriangkrai and Smith, 2006). The contradictory results seem to have two possible explanations: the test-period used in the sample, and seasonality in returns. Using daily data, Durand, Limkriangkrai and Smith (2006) find momentum profits during the 1990-2001 period but do not find this evidence for the period from 1980 to 1990-2001. Thus, the momentum effect in the Australian stock market seems to be limited to the recent past. Recently Kassimatis (2008) provided evidence supporting that the momentum effect and Fama-French factors apparently do not work in the Australian stock market.
The profitability of momentum strategies was documented for Canada, (Foerster, Prihar, and Schmitz, 1995). They followed a similar procedure to Jegadeesh and Titman analyzing data from 1978 to 1993. Further evidence was provided by Korkei and Plas (1995) and Kan and Kirikos (1996) supporting momentum profits in the Canadian market. Nevertheless, Sean and Inglis (1998) show that momentum profits in Canada represent an adequate reward for risk and that these risk premiums vary over time. They also point out that momentum strategies may not work for a simple common investor due to the high transactions costs.
Studies on the Asian stock market prove that momentum strategies are profitable in all Asian countries except Korea and Japan (Chui, Titman, and Wei, 2000). However, some studies contradict these findings: abnormal profits were obtained with short-term momentum strategies in the Japanese equity market (Chang, McLeavey, and Rhee, 1995); Wu (2004) provides evidence that in general a pure momentum investment strategy in the Chinese stock market does not yield excess returns.
A paper focused on the past returns of national stocks indices showed that momentum strategies provide higher abnormal returns in emerging countries in Africa, Latin America, Asia, Europe and Middle East than for develop countries (Urritia Jorge L. and Vu Joseph D., 2004).
A study on the Istanbul Stock Exchange analyzed the period from 1991 to 2000 and proved that there are some profitable momentum strategies. Nevertheless, the contrarian strategies give higher returns (Bildik and Gülay, 2002, 2007).
8 The most relevant in depth study on the investigation of momentum profits in the Portuguese stock market is that of Soares and Serra (2005). The sample included 82 stocks over the period from 1988 to 2003 (16 years). The main findings obtained from ranking the stocks into five quintiles demonstrate the profitability of momentum strategies for short-term horizons up to 12 months; this is consistent with the results of Jegadeesh and Titman (1993, 2001). The momentum effects persist after risks have been accounted for and seem to be related to an insufficient response to the announcements of earnings. Nevertheless, most results are not statistically significant.
Moreover, a few studies have also addressed the Portuguese stock market in their study of international momentum profitability such as “Global Momentum Strategies – A Portfolio Perspective” done by Griffin, Ji and Martin (2003) that states that momentum profits do not exist for a 5% statistical significance level.
Table 1 – Studies documented on momentum strategies
Sample Authors Momentum profits -
Exist or not?
U.S.A. Jegadeesh and Titman (1993,2001) Yes
Australia
Liew and Vassalou (2000) Yes
Hurn an Pavlov (2003) Yes
Demir, Muthuswamy and Walter (2004) Yes Durand, Limkriangkrai and Smith (2006) Yes/No
Kassimatis (2008) No Austria Rouwenhorst (1998) Yes Belgium Denmark France Germany Italy Norway Spain Sweden Switzerland The Netherlands The U.K.
9
Korkei and Plas (1995) Yes
Kan and Kirikos (1996) Yes
Sean and Inglis (1998) Yes/No
All Asian countries Chui, Titman, and Wei (2000) Yes, except for Korea and Japan
China Wu Yangru (2004) No
Japan Chang, McLeavey and Rhee (1995) Yes
Malaysia Hameed and Ting (2000) Yes
Turkey Bildik and Gülay (2002,2007) Yes
Portugal Griffin, Ji and Martin (2003) No
Soares and Serra (2005) Yes
Moreover, industry momentum investment was studied by Moskowitz and Grinblatt (1999) who provided evidence on the high profitability of industry momentum strategies (to buy past winner industry portfolios and to sell past loser industry portfolios), even after taking into account the individual stock momentum, possible microstructure weights, book-to-market equity, size and cross-sectional dispersion in mean returns. Industry momentum is stronger than individual stock momentum in the short-term (one month period) and after 12 months tends to disappear, and may reverse in the long run reverse. Industry momentum profits are therefore supported by behavioural models.
In an attempt to identify industry momentum profits and its sources, Pan, Liano and Huang used weekly returns from 1962 to 1998 and the results clearly showed significant positive profits, especially for periods of less than four weeks (short-term horizon).
2.2 - Contrarian strategies
The international evidence on the profitability of contrarian strategies is scarcer.
According to De Bondt and Thaler (1985, 1987) there are return reversals over long periods in the US market. Considering a formation period of three to five years, firms with lower past performance outperformed the companies with higher past performance during the following three to five years (holding period).
However, there is also some evidence that return reversal also occurs on shorter periods (months, weeks and days) according to the papers by Jegadeesh (1990) and Lehmann (1990)
10 who rely on the overreaction arguments, and the works of Jegadeesh and Titman (1991) and Lo and Mackinlay (1990) who do not support the idea that return reversals are due to overreaction. Short-term abnormal returns on contrarian strategies were also found in the Japanese market (Chang, McLeavey, and Rhee, 1995).
Power et al. (1991), McDonald and Power (1991) provided evidence of contrarian profits in the United Kingdom market. Later, Campbell and Linmack (1997) analyzed the U.K. stock market from the period 1979 to 1990 and also found that contrarian strategies yielded abnormal returns until one year period after portfolio formation. They also documented that the size was not a suitable explanation for the contrarian profits since the smallest winning companies did not present any return reversal (conversely to the smallest losing companies who experienced abnormal returns in the subsequent 12 months after portfolio formation. Mai (1995) conducted a study in the French stock market and also found contrarian profits. In Spain there are two notable works published on this matter: Alonso and Rubio (1990) and Forner and Marhuenda (2003). The latter study indicates that the three-year contrarian strategy provides positive abnormal returns but is not statistically significant, thus contradicting the evidence provided by Alonso and Rubio (1990). The five-year contrarian strategy shows significant profits even after accounting for the risk. Nevertheless, this result raises some suspicion when non-overlapping test periods are applied.
In the emerging markets there is also evidence that points to the profitability of contrarian strategies.
Contrarian profitability was documented in the Turkish market (Bildik and Gülay, 2002, 2007). Analyzing the period from 1991 to 2000, they proved that there is a “winners and losers effect” in the Turkish stock market (there is an average 1.14% return difference between top losers and top winners in the 10 year period under analysis). Accordingly, it is in consonance with the overreaction hypothesis, also explained in part by behavioural models and to some extent by factors such as market, size, price, book-to-market and earnings-per-price. It is most probably a size phenomena helped by other factors. Significant contrarian profits are partially explained by the risk factors of the Fama and French model: market, HML (High minus Low) and SMB (Small minus Big). Nevertheless, contrarian profits still exist after accounting for risk. They go even further by stating that new explanations and risk
11 factors have to be used to explain this phenomenon. Evidence found indicates that the longer the holding period the higher the returns.
In Brazil, Da Costa (1994) also found evidence for the arbitrage profits of contrarian strategies.
A study conducted in the Chinese stock market reveals that a pure contrarian investment strategy outperforms a pure momentum investment strategy and shows positive excess returns (Wu, 2004). Furthermore, the results obtained support the over-reaction hypothesis.
As with momentum strategies, very few studies have analyzed the predictability of Portuguese stock returns for long-term horizons based on past performances using long term-strategies. Specifically, just two papers have studied the contrarian profitability in the Portuguese stock market. Alves and Duque (1996) obtain inconclusive results after executing long-term strategies using a small sample of Portuguese stocks for the period from 1989 to 1994.
A broader study was carried out by Soares and Serra (2005) and analyzed a sample of 82 stocks from 1988 to 2003 (16 years). The main results show a negative self correlation between formation period returns and holding period returns, thus supporting the over-reaction hypothesis. Furthermore, contrarian strategies provide greater profitability. However, most results are not statistically significant
12 Table 2 – Studies documented on contrarian strategies
Countries Authors
Contrarian profits - Exist or not?
U.S.A De Bondt and Thaler (1985,1987) Yes
U.K.
Power et al. (1991) Yes
McDonald and Power (1991) Yes
Campbell and Linmack (1997) Yes
France Mai (1995) Yes
Spain
Alonso and Rubio (1990) Yes
Forner and Marhuenda (2003) Yes/No Turkey Bildik and Gülay (2002,2007) Yes
Brazil Da Costa (1994) Yes
China Wu (2004) Yes
Japan Chang, McLeavey, and Rhee (1995) Yes
Portugal Alves and Duque (1995) Yes/No
Soares and Serra (2005) Yes
Momentum and Contrarian strategies – causes
Behavioural models and cognitive psychology are commonly used to explain the abnormal returns from momentum and contrarian strategies.
Momentum strategies are usually associated to under-reaction which assumes that stocks show self-correlations over periods from one to twelve months, and thus gradually incorporate it into prices. Good and positive news will have a positive impact on near future returns. For further information see appendixes 9.1 and 9.3.
Contrarian strategies are based on negative self-correlations between long term formation and holding periods (market overreaction). Investors are too optimistic about good news and too pessimistic about bad news which can make the stock prices move away from their fundamental values. As a result, stocks with a long record of bad news tend to become underpriced and have high returns in the subsequent period (and vice-versa). For more details see appendix 9.2 and 9.3.
13 3 - Data
The sample consists of monthly return series of all Portuguese stocks traded on Euronext Lisbon from 1994 to December 2008 (180 months). The period from January 1994 until December 1997 (36 months) is used to analyze past periods (formation periods) whereas the investment period (holding periods) occurs from January 1997 until December 2008 (144 months). The sample is also divided into three samples: 1997-2007 period to study the profitability of returns without the effect of Sub-prime crisis (for further information please see appendix 9.4); the 1997-2002 and 2003-2008 periods are analyzed to strengthen the results by evaluating the time-variation of returns (to know if results are consistent through time or are mainly obtained in just one sub-period). Additionally, it was studied a sample from 1999-2008 in order to use five years’ portfolio formation essential to execute contrarian strategies (due to Bloomberg did not have older data available, previous to 1993) Prices are shown in the Portuguese currency (euro) and are adjusted for stock splits, dividends and right issues.
For a given equity to be included in the sample of Momentum, Contrarian and Innovative strategies, it must have traded continuously for the J months (past period) prior to the formation date, and have been traded at least once during the holding period (k months after portfolio formation). In the “innovative strategy”, there are two options for a stock to be included in the sample: in a sub-strategy it must have been traded continuously for Jm and Js months while in the other sub-strategy it only has to have been traded in Js; and of course trading at least once in the holding period.
The number of stocks in the sample varies between 24 stocks at the beginning of the period analyzed and 57 stocks at the end of the study.
14 4 – Momentum and Contrarian strategies
4.1 – Methodology
Program developed in VBA to automatically execute strategies and give results
A Userform with macros was created in VBA in order to quickly and accurately compute all the desired strategies.
Two methods were applied for the study of Momentum and Contrarian strategies: - Overlapping Method
- Non-Overlapping Method
The Overlapping method is commonly called CAR (Cumulative Abnormal/Market-Adjusted Returns) or AAR (Abnormal Average Returns). When Overlapping method is referred here it means that strategies are executed using overlapping periods and it is also done here the market Adjustment (returns above PSI or PSI-20). The so-called here Non-Overlapping method is the BHAR (Buy and Hold Abnormal Returns), using non-overlapping periods and considering returns above PSI or PSI-20.
Both methods were computed because each presents different advantages and are pertinent and valuable.
The overlapping method is more robust in terms of statistical tests, because it presents the maximum possible number of holding periods in a certain investment time-period, thus giving more reliable results. The non-overlapping method is relevant as it gives the accurate results that an investor would obtain starting to invest in month t and selling the stocks in month w. For instance, suppose a six-month holding period starting in January and ending in December of the same year. Since monthly return series are used, in the non-overlapping method there would be only two holding periods (January-June and July-December), whereas in the overlapping method there would be seven holding periods (January-June, February-July, March-August, April-September, May-October, June-November, July-December). Accordingly, it can be concluded that the non-overlapping method would give the accurate return obtained by an investor using a six month strategy who had started to invest in January and sold their stocks in December, whereas the overlapping method gives a kind of average of
15 the different returns obtained by traders starting to invest in the different months of the investment time period.
The overlapping method consists of the following: at the beginning of each month t, stocks are ranked (descending order) according to their returns over the past m months, then they are selected according to the strategy (momentum which will select the highest past returns’ stocks, or contrarian which will select the lowest past returns’ stocks) and held for the n month holding period. The non-overlapping method is basically the same but has one important difference: instead of ranking and selecting the stocks every single month (irrespective of the holding period), the rank and stock selection is done every n months. These procedures are done for both methods and for four time periods: 2008, 1997-2002, 2003-2008, and 1997-2007. The 1997-2008 period was the initial target period as there was a 12 year (144 months) time period to analyze. Then, to strengthen results and make them more reliable, the period was divided into two sub-periods: 1997-2002 and 2003-2008 (each with 72 months). Finally, taking into account that sub-prime crisis was one of the worst crises with extremely negative impacts in the financial markets, the 2008 year was excluded. By this way were also executed strategies for 1997-2007 (132 months).
Taking into account that VBA applied to excel was used to implement the strategies, this allowed the calculation of many strategies.
Thirty six past periods were considered:
m = from 1 to 36 months
There were sixty holding periods:
n = from 1 to 60 months
The VBA program for any strategy uses three sheets: “Kn Jm” sheet
Firstly, the stock prices are copied from the “Data” sheet to this sheet and then all returns from a certain n and m period (Kn Jm strategy defined) during the 144 months (1997-2008) are computed in another table; the holding period always starts in January 1997.
16 “Kn Jm strategy” sheet
Then, the returns’ table is copied from Kn Jm sheet and is pasted into this sheet with columns and rows transposed. Afterwards, the stocks are ranked according to five equally weighted groups (composed of the same number of stocks) for each m past period. The first group is composed of top winners, i.e. the stocks that performed best in that period (P1 – Portfolio 1), the second comprises the next group of highest ranking stocks (P2 – Portfolio 2), and so on, until the last one (P5 – Portfolio 5) which is formed by the worst performing stocks in that period. When it is not possible to have exactly equal weights (20% of sample’ stocks in each) in a certain period, the extra stocks, are respectively allocated from P1 to P4.
Furthermore, based on rankings, strategies with three and seven portfolios were also executed always trying to find the most profitable strategies.
For a certain t month, the strategy in P1 is based on buying the winner portfolio (according to
m past month stocks’ performance) and holding it for n months; the strategy in P2 is to buy
the second group of highest ranked stocks in the past period and hold them for n months; and so on, until P5 which is composed of the group of stocks with the lowest past returns. In the next holding period, the stocks are ranked again according to the past period defined (m) and then selected and held again for n months. And the same procedure is applied until the end of the investment period (which can be 2008, 2002 or 2007 according to the investment period defined, that can be 1997-2008, 1997-2002, 2003-2008 and 1997-2007).
“Kn Jm results” sheet
For each holding period, the returns obtained in Kn Jm strategy sheet are copied and then pasted to this sheet. After all of them have been executed, the program proceeds to the calculation of:
Mean Returns 97-081
= Average of the returns obtained for all holding periods performed (with n months) during the 1997-2008 period.
Standard Deviation 97-082
= Standard deviation of all holding period returns during the 1997-2008 period.
Mean Returns 97-08 / Standard Deviation 97-08 3
= significance of statistical results to a 95% confidence level.
1 Called “Mean” in the excel document 2
17 Monthly Mean 97-08 4
= Mean returns 97-08 divided by the holding period (n). Monthly Standard Deviation 97-08 5
= Standard deviation
For 1997-2002, 2003-2008 and 1997-2008 periods, only the monthly average returns were performed for all strategies. The standard deviation and the statistical significance was just performed for a few randomly selected strategies which showed high standard deviations and results that were not statistically significant for a 95% level of confidence (these conclusions had already reached for the 1997-2008 period). Hence, it was not worth computing these calculations.
In sum, two methods were used in this paper, namely in this section: Overlapping
Non-Overlapping
Stocks were selected according to their past returns that were ranked and divided into: Three portfolios
Five portfolios Seven portfolios
Each of these three choices corresponds to a different strategy and in which one of the portfolios is equal or almost equally weighted (each portfolio is formed by the same or almost same number of stocks).
The past periods and holding periods computed were respectively: m = [1; 36] months
n = [1; 60] months
The 36 months times the 60 months execute a total of 2160 strategies. Considering the three ways of ranking the stocks, 6480 strategies were computed which totals 12960 possibilities (taking into account the two methods used).
3 Called “Mean/Std Deviation” in the excel document
4 Called “Monthly Mean” in the excel document
18 4.2 – Empirical Findings
The momentum and contrarian strategies studied in this study are based on 36 past months (m periods) and 60 holding months (n periods), and were executed according to three different main rankings: ranking the stocks according to their past performance into three portfolios, five portfolios and seven portfolios. And all strategies were computed with overlapping and non-overlapping methods. Once again it should be stated that in addition to computing all possible strategies, the analysis is based on previously defined reference periods. The transaction and custody costs were only analyzed at the end of this section.
Overlapping method – Five Portfolios – 1997-2008
Concerning the overlapping method and the five portfolios, the first main conclusion for the 1997-2008 period is that P1 (portfolio based on top past winners) is globally 0.39% higher than the P5 (portfolio based on top past losers). The analyses of the holding periods will be divided in short-medium term periods (from one to twelve months) and long-term periods (from 18 to 60 months) because they represent two different situations in terms of returns of losers versus winners. In the short-term (table 3), P1 gives monthly average returns 0.69% higher than P5. The winner portfolios P1 and P2 with monthly average returns of 0.75% and 0.68%, respectively, clearly outperform loser portfolios P4 and P5 which have clearly low returns, 0.16% and 0.06%, respectively. The intermediary portfolio (P3) also gives average profitability, in general 0.49% monthly average returns. Thus, the average monthly returns in the short-term periods undoubtedly show a downward trend from the winner portfolios to the loser portfolios: 0.75% (P1), 0.68% (P2), 0.49% (P3), 0.16% and 0.06%.
Table 3 – Short-term monthly average returns using overlapping periods and five portfolios in which stocks were equally allocated (with just one exception: when the number of stocks was not multiple of 5, the extra stocks were allocated to P1, P2, P3 and P4). The investment period starts in January 1997 and ends in December 2008. The past periods used for the investment decision vary from January 1994 to December 1996 according to the different past periods.
Holding Past P1 P2 P3 P4 P5 Mean P1-P5
K1 J1 0.66% 0.72% 0.13% 0.26% 0.10% 0.37% 0.56%
19 K1 J6 1.44% 0.24% 0.27% -0.16% -0.33% 0.29% 1.77% K1 J9 1.09% 0.38% 0.21% 0.04% -0.28% 0.29% 1.37% K1 J12 0.61% 0.83% 0.35% -0.08% -0.28% 0.29% 0.89% K1 J18 0.63% 0.57% 0.30% -0.17% 0.18% 0.30% 0.45% K1 J24 0.69% 0.23% 0.59% -0.01% -0.01% 0.30% 0.70% K1 J30 0.31% 0.81% 0.44% -0.12% 0.20% 0.33% 0.11% K1 J36 0.29% 0.83% 0.29% -0.15% 0.55% 0.36% -0.26% K3 J1 0.79% 0.41% 0.40% 0.30% 0.08% 0.40% 0.71% K3 J3 1.26% 0.32% 0.19% 0.36% -0.26% 0.38% 1.53% K3 J6 1.16% 0.57% 0.27% 0.06% -0.56% 0.30% 1.73% K3 J9 1.23% 0.43% 0.14% 0.14% -0.42% 0.31% 1.65% K3 J12 0.81% 0.58% 0.59% -0.02% -0.45% 0.30% 1.27% K3 J18 0.79% 0.43% 0.47% -0.21% 0.24% 0.34% 0.55% K3 J24 0.54% 0.66% 0.55% -0.15% 0.01% 0.32% 0.52% K3 J30 0.25% 0.74% 0.61% -0.06% 0.20% 0.35% 0.05% K3 J36 0.40% 0.71% 0.10% 0.05% 0.68% 0.39% -0.28% K6 J1 0.99% 0.59% 0.60% 0.13% 0.16% 0.49% 0.83% K6 J3 1.26% 0.59% 0.30% 0.45% -0.34% 0.45% 1.60% K6 J6 1.17% 0.75% 0.32% 0.22% -0.40% 0.41% 1.57% K6 J9 1.12% 0.61% 0.35% 0.31% -0.34% 0.41% 1.45% K6 J12 0.80% 0.65% 0.56% 0.29% -0.20% 0.42% 1.00% K6 J18 0.73% 0.58% 0.67% -0.02% 0.32% 0.46% 0.42% K6 J24 0.38% 0.80% 0.71% 0.20% 0.06% 0.43% 0.32% K6 J30 0.36% 0.78% 0.60% 0.01% 0.56% 0.46% -0.20% K6 J36 0.50% 0.74% 0.51% 0.02% 0.65% 0.49% -0.15% K9 J1 0.88% 0.72% 0.58% 0.30% 0.16% 0.53% 0.72% K9 J3 1.19% 0.64% 0.44% 0.49% -0.25% 0.50% 1.44% K9 J6 1.00% 0.85% 0.45% 0.32% -0.28% 0.47% 1.29% K9 J9 0.81% 0.88% 0.42% 0.42% -0.18% 0.47% 0.99% K9 J12 0.62% 0.79% 0.71% 0.31% -0.01% 0.48% 0.63% K9 J18 0.55% 0.74% 0.90% 0.07% 0.18% 0.49% 0.37% K9 J24 0.37% 0.85% 0.70% 0.31% 0.18% 0.48% 0.19% K9 J30 0.41% 0.72% 0.72% 0.06% 0.68% 0.52% -0.27% K9 J36 0.52% 0.88% 0.61% 0.14% 0.47% 0.52% 0.05% K12 J1 0.85% 0.79% 0.66% 0.40% 0.09% 0.56% 0.76% K12 J3 1.12% 0.66% 0.50% 0.50% -0.13% 0.53% 1.26% K12 J6 0.84% 0.92% 0.53% 0.39% -0.13% 0.51% 0.96% K12 J9 0.74% 0.90% 0.52% 0.46% -0.02% 0.52% 0.76% K12 J12 0.57% 0.87% 0.73% 0.30% 0.16% 0.53% 0.42% K12 J18 0.50% 0.72% 0.89% 0.33% 0.18% 0.52% 0.32% K12 J24 0.36% 0.81% 0.75% 0.39% 0.34% 0.53% 0.03% K12 J30 0.46% 0.76% 0.83% 0.21% 0.49% 0.55% -0.03% K12 J36 0.57% 0.85% 0.63% 0.26% 0.47% 0.55% 0.10% Mean 0.75% 0.68% 0.49% 0.16% 0.06% 0.43% 0.69%
20 Nevertheless, results obtained are only good if they beat the market. Thus, they were compared with the weighted General Portuguese Stock Index (PSI) and the value-weighted Portuguese Stock Index-20 (PSI-20) which can be seen in table 4 and in appendix 9.5 and 9.6. During the 1997-2008 period, PSI had 0.55% average monthly returns whereas PSI-20 had only 0.16%. This means that Winner portfolios (P1 and P2) outperformed the PSI by 0.20% and 0.13%, respectively, while loser portfolios (P4 and P5) underperformed the PSI by -0.39% and -0.49%, respectively. Considering the poor PSI-20 performance, the comparison with PSI is even more favourable. The winners (P1 and P2) beat the market by 0.59 % and 0.52% per month, respectively, whereas P4 got exactly the same profitability of PSI-20, and only P5 continued to underperform the PSI-20 by 0.11% per month.
Concerning just short-term strategies (holding and formation periods until twelve months) the returns from the top winner portfolio increase considerably from 0.75% (table 3) to 0.97% (please see appendix table 9.7). The top winner portfolio (P1) gives average monthly returns 1.13% higher than the top loser portfolio (P5). The downward trend from the winner portfolios to the loser portfolios is even higher: 0.97% (P1), 0.65% (P2), 0.41% (P3), 0.24% (P4) and -0.16% (P5). From 1997 to 2008, the pure momentum strategies (P1) beat PSI and PSI-20 by monthly average returns of 0.42% and 0.81%, respectively. The top loser portfolio underperformed PSI and PSI-20 by -0.71% and -0.32%.
Table 4 – Monthly average returns on PSI-20 and PSI
PSI-20 Value Weighted Index PSI Value Weighted Index
Monthly 1997-2008 0.16% 0.55%
It is not a good choice to base the investment (for holding periods until 12 months) on the analysis of the past periods over 12 months (18, 24, 30 or 36 months) since the returns are low.
The most profitable strategies in the short-medium term are easily identified (table 3 and figure 3) as the strategies from the top winner portfolio (P1) with one, three or six months in the holding period combined with three, six, or nine months of the past period: K1-J3, K1-J6,
21 average monthly returns). In the nine and twelve holding periods, the strategies on P1 also provide interesting profits, especially on K9-J3 (1.19%) and K12-J3 (1.12%).
The three best investment strategies during 1997-2008 were achieved with top-winner portfolio (P1), particularly with the strategies K1-J6 (1.44%), K3-J3 and K6-J3 both with 1.26% (which can be seen in table 3 and figure 3); they clearly provide attractive monthly returns.
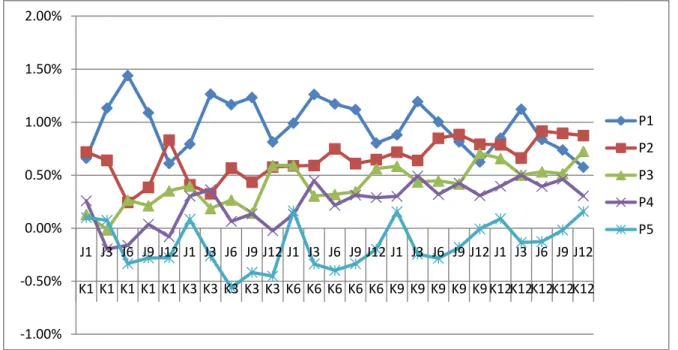
Figure 3 – Monthly average returns from Portfolio 1 (top winner portfolio) to Portfolio 5 (top loser portfolio) for the short-term strategies (formation and holding periods until twelve months).
Regardless of formation and holding periods, considering the 45 short-medium term strategies (Table 5), all winner portfolios (P1 and P2) report positive returns, in P3 just one strategy does not provide positive returns. However, just 33 strategies are profitable in P4 and in P5 almost half of them do not provide positive returns (just 26 strategies are profitable).
Such negative results prove that in short-medium term periods, losers continue to be losers and winners continue to be winners (tables 3 and 5, and figure 3). In general, extreme loser stocks probably face financial distress and in the short-medium term they are not able to solve this problem, thus showing continuing underperformance.
-1.00% -0.50% 0.00% 0.50% 1.00% 1.50% 2.00% J1 J3 J6 J9 J12 J1 J3 J6 J9 J12 J1 J3 J6 J9 J12 J1 J3 J6 J9 J12 J1 J3 J6 J9 J12 K1 K1 K1 K1 K1 K3 K3 K3 K3 K3 K6 K6 K6 K6 K6 K9 K9 K9 K9 K9 K12K12K12K12K12 P1 P2 P3 P4 P5
22 Moreover, in P1 and P2 most strategies beat the market (PSI), in P3 just 20 generate returns above the PSI; on the other hand, in P4 and P5 (the loser portfolios) the strategies that outperform the market are not even one and four, respectively.
Table 5 – Number of short-term strategies with positive returns, returns above PSI and returns above PSI-20.
Number of strategies P1 P2 P3 P4 P5
Positive returns 45 45 44 33 26
Positive returns above PSI 31 38 20 0 4
Positive returns above PSI-20 45 45 41 23 17
It is also found that almost all investment strategies computed with winner portfolios (P1 and
P2) produce higher returns than loser portfolios (P4 and P5) with the exceptions of 6 for P1
(but all of these with past periods of 30 or 36 months) and the notable exception in P2 for the
K3-J3 strategy.
The highest return differences between extreme winners and losers occur in strategies K1-J6 and in K3-J6 where P1 is 1.77% and 1.73%, respectively, higher than P5. The lowest return differences between P1 and P5 arise in K12-J24 (0.09%) and K12-J30 (0.03 and -0.03%, respectively). This can be seen in table 3.
In short, the most profitable choice is the evaluation of the past performance based on the last quarter, six months or nine months and then investing for one, three or six months always focusing on the extreme winner stocks (table 3 and figure 3).
The evidence provided here clearly shows that short term strategies provide abnormal returns. These results are in accordance with previous studies already mentioned in the literature review. Momentum profits were also found by Soares and Serra (2005) for the Portuguese stock market, although they found weak evidence in favour of it after controlling for risk. Considering the medium-long term strategies, the evidence provided by previous studies in other countries shows that as formation and holding periods become longer, loser stocks start to outperform the winner stocks. However, results are somewhat mixed as the holding period and the past return extend to long periods in the Portuguese stock market (table 6). It is not easy to identify a trend. In some strategies, winners beat losers while in others the opposite
23 occurs, i.e. losers outperform winners. In many strategies, the returns generated by top winners and top losers are very similar to each other.
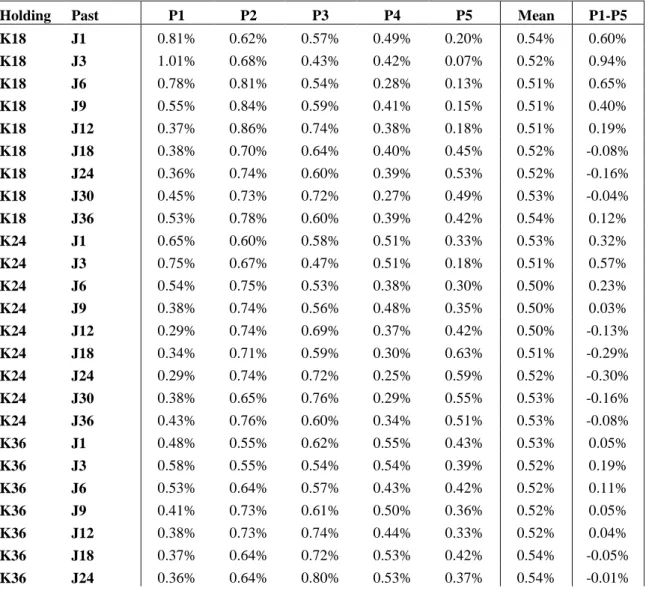
In general, the average monthly return difference between top winners and top losers is 0.09% in favour of the former; and on average strategies perform best in P2 and P3 (mean of 0.66% and 0.62%, respectively). The overall mean return from all these strategies is 0.50%.
The best investment strategies here consist of the investment in top-winners in strategy
K18-J3 (1.01%); and in the intermediate portfolio (P3) in strategy K60-K18-J36 (0.93%).
The highest return difference between extreme winners and extreme losers is achieved in
K18-J3 strategy and is 0.94% (in favour of the winners).
Table 6 - Long-term monthly average returns using Five Portfolios (1997-2008) and Overlapping Periods.
Holding Past P1 P2 P3 P4 P5 Mean P1-P5
K18 J1 0.81% 0.62% 0.57% 0.49% 0.20% 0.54% 0.60% K18 J3 1.01% 0.68% 0.43% 0.42% 0.07% 0.52% 0.94% K18 J6 0.78% 0.81% 0.54% 0.28% 0.13% 0.51% 0.65% K18 J9 0.55% 0.84% 0.59% 0.41% 0.15% 0.51% 0.40% K18 J12 0.37% 0.86% 0.74% 0.38% 0.18% 0.51% 0.19% K18 J18 0.38% 0.70% 0.64% 0.40% 0.45% 0.52% -0.08% K18 J24 0.36% 0.74% 0.60% 0.39% 0.53% 0.52% -0.16% K18 J30 0.45% 0.73% 0.72% 0.27% 0.49% 0.53% -0.04% K18 J36 0.53% 0.78% 0.60% 0.39% 0.42% 0.54% 0.12% K24 J1 0.65% 0.60% 0.58% 0.51% 0.33% 0.53% 0.32% K24 J3 0.75% 0.67% 0.47% 0.51% 0.18% 0.51% 0.57% K24 J6 0.54% 0.75% 0.53% 0.38% 0.30% 0.50% 0.23% K24 J9 0.38% 0.74% 0.56% 0.48% 0.35% 0.50% 0.03% K24 J12 0.29% 0.74% 0.69% 0.37% 0.42% 0.50% -0.13% K24 J18 0.34% 0.71% 0.59% 0.30% 0.63% 0.51% -0.29% K24 J24 0.29% 0.74% 0.72% 0.25% 0.59% 0.52% -0.30% K24 J30 0.38% 0.65% 0.76% 0.29% 0.55% 0.53% -0.16% K24 J36 0.43% 0.76% 0.60% 0.34% 0.51% 0.53% -0.08% K36 J1 0.48% 0.55% 0.62% 0.55% 0.43% 0.53% 0.05% K36 J3 0.58% 0.55% 0.54% 0.54% 0.39% 0.52% 0.19% K36 J6 0.53% 0.64% 0.57% 0.43% 0.42% 0.52% 0.11% K36 J9 0.41% 0.73% 0.61% 0.50% 0.36% 0.52% 0.05% K36 J12 0.38% 0.73% 0.74% 0.44% 0.33% 0.52% 0.04% K36 J18 0.37% 0.64% 0.72% 0.53% 0.42% 0.54% -0.05% K36 J24 0.36% 0.64% 0.80% 0.53% 0.37% 0.54% -0.01%