DM
TD
March
|
2018
Nutraceuticals and Functional Foods
for Diabetes and Obesity Control
DOCTORAL THESIS
Vítor Agostinho Rodrigues Spínola
DOCTORAL DEGREE IN CHEMISTRY SPECIALTY IN BIOCHEMISTRY
Vítor Agostinho Rodrigues Spínola
DOCTORAL DEGREE IN CHEMISTRY SPECIALTY IN BIOCHEMISTRY
Nutraceuticals and Functional Foods
for Diabetes and Obesity Control
DOCTORAL THESIS
SUPERVISOR
Paula Cristina Machado Ferreira Castilho
N
UTRACEUTICALS AND
F
UNCTIONAL
F
OODS
FOR
D
IABETES AND
O
BESITY
C
ONTROL
This thesis was conducted at the Organic Chemistry and Natural Products Laboratory of the Madeira Chemistry Center (CQM), University of Madeira, under the supervision of Professor Paula Cristina Machado Ferreira Castilho. The financial support was provided by Fundação para a Ciência e a Tecnlogia (SFRH/BD/84672/2012). This thesis is presented to the University of Madeira, in order to fulfill the requirements necessary to obtain a Doctor Degree (Bologna 3rd Cycle) in Chemistry.
Vítor Agostinho Rodrigues Spínola
March 2018
Dedication
To my Mom.
"and I needed you tonight, but you've gone to heaven
and if you could see me now, would you remember how you use to hold me close how you always felt like home and I know I feel alone but there's an angel looking out for me tonight"
“Somos do tamanho dos nossos sonhos.”
Vítor Spínola (2018) ix
Acknowledgments
First of all, I thank the Centro de Química da Madeira (CQM) and the University of Madeira for the welcoming me and ensuring the necessary conditions/tools for full compliance of all my experiment and written work for my doctoral project.
I would like to express my warmest gratitude to Professor Doctor Paula Cristina M. F. Castilho, my supervisor, for giving me the opportunity to do this work, for the scientific guidance, healthy and rewarding discussions we had and valuable advices that contributed greatly to my scientific development. It has been a long journey since my supervised internship. I am very grateful for her support and for giving me the encouragement to continue on those particular difficult moments and opportunities that you have provided.
To Professor Doctor Helena Tomás for receiving me well in Biochemistry and Cell Culture Laboratory (CQM).
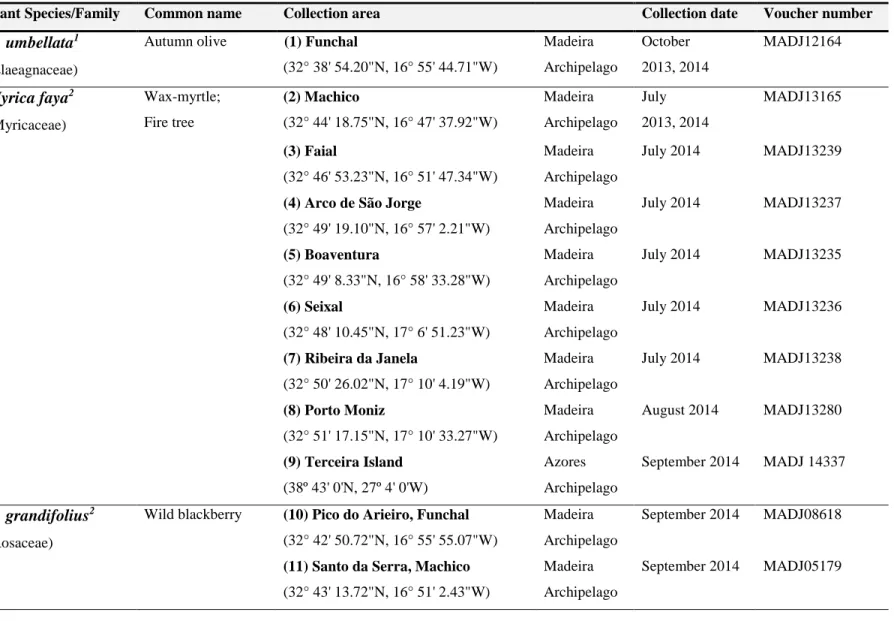
To Madeira Botanical Garden, in particular, Dr. Francisco Fernandes, Dr. José Augusto Carvalho and Dr. Carlos Lobo for the supply, identification and voucher numbers of plants species used in this study.
To Funchal Ecological Park, in particular, Dr. António Ferro Pereira Olival for the license to collect some plant species in their protected area.
To Esmeralda Dias from “A Quintinha das Aromáticas” (Funchal, Madeira) for the kindly supply of autumn olive (Elaeagnus umbellata) samples used in this research.
To Cândida Dias for the collection and supply of wax-myrtle (Myrica faya) and Azores blueberry (V. cylindraceum) samples from the Azores archipelago.
To Professor Doctor María Luisa Fernández-de Córdova, Doctor Lucía Molina-García from the Department of Physical and Analytical Chemistry, University of Jaén, for having contributed with the HPLC-MS analysis for the phytochemical characterization of plant extracts. A special thanks to Professor Doctor Eulogio J. Llorent-Martínez, also from University of Jáen, for all the support, teaching, friendship and fruitful partnership. It has been great doing research with you and I hope we can continue collaborating and publishing in the times to come.
To Professor Doctor Clévio Nóbrega, from the Department of Biomedical Sciences and Medicine, University of Algarve, for kindly providing the NADPH for the human aldose reductase assay, when it was most necessary. Also, many thanks for all those articles sent that I had not access from UMa.
To Doctor Rosa Perestrelo very special thanks for all the support with the HPLC-MS equipment. Thank you also for your teaching and technical help with the HS-SPME/GC-qMs analysis of ceriman (Monstera deliciosa) fruit and principal component analysis (PCA) of obtained data in all research.
To Fundação para a Ciência e Tecnologia (FCT) for the Ph.D. grant (SFRH/BD/84672/2012). Funding is also acknowledged to FCT through the Portuguese Government (Project PEst-OE/QUI/UI0674/2013) and the Portuguese National Mass Spectrometry Network (contract RNEMREDE/1508/REM/2005). The projects PROEQUIPRAM-Reforço do Investimento em Equipamentos e Infraestruturas Científicas na Região Autónoma da Madeira (RAM) 000008) and Centro de Química da Madeira – CQM+ (M1420-01-0145-FEDER-000005, ARDITI), funded by Madeira Regional Operational Programme (MADEIRA 1420) is also acknowledged.
I would also like to acknowledge ASAC (Austrian Society for Analytical Chemistry) for a travel grant to participate in the ISC2014 – 30th International Symposium of Chromatography (Salzburg, Austria).
I want also to show my gratitude to my NATLab colleagues, in particular, Joana Pinto and João Serina for your fellowship and help. A special thank you goes to Gonçalo Martins and Núria Fernandes, for all your patience, support, friendship and great environment. Thank you for the late afternoons moments that we shared and for making me laugh when I needed the most, making this a special journey and much easier to ride.
To Ana Cristina Olival for all your cakes, laughs and good environment. Also thank you for all your assistance with the cell cultures.
I am grateful to Doctor Carla Alves and Rita Castro for the help, availability, and valuable teaching about cell culture procedures and cytotoxicity measurements.
I also acknowledge the help of laboratory technicians Paula Andrade and Paula Vieira for their essential assistance with reagents, materials, equipment and availability.
To my friend Pedro Andrade, thank you for support and dedication shown (even being thousands of kilometers away). Thank you for every word and for every gesture that were essential throughout this last year.
Vítor Spínola (2018) xi
I want to thank my loving parents Agostinho Spínola and Fátima Spínola. Thank you for all your unconditional love, enthusiasm, unmatched care, and for always believing in me. Thank you for my education, transmitted values and work ethics, for pushing me to do better, for being an example, in conclusion, for helping to build the person that I am today.
Finally, a heartfelt and special thanks to Ricardo Garcês for your companionship, huge patience, in good and bad moments, always with a word of encouraging. Thank you for being by my side through this last decade and for never having stopped believing. All the love, continuous affection and support was essential to the completion of this long and arduous task.
Vítor Spínola (2018) xiii
The aim of this work was to study the anti-diabetic potential of different berry-producing plants. Their mineral and phytochemical composition was studied by inductively coupled plasma - mass spectrometry and high-performance liquid chromatography/electrospray ionization tandem mass spectrometry analysis, respectively. A static model to simulate gastrointestinal digestion was employed to analyse the stability of phenolic compounds from targeted species. The mechanism of hypoglycaemic activity was evaluated in terms of in vitro inhibitory action on key digestive enzymes linked to type-2 diabetes (α-,β-glucosidases and α-amylase) and obesity (pancreatic lipase). Additionally, the inhibitory effect towards human aldose reductase and protein glycation, associated with long-term diabetic complications, was determined. The antioxidant activity of methanolic extracts was investigated using four different free radicals (ABTS•+, DPPH•, NO• and O2•-). Finally, the cytotoxicity of analysed species was assessed in Caco-2 cells by the resazurin reduction fluorescence method.
Berry species proved to be good sources of essential minerals, some of which, are known to possess hypoglycaemic effects. Analysed extracts showed diverse phytochemical profiles, anthocyanins, hydroxycinnamic acids, flavonols, flavan-3-ols and ellagitannins being the dominant compounds. Extracts showed a stronger inhibition towards glucosidases and were moderate inhibitors of α-amylase and pancreatic lipase. Potent inhibitory effects were observed in aldose reductase assay and towards formation of advanced glycation end-products. Additionally, good antioxidant activities were observed. Preliminary cytotoxicity measurements revealed that plant extracts can be considered safe for human consumption. The phenolic content and biological activities were substantially affected by the simulated in vitro digestion. Still, positive health effects were verified for digested samples.
The generated data about these berry-producing plants and their potential effect on the management/control of type-2 diabetes and prevention of associated complications may be useful in designing future dietary/nutraceutical strategies aimed at alleviating hyperglycaemia.
Keywords: Type-2 Diabetes; Berry-producing plants; Phenolic Compounds; Enzyme inhibition;
Vítor Spínola (2018) xv
O objectivo deste trabalho foi estudar o potencial antidiabético de diferentes plantas produtoras de bagas. A composição mineral e fitoquímica foi estudada recorrendo, respectivmente, a plasma indutivamente acoplado a espectrometria de massa e cromatografia líquida de alta eficiência com espectrometria de massa. Um modelo estático para simular a digestão gastrointestinal foi utilizado para analisar a estabilidade dos compostos fenólicos das espécies alvo. A actividade hipoglicémica foi avaliada in vitro em enzimas digestivas ligadas à diabetes tipo-2 (α, β-glucosidases e α-amilase) e à obesidade (lípase pancreática). O efeito inibitório sob a actividade da aldose reductase e a glicação de proteínas, associadas a complicações diabéticas, foi também determinado. A actividade antioxidante dos extratos foi investigada usando quatro radicais livres diferentes (ABTS•+, DPPH•, NO• e O2•-). Finalmente, a citotoxicidade das espécies analisadas foi avaliada em células Caco-2 pelo método da redução da resasurina.
As bagas mostraram ser boas fontes de minerais essenciais, alguns com atribuídas capacidades hipoglicémicas. Os extratos analisados apresentaram perfis fitoquímicos diversos, sendo as antocianinas, os ácidos hidroxicinâmicos, os flavonóis, os flavan-3-oís, e os elagitaninos os compostos dominantes. Os extratos demostraram fortes inibições para as glucosidases e foram inibidores moderados da α-amilase e da lipase pancreática. Foram observados potentes efeitos inibitórios no ensaio da aldose reductase e na glicação de proteínas. Adicionalmente, observaram-se boas actividades antioxidantes. A avaliação preliminar da citotoxicidade dos extractos, revelou que são seguros para o consumo humano. O conteúdo fenólico e as atividades biológicas foram substancialmente afectados pela simulação in vitro do processo de digestão. Contudo, foram verificados efeitos positivos para a saúde nas amostras sujeitas à digestão.
Os dados gerados sobre as plantas produtoras de bagas analisadas relativamente ao potencial controlo da diabetes tipo-2 e prevenção de complicações associadas podem ser úteis no desenvolvimento de futuras estratégias dietéticas/nutracêuticas destinadas a aliviar a hiperglicemia.
Palavras-chave: Diabetes tipo-2; Plantas produtoras de bagas; Compostos fenólicos; Inibição
Vítor Spínola (2018) xvii
The present work was developed in the Laboratory of Natural Products and Organic Chemistry (NatLab) of the Madeira Chemistry Centre (CQM), University of Madeira (Portugal). This study arises from the need to investigate the potential effects of edible and non-edible plants on the control/management of type-2 diabetes and obesity, as an alternative to current pharmaceutical drugs. The phytochemical profiles, ability to inhibit key digestive enzymes and protein glycation, and antioxidant activities were studied. The initial work plan of this Ph.D. project consisted of a list of more than 30 plants. Considering the results of an initial screening (yeast α-glucosidase and α-amylase assays), the plant list was shortened and we decided to focus the investigation on berry-producing plants regarding their higher inhibitory activities towards key carbohydrate-hydrolysing enzymes.
For a better understanding, the dissertation is organized in six parts. In Chapter I – Introduction, a general contextualization on the scientific topics addressed in the dissertation is given. Afterwards, Chapter II – Materials and Methods provides an explanation of the procedures and analytical assays conducted in this study. Chapter III – Results and discussion is organized in five sub-chapters: (A) addresses the phytochemical profiles (mineral and phenolic composition) of berry-producing plants under study; (B) concerns the ability of analysed extracts to inhibit the activity of key digestive enzymes linked to type-2 diabetes and obesity; (C) the inhibitory capacity of human aldose reductase activity and bovine-serum albumin glycation by fructose and ribose were assessed; (D) the antioxidant activity of plant extracts was determined against four free radicals by colorimetric assays; (E) a preliminary evaluation of the cytotoxic effects of selected extracts was assessed in Caco-2 cells. Chapter IV – Conclusions and Future Perspective is devoted to the final considerations of this project. Finally, the dissertation is completed with the references used, as well as complementary data.
The central part of this dissertation is formed by four already published scientific papers (I to IV - List of publications). The remaining data are being prepared to submit for publication in international, peer-reviewed journals in the near future. Throughout this study, other articles were published referring to the plant species not included in this dissertation, which are listed in the Curriculum Vitae of the author.
Vítor Spínola (2018) xix A. Research Papers
I. Spínola V., Pinto J., Castilho P. C. (2018) Hypoglycemic, anti-glycation and antioxidant in vitro
properties of two Vaccinium species from Macaronesia: a relation to their phenolic composition.
Journal of Functional Foods, 40: 595 – 605.
II. Pinto J., Spínola V., Llorent-Martínez E. J. et al., (2017) Polyphenolic profile and antioxidant activities of Madeiran elderberry (Sambucus lanceolata) as affected by simulated in vitro digestion. Food Research International, 100P3: 404 – 410.
III. Llorent-Martínez E. J., Spínola, V., Castilho P. C. (2017) Evaluation of the inorganic content of six underused wild berries from Portugal: Potential new sources of essential minerals. Journal of
Food Composition and Analysis, 59: 153 – 160.
IV. Spínola, V., Llorent-Martínez E. J., Gouveia S., Castilho P. C. (2014) Myrica faya: a new source
of antioxidant phythochemicals. Journal of Agricultural and Food Chemistry, 62, 9722-9735.
V. Spínola V., Pinto J., Castilho P. C. Evaluation of wild blackberries (Rubus grandifolius L.)
functions targeting dietary management of type-2 diabetes: inhibitory activity towards digestive enzymes, protein glycation and antioxidant activities using in vitro models (ready to submit).
VI. Spínola V., Castilho P. C. Polyphenols of Myrica faya inhibit key enzymes linked to type II
diabetes and obesity and glycation of proteins (in vitro): potential role in the prevention of diabetic complications (ready to submit).
B. Oral communications
Spínola. V., Llorent-Martínez E. J., Castilho, P. C. Inhibition of human aldose reductase by berries
polyphenos: their potential role in the prevention of diabetic complications. 5th CQM Annual Meeting,
1st -3rd February 2018, Funchal, Portugal
Spínola V., Pinto J., Castilho P. C. Phenolic composition and in vitro inhibitory activities of
plant-producing berries on the generation of advanced glycation end-products. 10th World Congress on
Polyphenols Applications, 29th June – 1st July 2016, Porto, Portugal.
Spínola V., Pinto J., Castilho P. C. Berries from Macaronesia: bioactive components and their
antihyperglycaemia effects. EuroFoodChem XVIII, 13rd – 16th October 2015, Madrid, Spain.
Spínola V., Llorent-Martínez E. J., Gouveia S., Castilho P. C.; Phenolic characterization of Myrica
faya and its relation with antioxidant activity, 1st CQM Annual Meeting, 30th – 31st January 2014,
Funchal, Portugal.
C. Posters Communications
Spínola V., Llorent-Martínez E. J., Gouveia S., Castilho P. C.; Myrica faya: phenolic characterization and antioxidant activity, 8th World Congress on Polyphenols Applications, 4-6th June, Lisbon,
Vítor Spínola (2018) xxi
Acknowledgments ... ix Abstract ... xiii Resumo ... xv Preamble ... xvii List of publications ... xix General Index ... xxi Index of Figures ... xxv Index of Tables ... xxviii Abbreviations ... xxxi
Chapter I - Introduction ... 1
1. Diabetes ... 3 1.1. Carbohydrate Metabolism and Glucose homeostasis ... 4 1.2. Pathogenesis of Type-2 Diabetes ... 7 1.3. Oxidative stress and Type-2 Diabetes ... 7 1.4. Treatment of Type -2 Diabetes ... 9 2. Phenolic Compounds and Type-2 Diabetes ... 13 2.1. Phenolic Compounds ... 13 2.2. Digestion, Absorption and Metabolism of Phenolic Compounds ... 17 2.3. Phenolic Compounds as Potential Anti-diabetic Agents ... 19 3. Berries ... 25 3.1. Phenolic Compounds in Berries ... 25 3.2. Anti-diabetic Potential of Berries ... 27 3.3. Berries from Madeira Archipelago ... 29 4. Extraction and Characterization of Phenolic Compounds... 34 4.1. Sample preparation ... 34 4.2. Extraction ... 34 4.3. Isolation, fractionation and purification ... 35 4.4. Determination of Phenolic Compounds ... 36
4.5. Antioxidant Activity (AOA) Evaluation of Phenolic Compounds ... 37
Chapter II – Materials and Methods ... 41
1. Materials ... 43 1.1. Plant Material ... 43 1.2. Chemicals and reference compounds ... 47 2. Methods ... 47 2.1. Total soluble solids (TSS) determination ... 47 2.2. Moisture content determination... 48
2.3. Determination of mineral content by inductively coupled plasma-mass
spectrometry (ICP-MS) ... 48 2.4. Preparation of methanolic extracts ... 49 2.5. In vitro simulation of gastrointestinal digestion ... 49
2.6. HPLC-DAD-ESI/MSn analysis of methanolic extracts ... 50 2.7. Total phenolic and flavonoid contents ... 52 2.8. In vitro enzyme inhibitory assays ... 53
2.9. In vitro evaluation of anti-glycation potential of methanolic extracts ... 55
2.10. In vitro Antioxidant Assays ... 56 2.11. Cytotoxicity evaluation of the methanolic extracts ... 57 2.12. Statistical Analysis ... 58
Chapter III – Results and Discussion ... 59 A. Phytochemical Composition ... 59
1. Physico-chemical analysis ... 62 1.1. Total soluble solids (TSS) determination ... 62 1.2. Moisture content ... 63 2. Determination of berries mineral content by inductively coupled plasma-mass
spectrometry (ICP-MS) ... 64 2.1. Elaeagnus umbellata ... 66
2.2. Myrica faya ... 66
Vítor Spínola (2018) xxiii
2.5. Vaccinium cylindraceum ... 67
2.6. Vaccinium padifolium ... 68
2.7. General discussion ... 68 3. Extraction of Phenolic Compounds (PCs)... 69 4. HPLC-DAD-ESI/MSn analysis of methanolic extracts ... 71 4.1. Elaeagnus umbellata ... 73 4.2. Myrica faya ... 79 4.3. Rubus grandifolius ... 91 4.4. Sambucus lanceolata ... 99 4.6. Vaccinium cylindraceum ... 103 4.7. Vaccinium padifolium ... 108 4.1. General discussion ... 119 5. Total phenolic and total flavonoid contents ... 126 5.1. Pre-in vitro gastrointestinal digestion ... 126 5.2. Post in vitro gastrointestinal digestion ... 129 5.3. General discussion ... 131
B. Digestive Enzymes Inhibition ... 133
1. Inhibition of digestive enzymes responsible for the sugar metabolism ... 135 1.1. Glucosidases (GLUs) ... 135 1.2. Pancreatic α-Amylase (AMY) ... 139 1.3. Pancreatic Lipase (PL) ... 140 1.4. General Discussion ... 142
C. Aldose Reductase and Protein Glycation Inhibition ... 151
1. Inhibition of Human Aldose Reductase (HAR) activity ... 153 1.1. Pre-in vitro gastrointestinal digestion ... 153 1.2. Post in vitro gastrointestinal digestion ... 154 1.3. General Discussion ... 155 2. Inhibition of Advanced Glycation End-Products (AGEs) Formation ... 157 2.1. Pre-in vitro gastrointestinal digestion ... 157
2.2. Post in vitro gastrointestinal digestion ... 159 2.3. General Discussion ... 161
D. Antioxidant Activity ... 165
1. Antioxidant Activity (AOA) ... 167 1.1. ABTSRadical (ABTS•+) Scavenging Assay ... 167 1.2. DPPH• Radical Scavenging Assay ... 169 1.3. NO• Radical Scavenging Assay ... 171 1.4. O2•- Radical Scavenging Assay ... 172 1.5. General Discussion ... 173
E. Cytotoxicity Profiles ... 181
1. Cytotoxicity evaluation of the methanolic extracts ... 183 1.1. Pre-in vitro gastrointestinal digestion ... 183 1.2. Post in vitro gastrointestinal digestion ... 184 1.3. General Discussion ... 185
Chapter IV – Conclusions and Future Perspectives ... 189
1. Conclusions ... 191 2. Future Perspectives ... 193
References ... 195 Supplementary Material ... 213
1. Identification of phytochemicals of methanolic extracts………...227 1.1. Elaeagnus umbellata ... 227 1.2. Myrica faya ... 238 1.3. Rubus grandifolius ... 250 1.4. Sambucus lanceolata ... 260 1.5. Vaccinium cylindraceum ... 269 1.6. Vaccinium padifolium ... 279
Vítor Spínola (2018) xxv Figure 1 – Prevalence of Diabetes mellitus worldwide and per region in 2017 and 2045 (20 – 79
age group). ... 3
Figure 2 – Maintenance of glucose homeostasis by insulin and glucagon regulatory action... 6 Figure 3 – Overall pathophysiology of T2DM development, with hyperglycaemia and oxidative
stress as the key central mechanisms responsible for the development and progression of diabetic complications. ... 8
Figure 4 - Chemical structure of acarbose (1) and orlistat (2)... 10 Figure 5 - Chemical structures of 1-deoxynojirimycin (1) and miglitol (2). ... 12 Figure 6 – Basic chemical structures of main dietary of phenolic compounds. ... 15 Figure 7 – Potential health benefits of phenolic compounds on management/control of
hyperglycaemia in T2DM ... 20
Figure 8 – The polyol pathway flux. In hyperglycaemia conditions, glucose is sequentially
reduced to sorbitol and fructose by the combined action of human aldose reductase (HAR) and sorbitol dehydrogenase (SDG). ... 22
Figure 9 – Non-enzymatic protein glycation pathways leading to formation of advanced glycation
end-products (AGEs) adducts.. ... 23
Figure 10 – The phenolic composition of some berries. ... 26 Figure 11 - Location of Madeira and Azores archipleagos in the North Atlantic Ocean. ... 29 Figure 12 – Elaeagnus umbellata. ... 30 Figure 13 – Myrica faya ... 30 Figure 14 – Rubus grandifolius. ... 31 Figure 15 - Sambucus lanceolata ... 32 Figure 16 – Vaccinium cylindraceum. ... 32 Figure 17 – Vaccinium padifolium. ... 33 Figure 18 – Different mechanisms of action of phenolic compounds ... 38 Figure 19 - Collection area of analyzed berry-plant species from Madeira Island.. ... 44 Figure 20 - Collection area of M. faya and V. cylindraceum from Azores archipelago. ... 44 Figure 21 – Overview of the work carried out in this thesis.. ... 47 Figure 22 - Extraction efficiency of different extraction conditions determined by TPC in Myrica
faya leaves ... 69
Figure 23 – Chemical structures of the main flavom-3-ols and ellagitannins identified in the
analysed methanolic extracts. ... 72
Figure 24 – Representative base peak chromatogram (BPC) of the HPLC-ESI-/MSn analysis of
E. umbellata (collected in 2014) methanolic extracts (berries and leaves)………..73
Figure 26 – Representative base peak chromatogram (BPC) of the HPLC-ESI-/MSn analysis of
M. faya methanolic extracts (berries and leaves). ... 79
Figure 27 - Representative base peak chromatogram (BPC) of the HPLC-ESI+/MSn analysis of
M. faya methanolic extracts (berries). ... 79
Figure 28 - Phenolic composition of M. faya extracts (pre- and post-in vitro digestion).. ... 80 Figure 29 – Representative base peak chromatogram (BPC) of the HPLC-ESI-/MSn analysis of
R. grandifolius methanolic extracts (berries) collected in two different locations. ... 91
Figure 30 - Representative base peak chromatogram (BPC) of the HPLC-ESI-/MSn analysis of R.
grandifolius methanolic extracts (leaves) collected in two different locations. ... 92
Figure 31 - Representative base peak chromatogram (BPC) of the HPLC-ESI+/MSn analysis of
R. grandifolius methanolic extracts (berries) collected in two different locations. ... 92
Figure 32 - Phenolic composition of R. grandifolius extracts (pre- and post-in vitro digestion).
... 93
Figure 33 - Representative base peak chromatogram (BPC) of the HPLC-ESI-/MSn analysis of S.
lanceolata methanolic extracts (berries and leaves).. ... 99
Figure 34 - Representative base peak chromatogram (BPC) of the HPLC-ESI+/MSn analysis of
S. lanceolata (berries) methanolic extracts.. ... 99
Figure 35 - Phenolic composition of S. lanceolata extracts (pre- and post-in vitro digestion) .100 Figure 36 – Representative base peak chromatogram (BPC) of the HPLC-ESI-/MSn analysis of
V. cylindraceum methanolic extracts (berries and leaves). ... 103
Figure 37 – Representative base peak chromatogram (BPC) of the HPLC-ESI+/MSn analysis of
V. cylindraceum methanolic extracts (berries). ... 104
Figure 38 - Phenolic composition of V. cylindraceum extracts (pre- and post-in vitro digestion)
... 104
Figure 39 – Representative base peak chromatogram (BPC) of the HPLC-ESI-/MSn analysis of
V. padifolium methanolic extracts (berries and leaves). ... 108
Figure 40 – Representative base peak chromatogram (BPC) of the HPLC-ESI+/MSn analysis of
V. padifolium methanolic extracts (berries and leaves). ... 109
Figure 41 - Phenolic composition of V. padifolium extracts (pre- and post-in vitro digestion).
... 110
Figure 42 - Individual phenolic content (IPC) of analysed berries extracts (mg g-1 DE). ... 119
Figure 43 - Individual phenolic contents (IPC) of analysed leaves extracts (mg g-1 DE). ... 120
Figure 44 - Individual phenolic contents (mg g-1 DE) of digested berries extracts. ... 121
Figure 45 – Individual phenolic contents (mg g-1 DE) of digested leaves extracts. ... 122
Vítor Spínola (2018) xxvii Figure 47 - Total phenolic content (TPC) of analysed leaves extracts (mg GAE g-1 DE) determined by the Folin-Ciocalteu method. ... 127
Figure 48 - Total flavonoid content (TFC) of analysed berries extracts (mg RUE g-1 DE) determined by the aluminium chloride method. ... 127
Figure 49 - Total flavonoid content (TFC) of analysed leaves extracts (mg RUE g-1 DE) determined by the aluminium chloride method. ... 128
Figure 50 - Total phenolic content (TPC) (mg GAE g-1 DE) of analysed berries extracts (pre- and post in vitro digestion) determined by the Folin-Ciocalteu method. ... 129
Figure 51 - Total phenolic content (TPC) (mg GAE g-1 DE) of analysed leaves extracts (pre- and post in vitro digestion) determined by the Folin-Ciocalteu method. ... 129
Figure 52 - Total flavonoid content (TFC) (mg RUE g-1 DE) of analysed berries extracts (pre- and post in vitro digestion) determined by the aluminium chloride method.. ... 130
Figure 53 - Total flavonoid content (TFC) (mg RUE g-1 DE) of analysed leaves extracts (pre- and post in vitro digestion) determined by the Aluminium chloride method. ... 130
Figure 54 - Chemical strucutre of Conduritol B epoxide (CBE) ... 139 Figure 55 – Chemical structure of aminoguanidine (AMG), an experimental drug for the
treatment of nephropathy. ... 157
Figure 56 – Simplified mechanism of advanced glycation end-products (AGEs) pathology.. 163 Figure 57 – Main structure-activity relationship of flavonoids. ... 177 Figure 58 – Potential mechanisms of the anti-cancer activities of dietary phenolic compounds
Index of Tables
Table 1 - Main oral anti-diabetic drugs, their mechanisms of action and side effects. ... 11 Table 2 - Summary of in vitro studies showing the potential anti-diabetic effect of different
berries. ... 27
Table 3 – Information of berry-producing plants under study (origin, collection date, voucher
numbers). ... 45
Table 4 - Composition of simulated gastrointestinal juices ... 50 Table 5 – Operation conditions of HPLC-DAD-ESI/MSn analysis. ... 51
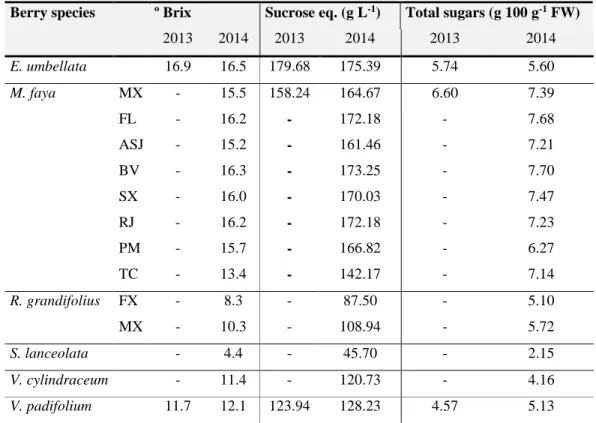
Table 6- Content of total soluble solids (TSS) and total sugars of berries under study. ... 62 Table 7- Moisture content (%) of berry-producing plants (BPPs) under study. ... 63 Table 8 - Average mineral content of analysed berries (µg g-1 of FW) determined by inductively coupled plasma-mass spectrometry (ICP-MS).. ... 65
Table 9 – Mineral percentage (%) contribution for RDA of analysed berry species. ... 66 Table 10 – Extraction yield (%) of berry-producing plants (BPPs) under study (pre- and post in
vitro gastrointestinal digestion). ... 70
Table 11 – Regression curves and linearity of selected standards used for quantification purposes
... 71
Table 12 – Quantification (mg g-1 DE) of main phenolic compounds present in E. umbellata extracts (berries and leaves) collected in two consecutive years. ... 75
Table 13 - Quantification of main polyphenolic compounds present in E. umbellata (mg g-1 DE) before and after in vitro gastrointestinal digestion. ... 77
Table 14 - Quantification (mg g-1 DE) of main phenolic compounds present in M. faya extracts (berries) collected in eight different locations. ... 82
Table 15 – Quantification (mg g-1 DE) of main phenolic compounds present in M. faya extracts (leaves) collected in eight different locations.. ... 85
Table 16 - Quantification of main phenolic compounds present in M. faya (mg g-1 DE) before and after in vitro gastrointestinal digestion. ... 88
Table 17 - Quantification (mg g-1 DE) of main phenolic compounds present in R. grandifolius extracts (leaves and berries) collected in two different locations. ... 94
Table 18 - Quantification of main phenolic compounds (mg g-1 DE) present in R. grandifolius (Funchal, FX) before and after in vitro gastrointestinal digestion. ... 97
Table 19 - Quantification (mg g-1 DE) of main phenolic compounds of S. lanceolata extracts (berries and leaves) before and after in vitro gastrointestinal digestion. ... 101
Table 20 - Quantification (mg g-1 DE) of main phenolic compounds of V. cylindraceum extracts (berries and leaves) before and after in vitro gastrointestinal digestion. ... 105
Vítor Spínola (2018) xxix Table 21 - Quantification (mg g-1 DE) of main phenolic compounds present in V. padifolium extracts (berries and leaves). ... 112
Table 22 - Quantification (mg g-1 DE) of main phenolic compounds present in V. padifolium extracts (berries and leaves) before and after in vitro gastrointestinal digestion. ... 116
Table 23 – In vitro inhibitory activities of analysed extracts towards α- and β-glucosidases
(expressed as IC50 value, mg mL-1). ... 136
Table 24 - In vitro inhibitory activities of analysed extracts and reference compounds towards
porcine pancreatic α-amylase (expressed as IC50 value, mg mL-1). ... 140
Table 25 - In vitro inhibitory activities of analysed extracts and reference compounds towards
porcine pancreatic lipase (expressed as IC50 value, mg mL-1).. ... 141
Table 26 – Pearson’s correlation coefficients (r) between digestive enzymes inhibitory assays
and phenolic composition of analysed extracts ... 143
Table 27 - Pearson’s correlation coefficients (r) between digestive enzymes inhibitory assays and
phenolic composition of analysed berry-producing plants.. ... 144
Table 28 - In vitro inhibitory activities of analysed extracts towards human aldose reductase
(expressed as IC50 value, mg mL-1). ... 154
Table 29 - Pearson’s correlation coefficients (r) between human aldose reductase (HAR)
inhibitory assay and phenolic composition of analysed berry-producing plants (BPPs) (pre- and post in vitro digestion). ... 156
Table 30 - In vitro inhibitory activities of analysed extracts towards BSA glycation (expressed as
IC50 value, mg mL-1).. ... 159
Table 31 – In vitro inhibitory activities of analysed extracts towards BSA-glycation, pre- and post
in vitro gastrointestinal digestion (expressed as IC50 value, mg mL-1). ... 160
Table 32 - Pearson’s correlation coefficients (r) between protein glycation inhibitory assays and
phenolic composition of analysed berry-producing plants (BPPs) (pre-in vitro digestion). ... 161
Table 33 - Pearson’s correlation coefficients (r) between protein glycation inhibitory assays and
phenolic composition of analysed berry-producing plants (BPPs) (post in vitro digestion). .... 162
Table 34 - In vitro antioxidant activities of analysed extracts measured by the ABTS•+ scavenging assay (expressed as mmol TE g-1 DE). ... 168
Table 35 – In vitro antioxidant activities of analysed extracts measured by the DPPH• radical scavenging assay (expressed as mmol TE g-1 DE) ... 170
Table 36 - In vitro antioxidant activities of analysed extracts measured by the NO• radical scavenging assay (expressed as mmol TE g-1 DE). ... 171
Table 37 - In vitro antioxidant activities of analysed extracts measured by the O2•- radical scavenging assay (expressed as mmol TE g-1 DE). ... 173
Table 38 - Pearson’s correlation coefficients (r) between antioxidant activity (AOA) assays and
phenolic composition of analysed berry-producing plants (BPPs) (pre-in vitro digestion). ... 175
Table 39 - Pearson’s correlation coefficients (r) between antioxidant activity (AOA) assays and
phenolic composition of analysed berry-producing plants (BPPs) (post in vitro digestion). .... 176
Table 40 – Cytotoxicity of analysed methanolic extracts towards Caco-2 cell lines after 24 hours
of exposure. Values are expressed as IC50 (mg mL-1). ... 184
Table 41 - Pearson’s correlation coefficients (r) between cytotoxicity assay and phenolic
Vítor Spínola (2018) xxxi A
ABTS 2,2′-Azinobis-(3-ethylbenzthiazoline-6-sulfonic acid)
AGEs Advanced glycation end-products
AGLU α-Glucosidase
ALX Allozan
AMG Aminoguanidine
AMPK 5' Adenosine monophosphate-activated protein kinase
AMY α-Amylase
ANTCs Anthocyanins
AOA Antioxidant activity
APCI Atmospheric pressure chemical ionization
AR Aldose reductase
ASJ Arco de São Jorge
B
BGLU β-Glucosidase
BPPs Berry-producing plants
BSA Bovine serum albumin
BV Boaventura
C
CAT Catalase
CBE Conduritol B epoxide
CEL Carboxyethyl-lysine C3G Cyanidin-3-O-glucoside CI Chemical ionization ClO- Hypochlorite CML Carboxymethyl-lysine COX Cyclooxygenase
CQAs Caffeoylquinic acids
CQM Centro de Química da Madeira
D
DE Dry extract
3-DG 3-Deoxyglucosone
DM Diabetes mellitus
DPP-4 Dipeptidyl peptidase-4
DPPH 2,2-Diphenyl-1-picrylhydrazyl
E
ECG (Epi)catechin-O-gallate
ECGC (Epi)gallocatechin-O-gallate
EDTA Ethylenediaminetetraacetic acid
ESI Electrospray ionization
F
FAs Fatty acids
FAB Fast atom bombardment ionization
FBS Fetal bovine serum
FCR Folin-Ciocalteu’s reagent
FFAs Free fatty acids
FL Faial FW Fresh weight FX Funchal G GC Gas chromatography GI Gastrointestinal
GID Gastrointestinal digestion
GIP Glucose-dependent insulinotopic peptide
GLP-1 Glucagon-like peptide-1
GLUTs Glucose transporters
GO Glyoxal
GOLD Glyoxal lysine dimer
GPx Glutathione peroxidase
GRx Glutathione reductase
H
HAR Human aldose reductase
HbA1C Hemoglobin A1C
HBAs Hydroxybenzoic acids
HCAs Hydroxycinnamic acids
HPLC High performance liquid chromatography
HPLC-DAD High performance liquid chromatography with diode-array detector
Vítor Spínola (2018) xxxiii
HSCCC High speed counter current chromatography
HO Hemeoxygenase
H2O2 Hydrogen peroxide
I
ICP-MS Inductively coupled plasma-mass spectrometry
IGF Insulin-like growth factor
IL-6 Interleukin-6
IPC Individual phenolic content
IRs Insulin receptors
M
MAE Microwave-assisted extraction
MALDI Matrix-assisted laser desorption/ionization
MCT Myricitrin (myricetin-O-deoxyhexoside)
MEM Minimum essential medium
MGO Methylglyoxal
MPO Myeloperoxidase
MS Mass spectrometer
MX Machico
N
NADH β-Nicotinamide adenine dinucleotide reduced
NADPH Nicotinamide adenine dinucleotide phosphate
NBT Nitroblue tetrazolium chloride
NEAA Non-essential aminoacids
NEDA N-(1-Naphthyl)ethylene-diamine dihydrochloride
NMR Nuclear magnetic resonance
NO Nitric oxide
NOS Nitric oxide synthase
NOX NADPH oxidase
p-NPB p-Nitrophenyl butyrate
α-p-NPG p-Nitrophenyl-α-D-glucopyranoside
β-p-NPG p-Nitrophenyl-β-D-glucopyranoside
NF-kB Nuclear factor-kappa B
O
O2•- Superoxide anion radical
OH- Hydroxyl radical
P
PACs Proanthocyanidins
PCs Phenolic compounds
PDA Photo-diode array
PL Pancreatic lipase
PM Porto Moniz
PMS Phenazine methosulfate
PPAR-γ Peroxisome proliferator-activated receptor gamma
R
RDA Recommended dietary allowance
RJ Ribeira da Janela
RNS Reactive nitrogen species
ROS Reactive oxygen species
S
SDG Sorbitol dehydrogenase
SCF Supercritical fluid chromatography
SGLUTs Sodium-dependent glucose transporters
SOD Superoxide dismutase
STZ Streptotozin
SX Seixal
T
TAC Total anthocyanins content
TC Terceira Island
T1DM Type-1 diabtes mellitus
T2DM Type-2 diabtes mellitus
TFC Total flavonoid content
TGF-β Transforming growth factor-β
TIPC Total individual phenolic content
TLC Thin-layer chromatography
TNF-α Tumor necrosis factor-alpha
TPC Total phenolic content
Trolox 6-Hydroxy-2,5,7,8-tetramethylchroman-2-carboxylic acid
U
UAE Ultrasound-assisted extraction
Vítor Spínola (2018) xxxv
Vítor Spínola (2018) 1
ola 2018
1
Vítor Spínola (2018) 3
ola 2018
3
1. Diabetes
Diabetes mellitus (DM) is becoming one of the most common chronic metabolic disorders worldwide (Figure 1) that results from disturbances in glucose homeostasis [1–6]. The global prevalence of DM in 2017 was 425 million among adults and it is estimated to affect almost 630 million people by 2045 (Figure 1), becoming the 7th leading cause of death in developed countries [7,8]. In Portugal, the estimated prevalence of DM in 2015 was 13.3%, that is, more than 1 million Portuguese in the 20-79 age group had DM [9]. Due to its high incidence and the vast range of associated health complications, this disease presents a significant burden in health care systems [2,5,8–10].
Figure 1 – Prevalence of Diabetes mellitus (DM) worldwide and per region in 2017 and 2045 (20 – 79 age
group) (adapted from [8]).
DM is associated with deficiency or abnormalities in insulin secretion, or insensitivity/resistance to the metabolic action of this hormone in its target tissues, which results in raised blood sugar levels (hyperglycaemia) [3,11–13]. Lack of insulin leads to an improper balance of glucose homeostasis and disturbances of lipid and protein metabolism [1,3,14,15]. Failure of control of glucose homeostasis results in the metabolic syndrome, which comprises hyperglycaemia, glucose intolerance, chronic inflammation, dyslipidaemia and hypertension. This combination of pathological conditions leads to changes in the structure and function of major organs and tissues, especially the eyes, kidneys, nerves, heart and blood vessels. Overall, this condition diminished the patient quality of life and can lead to life-threatening complications
Chapter I – Introduction
(neuropathy, nephropathy, retinopathy, artherosclerosis, macro- an microvascular damage, etc) and ultimately pre-mature death [3,4,14–16].
DM is commonly categorized into two main groups: type 1 diabetes (T1DM) (insulin-dependent DM) and type 2 diabetes (T2DM) (non-insulin (insulin-dependent DM) [1–4,16]. The first case is characterized by insufficient or no endogenous insulin production and it accounts for 5 - 10% of the total cases, showing a higher incidence in children and adolescents. T1DM arises by autoimmune processes or infections, where pancreatic β-cells are destroyed and fail to produce insulin [1–3,5]. Hence, treatment of T1DM involves the administration of exogeneous insulin [2– 4]. In the second category, the produced insulin by pancreatic β-cells is ineffective and insulin-dependent tissues (muscle, adipose tissue, liver, etc) show variable degrees of resistance to the insulin action [1–3,5,15]. T2DM is the predominant form (approximately 90 - 95% of all cases) and is generally related with older age, calorie overload, overweight, obesity, sedentary lifestyle and genetic factors [1–3,10,17].
T2DM is considered a “sneaky condition” since its harmful long-term complications develop slowly over many years before it is diagnosed [2]. “Pre-diabetes” is an intermediate stage for individuals with higher blood glucose or glycated hemoglobin A1C (HbA1C) levels than normal, but not high enough to meet the diagnostic criteria for T2DM [2,8,10]. Pre-diabetes is a warning status to the predisposition of developing T2DM and increases the risk of developing retinopathy, nephropathy, neuropathy, cardiovascular diseases and stroke [2,5,8,10]. Unlike T1DM, this condition can be controlled and even reverted with the right lifestyle alterations, including regular physical activity and weight loss and dietary intervention, by increasing consumption of fruits and vegetables, whole grains and nuts in appropriate amounts [1–4,16,18]. It has been suggested that 90% of T2DM cases could be potentially prevented [1]. This reversible particularity has made it a popular target of research, in order to find new ways to prevent/control or even avoid the onset of T2DM [2].
1.1. Carbohydrate Metabolism and Glucose homeostasis
At normal physiological state, glucose homeostasis is maintained by the peptide hormones insulin and glucagon, which tightly control blood glucose levels after ingestion of carbohydrate-rich meals [2,3,5].
1.1.1. Carbohydrate Digestion and Absorption
In humans, complex dietary carbohydrates (starch, sucrose, maltose, lactose, etc) are broken down into smaller molecules (glucose, fructose, etc) in the gastrointestinal (GI) tract before absorption [2,19,20]. α-Amylase (AMY) and α-glucosidase (AGLU) are the key enzymes
Vítor Spínola (2018) 5
ola 2018
5
1.1.1.1. α-Amylase
AMY (α-1,4-glucan 4-glucanohydrolase; EC 3.2.1.1) (aprox. 55 kDa) performs the first step in the digestion of dietary polysaccharides, hydrolysing the α-1,4-glycosidic linkages of starch, glycogen, amylose and amylopectin [2,3,16,19]. Digestion of carbohydrates begins in the mouth. However, the action of salivary AMY is limited by the short time that food remains in this stage (about 5 % of carbohydrate digestion). Digestion by salivary AMY continues after the food reach the stomach, as long as 30 minutes. Then, its activity is stopped due to the high-acidic environment of the stomach. At the small intestinal, pancreatic AMY catalyses the hydrolysis of the remaining starch (about 70% of overall digestion) [19,20]. Maltose, isomaltose, maltotriose, and α-dextrins are the major products of AMY digestion and AGLU enzymes substrates [2– 4,16,18,20].
1.1.1.1. Glucosidases
Glucosidase enzymes (including isoforms lactase, maltase, and sucrase) (260 kDa) are located in the brush border membrane of small intestine cells (enterocytes) [18–20]. Glucosidases complete the hydrolysis of oligosaccharides to monomer units [2,4,16,20]. Sucrose is hydrolysed by sucrase (sucrose alpha-glucosidase; EC 3.2.1.48) into glucose and fructose, while isomaltose is converted into glucose units by sucrase-isomaltase (oligo-1,6-glucosidase; EC 3.2.1.10). Maltose is hydrolysed by maltase (or maltase-glucoamylase; EC 3.2.1.20) [2,19,20]. All these enzymes present AGLU activity, which is the hydrolysis of (1->4)-α-glucosidic bonds [2,16,19,20]. β-Glucosidases (BGLUs) are brush border enzymes that hydrolyses (1->4)-β-glucosidic linkages, such as those found in lactose. Lactase (β-galactosidase, EC 3.2.1.108) is responsible for the hydrolysis of lactose resulting in galactose and glucose units [19].
Among all the enzymes involved in the carbohydrate digestion process, AGLU enzymes seem the most important due to the rate-limiting step in sugar hydrolysis [14,20].
Glucose, the main product of carbohydrate digestion, is highly hydrophilic and its intra-cellular transportation must be aided by specific glucose transporters (GLUTs) [3,5,19]. Glucose is actively taken up in the intestinal lumen against its concentration gradient (active transport) by the sodium-dependent glucose transporter-1 (SGLUT-1) located in the brush border of the enterocytes [2,3,5,16,19]. Then, glucose is passively released (facilitated diffusion) into the blood circulation via the glucose transporter-2 (GLUT-2), present in the basal and lateral membranes of enterocytes [2,3,5,19].
Chapter I – Introduction
1.1.2. Glucose Homeostasis
When glucose enters the pancreas via GLUT-2, it is metabolized for energy production (glycolysis and Krebs cycle) which signals β-cells to produce and secrete insulin and suppress glucagon production by α-cells (Figure 2) [2,3,16,19]. Then, insulin controls the rise of blood glucose by promoting the uptake of glucose in peripheral tissues (muscle, liver and adipocytes) through translocation of GLUT-4 to the plasma membrane, enhancing glucose utilization/storage in the muscle and liver (glycolysis/glycogenesis) and inhibiting lipolysis and promoting lipogenesis in adipocytes (Figure 2) [2,3,5,16,19].
Figure 2 – Maintenance of glucose homeostasis by insulin and glucagon regulatory action (adapted
from[8]).
Under fasting or between meals, blood glucose concentrations decrease to under a particular level (< 4 mM) and pancreatic α-cells secrete glucagon (Figure 2) [2,3]. This counterregulatory hormone acts initially on the liver, activating catabolic pathways (glycogenolysis and gluconeogenesis) to raise blood glucose to normal levels (Figure 2) [3,16]. Any metabolic dysregulation, associated with absolute or relative deficiency in insulin secretion or action, contributes to the development of hyperglycaemia due to depletion of glycogen storage and increased gluconeogenesis [1–3,16]. Uncontrolled or poorly managed hyperglycaemia leads, ultimately, to the onset of DM [3].
Since T2DM is the predominant form of DM [1–3], it will be the main focus of the present work. Glucose Glycogen Liver Low blood glucose Raises blood glucose Lowers blood glucose High blood glucose Pancreas Glucagon Insulin Stimulates glucose uptake from blood to
Tissues cells (muscle, brain, adpocytes) Stimulates the
breakdown/formation
Vítor Spínola (2018) 7
ola 2018
7
1.2. Pathogenesis of Type-2 Diabetes
Over the past few decades, lifestyles changes characterized by excessive calorie intake (sugars and saturated-fats rich foods) and sedentary life have promoted overweight and obesity [1,5,18,21]. Obesity is a debilitating condition characterized by excess body fat accumulation, and is a key contributing risk factor for cardiovascular disease and T2DM [1,5,21–23].
Obesity-linked T2DM is associated with dyslipidemia, low-grade inflammation due to increased release and action of proinflammatory cytokines from adipose tissue (interleukin (IL)-6), nuclear factor-kappa B (NF-kB) and tumor necrosis factor-alpha (TNF-α) and activation of inflammatory signaling pathways, which impede insulin action in peripheral tissues [1,16,17,23]. Insulin resistance usually precedes and predicts the onset of T2DM (pre-diabetes) and is characterized by the reduction of glucose uptake in peripheral tissues (Figure 3) [2,3]. As a mechanism of compensation, there is an increased secretion of insulin by the pancreas (hyperinsulinemia) through which normal glucose tolerance is preserved [4–6]. Overtime, insulin-dependent cells become desensitized to insulin and β-cells fail to produce more insulin due to exhaustion (dysfunction), resulting in chronic hyperglycaemia [3] (Figure 3). In addition, activation of hepatic glucose production (glycogenolysis and gluconeogenesis) contributes to fasting hyperglycaemia. In this scenario, the muscle glucose uptake is reduced and glycogenolysis and muscle proteolysis are also enhanced. Similarly, there is activation of lipolysis in adipose tissue with elevation of fatty acids (FAs) and glycerol in the bloodstream (Figure 3).
Hyperglycaemia is a pre-requisite for the development of T2DM and is mainly caused by insulin resistance and impaired insulin secretion due to β-cell dysfunction [2,3,5,13,15]. Chronic exposure to glucose (glucotoxicity), free fatty acids (FFAs) (lipotoxicity) as well as increased secretory need for insulin, due to insulin resistance, lead to the diminution of pancreatic β-cell mass and further continues the progression of diabetes and its complications (retinopathy, nephropathy, neuropathy, cardiovascular disease, etc) (Figure 3) [2,3,16].
1.3. Oxidative stress and Type-2 Diabetes
Under normal homeostatic conditions, reactive oxygen and nitrogen species (ROS and
RNS, respectively) like superoxide anion (O2•-),hydrogen peroxide (H2O2), hydroxyl radical (OH•-), nitric oxide (NO•) and peroxynitrite (ONOO-) are involved in important physiological
processes, including defence against infections, regulation of certain biological processes (vascular tone and blood pressure) and key cellular functions (gene expression, cellular growth, differentiation, mitochondrial function and apoptosis) [2,12,24–28]. They are highly unstable and reactive oxidized molecules due to one or more unpaired electrons [2]. During the normal aerobic metabolism, ROS are mainly generated by the mitochondrial respiratory chain and inflammation processes [12]. Additionally, exogeneous sources like ultra-violet (UV) and gamma radiation
Chapter I – Introduction
exposure, xenobiotic agents (toxins, pesticids, herbicids), polluents, drugs and diet can induce ROS [4,17].
Figure 3 – Overall pathophysiology of T2DM development, with hyperglycaemia and oxidative stress as
the key central mechanisms responsible for the development and progression of diabetic complications.
At normal conditions, the human organism naturally defends itself from ROS/RNS with endogenous antioxidants, including superoxide dismutase (SOD), catalase (CAT), glutathione peroxidase (GPx), glutathione reductase (GRx) and hemeoxygenase (HO)[4,12,15,17,26]. Non-enzymatic antioxidants include gluthatione, bilirubinuric acid, coenzyme Q, melanin and lipoic acid [12,17,26]. Additionally, diet can provide exogeneous antioxidants like vitamins (A, C, E), phenolic compounds (PCs), carotenoids, tocopherols and minerals [2,12,26].
Antioxidants are effective to neutralize the toxic effects of ROS/RNS [2,26,27]. However, the imbalance between these reactive species and the antioxidant defences, due to an overproduction or reduction in the removal of free radicals from cells, may cause structural deterioration and instability of macromolecules (proteins, membrane lipids, nucleic acids) resulting in cellular oxidative damage and eventually apoptosis [2–4,17,24,26]. This condition is referred to as “oxidative stress” (OS) and is considered a deleterious factor in the occurrence of several chronic pathologies (cardiovascular, neurodegenerative, cancer, etc) including pre-diabetes and onset of late complications [2,3,12,15,17,24,27].
It seems that hyperglycaemia alone is not exclusively responsible for the later diabetic complications since usually hyperglycaemia is not detected until severe complications become clinically evident [2,4]. In fact, a loop between hyperglycaemia and OS plays a pivotal role in the initiation, promotion, and progression of T2DM (Figure 3) [2–4,12,13,15]. Hyperglycaemia triggers glucose autoxidation, increased flux through polyol and hexosamine pathways, activation of protein kinase C (PKC) and increased formation of advanced glycation end-products (AGEs) [1,3,12–14,17]. All these detrimental pathways increases the generation of ROS which
Oxidative damage
ER (Endoplasmic reticulum) stress
Adaptation to ER stress Failure of ER adaptation Resitant β-cell Susceptible β-cell
β-cell compensation β-cell death
Oxidative stress
↑ Blood Glucose (hyperglycaemia)
β-CELLS
↓ Insulin
MUSCLE ADIPOSE TISSUE LIVER
↑ Glicogenolysis Lactate ↑ Proteolysis ↑ Lipolysis Glycerol Fatty acids ↑ Ketogenesis ↑ Gluconeogenesis Fatty acids Lactate Amino acids Glycerol Glucose auto-oxidation
Free-radicals formation Polyol pathwayoveractivity Non-enzymatic glycationof proteins Hexosamine pathwayactivation Inflammation pathway activationProtein Kinase C
PANCREAS
↓ Glucose uptake
Fatty acids Lactate Amino acids
Vítor Spínola (2018) 9
ola 2018
9
The major cellular OS comes from overactivation of xanthine oxidase and NADPH oxidases enzymes, but mainly from mitochondrial respiration (electron transport chain complex). Hyperglycaemia condition leads to an overproduction of mitochondrial O2•-, which is the key event for the activation of other detrimental pathways involved in oxidative stress-related diabetic complications [12,13,17]. Additionally, the combination of excessive O2•- and NO leads to the formation of ONOO-, a powerful oxidant responsible for lipid peroxidation [2,12,17,27]. When occurring, lipid peroxidation exert cellular damages associated with pathophysiology of inflammation, atherosclerosis, etc [12,17,29]. OS activates intracellular stress-signaling pathways (via NF-kB) and contribute to the expression of transforming growth factor-β (TGF-β), insulin-like growth factor (IGF) and TNF-α, which are involved in insulin resistance [2,5,13,15,17]
Due to the low antioxidant enzymes levels (CAT, GPx, SOD) and large swings in protein flux through its secretory pathways, pancreatic β-cells are exquisitely sensitive to ROS/RNS [2,14,17]. Hyperglycemia-induced OS is an important factor in pancreatic β-cells dysfunction and destruction in T2DM [3,5,12,15,17]. Therefore, OS is associated with the decrease in insulin secretion and its action on target tissues, accelerating disease progression from insulin resistance, impaired glucose tolerance and ultimately T2DM.
1.4. Treatment of Type -2 Diabetes 1.4.1. Conventional therapy
At early stage (pre-diabetes), the slight hyperglycaemia can be controlled through lifestyle modification (diet restriction and physical activity) [2–4,17]. Generally, prescription of anti-diabetic drugs are needed for patients who fail the preliminary therapy [2,3]. The main pharmacological intervention includes a wide variety of oral anti-diabetic agents (AMY and AGLU inhibitors, biguanides, thiazolidinediones, sulfonylureas, etc) with the aim of improving glycemic control and prevention of diabetes complications (Table 1). Their main therapeutic mechanisms include inhibition of glucose digestion, reduction of hepatic glucose production, enhancement of pancreatic insulin secretion and peripheral glucose uptake [1–4,13,15,17]. Glucagon-like peptide-1 (GLP-1) receptor agonists, GLUTs-2 and dipeptidyl peptidase-4 (DPP-4, EC 3.4.14.5) inhibitors are more recent therapies [2,(DPP-4,11,1(DPP-4,17,30].
Due to the multifactorial pathogenicity of T2DM, the available therapeutics are used mostly in combination to restore normal glucose levels in blood [4,14]. However, none of these approaches can be termed as an ideal one, due to some undesirable side effects (Table 1), high costs, and often response decrease after prolonged use. To overcome the adverse effects, there is a demand to research for novel targets and safer and more effective hypoglycemic agents [2– 4,14]. In such context, plants have long been considered a target for source of new anti-diabetic
Chapter I – Introduction
agents based on their traditional use, less side effects and economic viability [11,13,31]. In fact, current medicines today were based on natural products properties [2,4].
1.4.1.1. Inhibition of digestive enzymes
In diabetic patients, the rapid digestion and absorption of carbohydrates is not desirable. Post-prandial hyperglycemia plays an important role in the incidence of T2DM and related complications [2,3]. Therefore, controlling post-prandial hyperglycaemia, by slowing down glucose metabolism via inhibition of the activities of AGLU enzymes, is a key strategy to manage this disease [1,4,14,15,18].
The use of synthetic drugs that inhibit digestive enzymes (AGLU, AMY and PL) has been proposed as a treatment for T2DM and obesity [3,14,19,20]. Acarbose (Glucobay®, Precose®, Prandase®) (Figure 4), isolated from Steptomyces spp., is the most prescribed drug for inhibition of AMY and AGLU [2,20]. Other employed medication include miglitol (Glyset®) (Figure 5) and voglibose (Glasen®) (Table 1). These drugs delay the digestion of complex carbohydrates, thus decreasing the post-prandial hyperglycaemia. However, these medications produce undesirable GI disturbances (Table 1) [2,20].
In humans, 50-70% of dietary lipids are mainly hydrolysed by pancreactic lipase (PL) (E.C. 3.1.1.3; triacylglycerol acyl hydrolase) (50 kDa) in the small intestine, yielding glycerol and FAs as main products [18,20,21]. Inhibition of PL activity is a therapeutic approach used to reduce calorie intake, promote weight loss and combat obesity in diabetic patients [18,22,23]. Orlistat (Xenical®, Alli®) (Figure 4), a synthetic derivative of a lipostatin produced by Streptomyces
toxytricini, was the first effective PL inhibitor approved as anti-obesity drug [20,21,32]. However,
oily spotting, severe evacuations myocardial infarction have been reported from this drug intake [20].
Figure 4 - Chemical structure of acarbose (1) and orlistat (2).
Chapter I - Introduction
Vítor Spínola (2018) 11
Table 1 - Main oral anti-diabetic drugs, their mechanisms of action and side effects.
Categories Target Mechanism Example Main Side Effects
AMY and AGLU inhibitors
Small intestine Reduce carbohydrate digestion and absorption Acarbose, Miglitol, Voglibose
Diarrhea, nausea, abdominal bloating, flatulence
Biguanides Liver, muscle and adipocytes
Reduce hepatic glucose production (gluconeogenesis) and promotes peripheral glucose uptake (reduce insulin resistance via AMPK1 activation)
Metmorfin, Phenformin Diarrhea, nausea, abdominal pain, lactic acidosis
DPP-4 inhibitors Small intestine Reduce glucagon and glycaemic levels by inhibiting DPP-4 enzyme2
Sitagliptin, Vidagliptin, Saxagliptin, Linagliptin, Gemigliptin, Teneligliptin
Nasopharyngitis, headache, vomiting, nausea, pancreatitis, hypersensitivity, skin reactions Sulfonylureas Pancreas Stimulate pancreatic insulin production Glibenclamine, Glipizide,
Tolbutamine, Chlorpropamide
Hypoglycaemia, weight gain, skin rash or itching
Thiazolidinediones Liver, muscle and adipocytes
Reduce hepatic glucose production (gluconeogenesis) and promotes peripheral glucose uptake (reduce insulin resistance via PPAR-γ3 activation)
Rosiglitazone Hepatotoxicity, edema, increased risk of heart failure, weight gain, anemia
1AMPK (5' adenosine monophosphate-activated protein kinase, EC 2.7.11.31) has a key role in glucose and lipid homeostasis control [1,2,15,23]. Activation of this
pathway in adipose tissue and skeletal muscle increases GLUT4 expression and membrane translocation, which provides a greater uptake and utilization of glucose through insulin-independent mechanisms; and simultaneously inhibits hepatic gluconeogenesis, which results in lower glucose blood circulation [1,2,5,15,16,23].
2DPP-4 is a serine exopeptidase responsible for the degradation of incretins (GLP-1 and glucose-dependent insulinotopic peptide, GIP) which maintain glucose
balance by stimulation of insulin secretion. Inhibition of DPP-4 will prologue the half-life of incretins (~ 2 min) and, consequently, inhibit glucagon secretion and elevate insulin levels in human body [2,4,14,17,30]. 3PPAR-γ (peroxisome proliferator-activated receptor gamma) is a major regulator of fatty acid storage and
glucose metabolism in adipocytes. Activation of PPAR-γ lowers blood glucose levels, by improving the insulin action and glucose uptake, without increasing pancreatic insulin secretion [1,3,4,14].
Chapter I - Introduction
1.4.2. Medicinal Plants and Phytotherapy
Since ancient times, edible and non-edible plants are used in traditional medicine throughout the world to treat T2DM and related complications [2,4,11,13,14]. Currently, approximately 800 plant species and their active extracts are still relevant for their anti-diabetic properties [11,14]. Plants are rich in unique secondary metabolites such as phenolic compounds (PCs), alkaloids, terpenoids, polysaccharides, phytosterols, etc, that have been regognized for their beneficial health effects [4,13,14]. Flavonoids, terpenoids and phenolic acids constitute the most studied and effective compounds for attenuation of diabetic complications [2,13]. As a result, plant extracts have drawn the attention of the scientific community due to their efficiency and fewer toxic and side effects [11,13]. Additionally, in developing countries where conventional drugs pose an economic burden for rural population, plants offer a cheaper and, in the case of T2DM, effective alternative [3,11,13].
There are some natural isolated compounds that possess higher therapeutic potential than synthetic drugs [11]. For example, 1-deoxynojirimycin (1-DNJ) or moranoline (Figure 5), isolated from mulberry (Morus spp.), is a more effective AGLU inhibitor than acarbose [14,33]. Miglitol (Glyset™) (Figure 5) is a synthetic N-hydroxyethyl derivative of 1-DNJ used in the treatment of T2DM (Table 1). In this view, natural products are potential sources of new anti-diabetic drugs either by providing lead molecules or as natural herbal products (infusions, teas, tinctures, poultices, powders, etc) [2,3,22].
Detailed revision about plant extracts and bioactive compounds with reported in vitro and in
vivo anti-diabetic properties is documented in several works [4,11,13,14].
Figure 5 - Chemical structures of 1-deoxynojirimycin (1) and miglitol (2).
![Figure 1 – Prevalence of Diabetes mellitus (DM) worldwide and per region in 2017 and 2045 (20 – 79 age group) (adapted from [8])](https://thumb-eu.123doks.com/thumbv2/123dok_br/19274370.984578/41.892.203.727.401.800/figure-prevalence-diabetes-mellitus-worldwide-region-group-adapted.webp)
![Figure 2 – Maintenance of glucose homeostasis by insulin and glucagon regulatory action (adapted from[8])](https://thumb-eu.123doks.com/thumbv2/123dok_br/19274370.984578/44.892.212.732.357.649/figure-maintenance-glucose-homeostasis-insulin-glucagon-regulatory-adapted.webp)

![Figure 7 – Potential health benefits of phenolic compounds on management/control of hyperglycaemia in T2DM (adapted from [16])](https://thumb-eu.123doks.com/thumbv2/123dok_br/19274370.984578/58.918.133.811.110.474/figure-potential-benefits-phenolic-compounds-management-control-hyperglycaemia.webp)

![Figure 10 – The phenolic composition of some berries (adapted from [34,82]). EU: European, USA: American;](https://thumb-eu.123doks.com/thumbv2/123dok_br/19274370.984578/64.918.149.779.324.635/figure-phenolic-composition-berries-adapted-european-usa-american.webp)