UNDERSTANDING THE MOBILE CONSUMER
Context of use in mobile data services
Tiago Veiga Fernandes
Project submitted as partial requirement for the conferral of Master in International Management
Supervisor:
Prof. Dr. Paulo Rita, ISCTE Business School, Departamento de Gestão de Empresas
Resumo
Esta dissertação visa compreender de que forma o contexto influencia a utilização de serviços de dados móveis. Procura-se assim compreender o papel do contexto de utilização na forma como o utilizador percepciona os serviços e a forma como a experiencia de utilização destes é modificada em função desse mesmo contexto. O objectivo passa em parte por aferir do potencial dos serviços móveis de dados sensíveis ao contexto ao mesmo tempo que se procura estabelecer linhas orientadoras para futuras pesquisas sobre serviços de dados móveis e a sua relação com o contexto.
Os resultados deste estudo apontam para uma relação incontornável entre o contexto de uso e a utilidade percebida dos serviços de dados móveis, confirmando que as tecnologias móveis são, por sua própria natureza, sensíveis ao contexto de utilização e que há do ponto de vista de mercado um potencial inexplorado nesse âmbito, dada a sua penetração baixa em Portugal em 2010.
Confirma-se também que os diferentes aspetos do contexto de utilização tem impactos diferentes na utilidade percebida do utilizador, pelo que faz sentido abordar o tema do contexto de uma forma mais aprofundada, especialmente quando se trata de uma tecnologia intrinsecamente sensível ao contexto de utilização.
Palavras-Chave: Sensibilidade ao Contexto, Contexto de Utilização, Servicos Móveis de Dados (MDS), Internet Móvel (MI)
Abstract
This study examines context of use of mobile data services in order to better comprehend how context impacts perceived usefulness and actual usage of mobile data services. The goal is to provide a deeper understanding of the potential of context-aware mobile data services and give pointers of how future research on mobile data services should approach context of use.
The results of this study point to an unavoidable relation between context of use and actual use of mobile data services, confirming that mobile technologies are, by their own nature, extremely sensitive to context of use and that there is indeed untapped potential in context-aware data services from a market perspective, given their low penetration in Portugal 2010.
It is also confirmed that the different aspects of context of use have different impacts on the perceived usefulness of the user. This means that it makes sense to address the issue of context using a more thorough approach, especially when it comes to dealing with a kind of technology that is itself very sensitive to context of use.
Keywords: Context-Awareness, Context of Use, Mobile Data Services (MDS), Mobile Internet (MI)
Contents Resumo ... 3 Abstract ... 4 Contents ... 5 Index of tables ... 7 Index of figures ... 8 List of abbreviations ... 9 1. Introduction ... 10
1.1 Relevance of the topic ... 10
1.2 Background – the state of MDS ... 10
1.2.1 Worldwide ... 10
1.2.2 Portugal ... 11
1.3 Research gap and research goals ... 12
1.4 Organization of the study ... 13
2. Literature Review ... 14
2.1 Key Concepts ... 14
2.1.1 Mobile Internet ... 14
2.1.2 Mobile Data Services ... 16
2.2 Drivers of MDS Adoption ... 16
2.2.1 Demographics ... 16
2.2.2 Context ... 18
2.2.3 Perceived Usefulness ... 21
2.3 Previous models ... 22
3 Conceptual Model and Research Hypotheses ... 24
3.1 Conceptual Model ... 24
3.2 Constructs ... 26 4. Methodology ... 27 4.1 Questionnaire Design ... 27 4.2 Sampling Procedure ... 27 4.3 Measurement Scales ... 28 4.4 Statistical Techniques ... 29 5. Results ... 31 5.1 Achieved Sample ... 31
5.2 Data Reduction and Component Extraction ... 32
5.3 Confirmatory Cluster Analysis ... 35
5.4 Assessment of the Conceptual Model ... 37
5.4.1 Testing the Simple Linear Regressions ... 39
5.5 Summary and Major Results ... 44
6. Conclusion ... 46
6.1 Major Contributions ... 46
6.2 Limitations ... 47
6.3 Future research recommendations ... 47
Bibliography ... 48
Index of tables
Table 1 – Construct definitions ... 26
Table 2 – Construct measurement scales ... 28
Table 3 – Sample demographics ... 31
Table 4 – PCA factor loadings and internal consistency (Cronbach’s alpha) ... 33
Table 5 – Cumulative % of variance explained and initial Eigenvalues of factors ... 33
Table 6 – KMO’s measure of sampling adequacy and Bartlett's test of sphericity ... 33
Table 7 – KMO’s sampling adequacy value interpretation ... 34
Table 8 – Cronbach’s alpha value interpretation ... 34
Table 9 – Construct’s descriptive statistics ... 36
Table 10 – Results of hypothesis testing ... 37
Table 11 – Unstandardized residual means calculated for each regression ... 40
Table 12 – Correlations between independent variables and residuals ... 41
Table 13 – Durbin-Watson values for each regression ... 41
Index of figures
Figure 1 – Balasubraman’s space-time matrix (2002), before and after MI ... 19
Figure 2 – TRA (Ajzen & Fishbein, 1980) ... 22
Figure 3 – TAM (Davis, Bagozzi, & Warshaw, 1989) ... 22
Figure 4 – Proposed conceptual model ... 24
Figure 5 – Conceptual model’s detailed view ... 25
Figure 6 – Ward’s Method dendrogram (rescaled distance cluster combine) ... 35
Figure 7 – Conceptual model with r2 values superimposed ... 38
Figure 8 – Conceptual model with coefficient values superimposed ... 38
Figure 9 – Task-related Context à Perceived Usefulness ... 43
Figure 10 – Subjective Norm àPerceived Usefulness ... 43
Figure 11 – Physical Context à Perceived Usefulness ... 43
Figure 12 – Subjective Norm à Physical Context ... 43
Figure 13 – Subjective Norm à Task-related Context ... 43
List of abbreviations
AU – Actual Use
IT – Information Technologies
EC – Electronic Commerce
LR – Literature Review
MDS – Mobile Data Services
MI – Mobile Internet
MID – Mobile Internet Device
MNO – Mobile Network Operator
PC – Physical Context
PCA – Principal Component Analysis
PDA – Personal Digital Assistant
PU – Perceived Usefulness
SN – Subjective Norm
TAM – Technology Acceptance Model
TC – Task-related Context
1. Introduction
1.1 Relevance of the topic
Businesses worldwide are currently dealing with very dynamic, game-changing innovations in Information Technologies (IT).
Mobile Internet (MI) and Mobile Data Services (MDS), meaning Internet access in mobile devices such as smartphonea and all the data services that can be accessed through it, have been adopted very rapidly by consumers all over the globe and the skyrocketing number of MI users is expected to surpass that of fixed internet users as soon as 2014 (Morgan Stanley Research, 2010). The latest Mobile Web Watch Survey (Accenture, 2012), with a sample of more than 17.000 people, revealed that 69% of respondents accessed the web using a Mobile Internet Device (MID); of these, 61% used a smartphone, 37% a netbook used and 22% used a tablet. These innovations are no longer tech fads – MI has become a mass market. Businesses must adapt quickly to capture the attention of the mobile internet adopter.
However, it’s been said recently that mobile commerce is still in its early stages (Zhang, Zhu, & Liu, 2012). Moreover, several studies indicate that MDS have thus far failed to attract the hearts and minds of potential consumers (AlHinai, Kurnia, & Smith, 2010).
Consistent and persistent research is fundamental not only to understand what drives the adoption of these technologies but also to better guide mobile business decisions, especially when dealing to technologies that came to revolutionize the way businesses and people interact.
1.2 Background – the state of MDS
1.2.1 Worldwide
Since their inception, global market growth has been exponential both for Internet and mobile communications in general. Overall Internet penetration grew more than 500% globally in the past decade alone. As of December 2011 there were more than 2.2
billion Internet users globally; that’s one third of the world’s population, as opposed to a measly 360 million in 2000 (Miniwatts Marketing Group, 2011).
Conversely, there were 6 billion mobile subscriptions at the end of 2011, estimated to be 8 billion by the end of 2016, more than there are people on this planet (International Telecommunication Union, 2011). Put these trends together and it becomes clear just how fast MI is expected to grow.
The number of MI subscribers is expected reach 4.5 billion in 2016; at the end of 2011 there were 3.7 billion Mobile Internet subscriptions (Cisco, 2012).
There are virtually more people in the world with access to MDS than without it.
1.2.2 Portugal
According to ANACOM (2012), in Portugal, 34% of individualsaged 15 or more with voice plan subscriptions were also mobile broadband subscribers by the end of 2011. Of these 34% only 23% used MI through their mobile phones. The remaining 77% used other types of equipment, such as portable USB modems.
The same study concluded that MI access was more popular among younger people and that social class by itself is not a significant predictor of its use. There are no significant regional differences both in MI penetration and type of equipment used. Market penetration of mobile broadband associated with voice plans was 9.5% in the same year, meaning that 9.5% of people with a voice plan also have a mobile broadband subscription, not necessarily through their smartphone.
Yet another study shows that using a cellphone for Internet access is not very common in Portugal, with only 5.6% of the inquired population saying they usually do so. Among younger people aged 15 to 24 that number increases to 11.5%. (OberCom – Observatório da Comunicação, 2011). This makes Portugal a late but eager adopter of MI.
Penetration is below average and current socio-economic conditions do not favor market growth. Younger generations are just now getting accustomed to MI as an
everyday activity and as they get older they’ll carry this habituation into adulthood to become a relevant target audience both for business and scientific studies.
1.3 Research gap and research goals
Despite being a very current and widely explored theme, it’s been suggested that empirical research on mobile consumer behavior is still limited (Tang & Kuo, 2010).
This is especially true in the case of context of use. Due to MDS intrinsic flexibility, both in physical terms and in terms of task-performance, the context in which they are used is prone to affect how a user perceives their overall usefulness.
There is a lack of understanding of how context can be more deeply analyzed, what kinds of context may be considered for analysis, and how they the perceived usefulness of MDS. Extant research on MDS adoption has thus covered limited constructs (Zhang, Zhu, & Liu, 2012) and focused mainly on perceived usefulness, ease of use and other essential elements established by previous conceptual models (Pedersson & Heinonen, 2002). In addition to this, studies (Kleijnen, De Ruyter, & Wetzels, 2007; Yang & Lee, 2010) suggest that consumers’ perceived value (a relative preference characterizing a consumer’s expectation towards a certain object) of certain services varies greatly according to the use context or situation.
In summary, although research on MDS context of use exists, there is a lack of in-depth approach to context itself, that is to say, to understand what different aspects of context affect MDS and how they interact with each other as well as with the actual use of MDS.
This study is a first attempt at a context-focused approach of MDS, towards a better understanding of the potential of context-aware MDS and how context of use can be studied.
The goal is to provide a deeper comprehension of how the different aspects of context affect the perceived usefulness of data services and hopefully give some pointers on how future MDS research should approach context of use.
1.4 Organization of the study
This dissertation is organized in six main chapters:
1. Introduction: Includes a brief explanation of the topic’s relevance with background data for both worldwide and Portugal’s current state of affairs regarding MI penetration and MDS adoption. Exposition and explanation of research gap.
2. Literature review: Begins with the definition of relevant concepts and an analysis of the existing literature on the topic containing relevant information that leads to the construction of a conceptual model to be used in this study. Includes the fundaments of the proposed context-based constructs.
3. Conceptual model and research hypotheses: Exposition of conceptual model and research hypotheses and how both are connected to the literature review.
4. Methodology: Explanation of the used research methods, questionnaire design and data collection. Justification of utilized statistical techniques.
5. Results: Exposition of the hard statistical data in light of the considered hypotheses. Statistical testing of the proposed constructs and model.
6. Conclusion: Relevant deductions in light of the conceptual model and existing literature, including theoretical and managerial implications. Considerations on data validity and future research as well as research limitations.
2. Literature Review
2.1 Key Concepts
2.1.1 Mobile Internet
Mobile Internet (MI) is just that: Internet being accessed through a mobile device (Shuiqing Yanga, 2012). In other words, Internet that is widely available and can be accessed anytime, using devices that can be carried around anywhere, for quick Internet access: Mobile Internet Devices (MID). This paradigm is only possible because of the way the Internet evolved and it has become quite popular in the past few years (Lee I. C., 2007).
Nowadays, Internet access is relatively cheap. It is cheap both in money and in time. Current data streaming speeds allow immediate access to virtually any kind of online content instantly, blurring the distinction between online and offline. The introduction of MID to the masses destroyed physical barriers for Internet access, namely the need of a desktop computer and cable Internet access, and it forever changed the online landscape. The Internet became accessible anytime, anywhere, at high speeds and low costs.
The current paradigm has been predicted in 2005 and it was dubbed New Internet (Jain, 2005). This so-called New Internet would have the following eight principal characteristics:
Always-on: The instant availability of an Internet connection fundamentally changes the way it is used; everything is now only a few seconds away.
Ubiquitous: The Internet becomes pervasive. The presence of cellular networks provides computer users the ability to connect from virtually anywhere.
High-speed: Waiting will be a thing of the past. What this does is encouraging the use of more media-rich content.
On-demand: As connectivity improves, there will be little difference between online and offline. If it is out there, it is instantly available.
Multi-format: The computer is no longer the only device accessing the Internet. Smartphones (PDA, tablets and other such MID) with wireless data networks now provide equally viable alternatives.
Two-way: The growth of weblogs is a harbinger of publish-subscribe Internet. Readers and surfers will be able to participate in content creation.
Personalized: The Internet will also tend to become more individualized as websites build up more sophisticated profiles based on what we do. This will enable targeted advertising.
Not Free: This Internet will most likely not be built around the free access model that we have been used to. As we find content and services of value, we are more likely to start to pay for them.
In other words, Jain’s New Internet is effectively today’s “Regular Internet” and there is an unavoidable overlapping with the concept of MI itself: if there used to be a difference between accessing the Internet from an MID or a desktop PC, there is no longer such a difference. We propose one further point to expand on Jain’s New Internet; one characteristic that came to be perhaps the most paradigmatic of the current online experience.
Social: The Internet not only came to rely heavily on its social aspect, it is actually now difficult to imagine it not being social, be it in the form of collaborative content generation – the prosumer1 paradigm – the influence exerted by peer-opinion and peer-reviews on purchase decisions, or simply the predominance of social networks as the essential content distribution platforms they came to be.
The Internet is no longer just a tool to be accessed at home for entertainment or at work for productivity; it is a daily companion and it is in everyone’s pockets.
2.1.2 Mobile Data Services
MDS denotes the collection of digital data services that can be accessed through MI. In the literature, MDS is defined as any data service that can be obtained via a mobile device (Choi, 2004). This includes, but is not limited to, sending and receiving email, watching online videos, browsing the Internet or even playing an online game using a smartphone or any other MID. They refer to the confluence of mobile communication technologies with information and data communication services (ITU, 2002).
Not to be confused with the paid data services provided by Mobile Network Operators (MNO) i.e. data plans.
2.2 Drivers of MDS Adoption
2.2.1 Demographics
MI and MDS are prevalent themes and they have been the subject of much academic attention. There are several academic studies focusing on which factors contribute to user adoption, user intention and user behavior.
Demographic variables so far have gotten the most attention. These include age, education, gender, income or monthly allowance and occupation. Tang & Kuo cited three reasons to explain their popularity (2010):
1. They’re easily available;
2. They help a company to know where the target market is;
3. They help a company to predict the trends and potential of the target market.
The same publication stated that demographics have so far been the main predicators of MI users’ behavior and adoption.
One pattern emerges across all demographic profiling studies: MI penetration is highest among young affluent males, mostly for personal use (83%), even though almost half (49%) also claimed to use it for work. This tendency was detected as far back as 2001
(Okazaki, 2006). However, one survey conducted in Britain in 2002 found no significant gender differences in mobile Internet service adoption (Patrick Barwise, 2002). Several other studies tried to correlate gender with MDS and m-commerce to no avail. For instance, a survey on mobile banking conducted In South Africa found no gender difference among mobile banking adopters (I. Brown, 2003). Even more recently, one survey conducted with the intention of determining if ethnic and gender differences affect MDS adoption in the United States, concluded that, even in 2010, usage of MDS was actually very limited, regardless of gender or ethnicity, across all MID owners (Hyun-Hwa & Seung-Eun, 2010).
In conclusion MI/MDS adoption has so far been rather limited among all but the younger, somewhat wealthier generations, mainly in Europe and Asia. Gender and ethnicity seem to be of little importance when predicting MI and MDS adoption, even though it could be slightly biased towards younger males.
2.2.2 Context
It is crucial to understand the full meaning behind the expression context-awareness when applied to MDS. Context of use was found to be very important when studying MI adoption. This is in no small part due to the fact that MDS are inherently multipurpose and they can be used anywhere, anytime, instantly, which makes the value perception of these technologies very sensitive to context of use.
There are multiple ways in which context may influence the perceived usefulness of MDS as well as its actual use. Context, in this study, denotes situational and/or environmental factors that may affect the usage of MI and MDS.
Context may refer not only to a physical setting but also to social context (the subjective norm) and task-related context (the task being performed at the time of MDS usage).
Not only does context mediate consumers’ perceptions of values towards MI but it fully impacts adoption decisions. For example, MI may be less valued at home because substitute devices (such as the desktop PC or laptop) already exist in that context (Shuiqing Yanga, 2012).
In a study regarding context and lifestyle’s effects on MI adoption, Reuver and Bouwman concluded that the more consumers felt that mobile services add value in specific contexts, the more they are inclined to adopt these services (2010), which is the same as saying that users find the service useful and enjoyable only when there is a good fit between the context of use and the service being used (Hong & Tam, 2006). For example, Liu and Li (2011) discovered that context has a direct and strong influence on the intention to use mobile game services – people usually play at home or on the go to pass some time.
It is therefore of the utmost importance to understand exactly how context affects the perceived usefulness of MDS.
2.2.2.1 Impact of Physical Context
Because MI destroys the space and time constraints that were previously an inalienable part of a consumer’s routine, it fundamentally alters the consumer’s behavior and what he or she can demand and expect from services. Where previously a consumer was dependent on external factors to perform certain kinds of transactions (such as traditional retail stores’ opening schedules), he or she now only needs to make sure that his or her smartphone’s battery is charged; space and time have effectively been made fluid with the help of mobile technologies.
Fl ex ib le TI M E Fi xe d
Fixed SPACE Flexible
Fl ex ib le TI M E Fi xe d
Fixed SPACE Flexible
FIGURE 1–BALASUBRAMAN’S SPACE-TIME MATRIX (2002), BEFORE AND AFTER MI
Balasubraman (2002) developed a Space-Time matrix that better exemplifies the effects of widespread MI on consumer activities (see Figure 1). What was previously bound by either time or space (the L-shape of activities as seen in the first graph), now tends towards an increased flexibility in both time and space (the square-shape of activities as seen on the second graph). Thus, we hypothesize:
H1: Physical Context is significantly positively correlated with Perceived Usefulness.
• Morning shower
• Watching a football game
• Buying books from an electronic network • Sending and receiving email
• Buying books from the retail store
• Fixed-time
medication • Morning shower
• Watching a football game • Buying books from an
electronic network • Sending and
receiving email
• Buying books from the retail store
• Fixed-time medication
2.2.2.2 Impact of Task-related Context
Context may refer not only to the physical surroundings, but also to the tasks people want to execute. Carlsson (2006) states that MDS can only add value when contributing to specific activities, suggesting that task-related context may play a major role in MI adoption.
This relates to the notion of task-technology fit, which states that a user’s intention to use a certain technology is closely related to whether or not it fits the activity (Bouwman & Wijngaert, 2009; Daft & Lengel, 1984; Goodhue & Thompson, 1995). Thus, we hypothesize:
H2: Task-Related Context is significantly positively correlated with Perceived
Usefulness.
2.2.2.3 Impact of Subjective Norm (Social Context)
The effects of social pressure towards MI adoption are twofold. On the one hand it takes the form of necessity of use derived from social context, meaning that if an individual’s social group is heavily invested in MI or MDS that individual would feel pressured to adopt this technology in order to belong. On the other hand it takes the form of fashionable trend. Mobile phones are no longer just communication devices; they’ve become status symbols too. They are also subject to opinions of experts and mass media (Lu, Liu, Yu, & Wang, 2008). Bhattacherjee (2000) argued that subjective norm can take the form of interpersonal pressures (such as that exerted by friends or co-workers) and external pressures (mass-media, opinion makers or the simple need to express one’s individualism in society).
One other study conducted by Wang & Wang (2010) states that subjective norm does indeed have a significant impact on MDS adoption, which goes in tandem with previous research done on the influence of social pressure on the intention to adopt new technologies (Moore & Benbasat, 1991; Venkatesh & Davis, 2000) and despite the assumption that women would be more influenced by social norm than men, no gender differences were found. More recently, Yang & Jolly examined the impact of subjective norm between different cultures by conducting tests with an American and a Korean
sample and found that both were equally influenced by subjective norm, but with no significant difference between cultural backgrounds, further corroborating that demographics seem to have little impact on MI adoption (Yang & D.Jolly, 2009). Therefore, we hypothesize:
H3: Subjective Norm is significantly positively correlated with Physical Context.
H4: Subjective Norm is significantly positively correlated with Task-Related Context.
H5: Subjective Norm is significantly positively correlated with Perceived Usefulness.
2.2.3 Perceived Usefulness
The perceived utilitarian value of any given technology has been found to have a significant correlation with the user’s intention to adopt it. The more value users perceive from using MDS, the more likely they are to adopt it.
A number of studies validate perceived usefulness as a very important factor to have in consideration when investigating the adoption of mobile technologies (Hong & Tam, 2006; Kim, Chan, & Gupta, 2007; Zhou & Lu, 2011). Consequently, we hypothesize:
2.3 Previous models
The TRA was one of the first proposed models of behavior predictions and it is still widely used today in one form or another. According to the TRA a person’s behavioral intention depends on their attitude towards the behavior (a set of personal beliefs about the consequences of the final act) and subjective norms (a set of external, social influences).
FIGURE 2–TRA(AJZEN &FISHBEIN,1980)
The TRA can be used (and has been used) on virtually any kind of behavioral study and it has served as a foundation for many other models set on studying behavioral intention and actual behavior, such as the Technology Acceptance Model (TAM) proposed by (Davis, Bagozzi, & Warshaw, 1989).
FIGURE 3–TAM(DAVIS,BAGOZZI,&WARSHAW,1989)
When studying user behavior regarding adoption of new technologies it is impossible to bypass the TAM It has been widely used and tested and its constructs are still as solid today. It is more precise than the TRA in the sense that it is specifically designed to predict the adoption of technology, being perhaps its most influential extension. Since its inception, substantial theoretical and empirical support has accumulated in its favor, but many researchers (Wu & Wang, 2005; Wei, Marthandan, Chong, Ooi, & Arumugam, 2009; Hung, Ku, & Chang, 2003) suggest that the model needs to be
Attitude toward Behavior
Subjective Norm
Behavioral Intention Behavior
External Variables Perceived Usefulness Perceived Ease of Use Attitude
extended with additional constructs in order to provide better explanations and predictions of user behavior.
The TAM assumes behavioral intention and users’ perceptions of the information tool are the crux of technology acceptance, but it doesn’t take into account the already discussed fundamental social component of MI and MDS. The role of subjective norm in technology acceptance is quite intricate and obscure (Schepers & Wetzels, 2007) but many studies found its influence to be considerable (Venkatesh & Davis, 2000).
Considering the validity of TAM and its extensive testing and usage in extant mobile commerce research, this study adopts its fundamental constructs of perceived usefulness and actual use, where we want to place our focus, extending it further with the previously expounded constructs relative to context of use, including physical context, social context and task-related context (playing the role of what would be external variables in the TAM model itself).
3 Conceptual Model and Research Hypotheses
3.1 Conceptual Model
The previously mentioned models have been consistently proved valid in IT (Information Technology) and EC (Electronic Commerce) research (Zhang, Zhu, & Liu, 2012). As MDS is greatly related to IT and EC, it is fitting to use those models as basic foundations in our study.
In line with the goal of this dissertation and based on the presented models and literature review, the following conceptual model is proposed, based on the constructs that have been used and widely tested by the TAM and TRA but focusing on context of use as the main influencer of perceived usefulness:
FIGURE 4–PROPOSED CONCEPTUAL MODEL
H1 + H4+ H2 + H5 + H3+ H6+ Perceived Usefulness Physical Context Task-Related Context Social Context (Subjective Norm) Actual Use Perceived Usefulness Physical Context Task-Related Context Subjective Norm
3.1.1 Detailed View
H1: Physical Context is
significantly positively correlated with Perceived Usefulness.
H2: Task-Related Context is significantly positively correlated with Perceived Usefulness.
H3 Subjective Norm is
significantly positively correlated with Physical Context.
H4: Subjective Norm is
significantly positively correlated with Task-Related Context.
H5: Subjective Norm is
significantly positively correlated with Perceived Usefulness.
H6: Perceived Usefulness is significantly positively correlated with Actual Use.
FIGURE 5–CONCEPTUAL MODEL’S DETAILED VIEW
Perceived Usefulness Physical Context Perceived Usefulness Task-Related Context Physical Context Subjective Norm Task-Related Context Subjective Norm Perceived Usefulness Subjective Norm Actual Use Perceived Usefulness
3.2 Constructs
The following constructs will be the object of the upcoming data analysis. Table 1 contains a list of the already explained constructs for quick reference, including their definition and respective sources.
Constructs Construct Definition Sources
Actual Use of MI/MDS (AU)
Tangible actions of the user regarding service adoption. Actual use of mobile data services, in this specific case.
(Ajzen & Fishbein) (Davis, Bagozzi, &
Warshaw)
Physical Context (PC)
Context is described as the full set of personal and environmental factors that may influence a person when using MDS (being at home).
(Reuver & Bouwman) (Lee & Kim)
Subjective Norm (SN)
A person’s individual perception of what others think about his or her behavior. This reflects societal pressures such as the need for individuality, or mass media and opinion makers’ influence.
(Ajzen & Fishbein) (Ding) (Kargin & Basoglu)
(Venkatesh V. M.)
Task-related Context (TC)
The general task being performed by the user, which could be hypothetically enhanced by the use of MDS.
(Daft & Lengel) (Goodhue & Thompson)
(Reuver & Bouwman)
Perceived Usefulness (PU)
Defined as the degree to which a person believes that using a particular system would be useful for himself or herself.
(Davis, Bagozzi, & Warshaw)
4. Methodology
4.1 Questionnaire Design
The questionnaire was designed having in mind the goal of obtaining as vast an amount of information as possible at once, sacrificing focus for reusability.
That means that even though the questionnaire was not designed specifically for this particular study it is well suited for it as it is for many others since it generated large amounts of information.
Only the answers to the questions mentioned in the measurement scales table were used for the purposes of this particular dissertation.
4.2 Sampling Procedure
The questionnaire was answered by a sample of 601 respondents selected at random. The sample was obtained through Netsonda, which detains a respondent panel of more than 65.000 participants, registered voluntarily along the past 10 years using multiple recruiting campaigns. Sampling was randomized within Netsonda’s panel so that the intended socio-demographic profile could be attained.
Netsonda guarantees randomness within its vast online panel, which is to be used exclusively in market research. This Panel is created from among distinct sources and meets ESOMAR’s 26 questions (Harris Interactive, 2009).
Supervision will be done according to the following principles:
1. One supervisor will accompany 100% of the field work, assuring that the work is done correctly and providing immediate correction if necessary.
2. Any response that takes 50% more or 50% less time to answer than the average will be thoroughly inspected and redone if necessary.
The database was subjected to evaluation through computerized means in order to test its reliability.
4.3 Measurement Scales
The variables listed on Table 2 were used to measure the proposed constructs (PU à Perceived Usefulness; AU à Actual Use; SC à Social Context; PC à Physical Context; TC à Task-related Context). All variables are ordinal (Likert scales). On the right column, a list of questions corresponding to each variable can be found, in the same order as presented in the original questionnaire.
Variable Survey Questions (Likert scale)
PU Generally speaking, how valuable do you find the following wireless communication services?
PU1 Emailing
PU2 Downloading apps (free of charge)
PU3 Collaborative work
PU4 Social networking (e.g. Facebook, Yahoo messenger, sharing contact info)
AU How often have you used the following wireless communication services below in the last full month?
AU1 Social networking
AU2 Emailing
AU3 Downloading apps (free of charge)
AU4 Collaborative working
SN To what extent do you agree with the following statements?
SN1 My friends/colleagues think everyone should use wireless data services
SN2 Most of my colleagues think using wireless data services is a good idea
SN3 In my profession it's advisable to use wireless data services
SN4 My family and friends encourage me to use wireless data services
PC In what circumstances are you most likely to use wireless data services?
PC1 When a passenger in a car or taxi
PC2 When on a bus or train
PC3 When waiting (e.g. for a bus or a friend, in line)
PC4 When taking a walk
PC5 When in a cafe (e.g. Starbucks)
TC How likely are you to use wireless data services for the following reasons?
TC1 Keep track of important personal and wellness data
TC2 Manage and organize time spent on different projects
TC3 Track money in real-time, generate financial reports
TC4 Finding restaurants, events in the neighborhood
4.4 Statistical Techniques
Given the considerable sample size of respondents, a number of specific statistical techniques must be used in order to properly examine the data and reach proper results.
The first procedure involves a number of exploratory Principal Component Analyses (PCA), which will provide great insight into how our data is organized. These PCAs will allow us to better understand how data is organized and a final PCA will be done to extract a smaller number of variables (our constructs, or factors), effectively reducing the size of our data, making its analysis and interpretation easier. These factors must then be submitted to some validity tests, namely KMO’s test of measure adequacy, Bartlett’s test of sphericity and Cronbach’s alpha in order to assess their validity and internal consistency. A confirmatory Cluster Analysis will also be done to further test our extracted factors, assuring that the components generated with the previous PCA are indeed consistent.
The global validity of our conceptual model and the relations between our constructs must then be assessed using linear regressions and testing their assumptions. Each correlation will assessed using linear regressions and each linear regression will be tested to assure its validity, as done with the previous PCA. This will allow us to evaluate the conceptual model and its relations.
Every statistical procedure will be explained in further detail in the Data Analysis section. For quick reference, the list on the following page depicts the order of the statistical procedures used during the data analysis stage.
i. Exploratory PCAs;
ii. PCA
iii. Reliability tests
a. KMO’s measure of sampling adequacy
b. Bartlett’s test of sphericity
c. Cronbach’s alpha
iv. Cluster Analysis
v. Global validity tests
a. Linear regression correlation quality
5. Results
5.1 Achieved Sample
The following table depicts the demographic profile of our sample:
Item Frequencya Percent
Age 18-24 128 21,3 25-34 168 28,0 35-44 162 27,0 45-55 143 23,8 Gender M 284 47,3 F 317 52,7 Education Basic Education 12 2,0 Secondary Education 231 38,4 Bachelor’s Degree 260 43,3 M.Sc. 59 9,8 Ph.D. 11 1,8 Other 28 4,7 Annual Income < €15,000 375 62,4 €35,000 - €100,000 129 21,5 > €100,000 15 2,5 NS/NR 82 13,6
Hours spent on home PC each day
< 1 hour 138 22.9
1-2 hours 160 26,6
> 2 hours 297 49,4
I don’t have a PC at home 2 ,3
Other 4 ,7
MDSb Yes 601 100
No 0 0
aN = 601
bDoes your cellphone support MDS? TABLE 3–SAMPLE DEMOGRAPHICS
Gender distribution is balanced, with the majority of the respondents being relatively young graduates with an annual income of less than 15.000€, who spend more than two hours per day on their home PCs. All respondents claimed to have access to MDS.
5.2 Data Reduction and Component Extraction
The Principal Component Analysis (PCA) serves many purposes in business management and the social sciences. It is particularly convenient because it facilitates the analysis of large and complex collections of data by reducing them to a more manageable size, which in turn makes for a more useful and concise presentation of information and, consequently, better decision making.
A PCA was used in this study with the objective of reducing the dimension of data from a large number of variables (21) to a smaller number (5) which can be easily analyzed while still being representative of the initial data set.
A total of five factors were extracted, based on the Kaiser criterion, which is the most commonly used for how many factors to extract from the analysis. According to the criterion, any individual factor should account for the variance of at least one variable, which corresponds to an Eigenvalue of at least 1 (Hair, Black, Babin, & Anderson, 2009). Thus, only the factors with an Eigenvalue greater than one were retained, which together explain 64.4% of total variance. Please refer to Table 5 for exact values. Each of the five factors relates to one of the earlier proposed constructs:
1. The first extracted factor relates to the physical context (PC) in which one individual tends to use MDS and explains 15.5% of variance.
2. The second factor refers the impact of subjective norm (SN) in an individual’s use of MDS and explains 13.0% of variance.
3. The third factor represents actual statistical usage (AU) of selected MDS in the last full month and explains 12.3% of variance.
4. The fourth factor indicates task-related context (TC) in which an individual is more likely to use MDS and explains 12.2% of variance.
5. The fifth and final factor denotes the perceived usefulness (PU) of the selected data services by an individual and explains 11.2% of variance.
Factor PC SN AU TC PU Cronbach’s α 1 PC1 ,829 ,097 ,102 ,017 ,033 ,861 PC2 ,824 ,074 -,007 ,073 ,220 PC3 ,813 ,110 ,022 ,048 ,171 PC4 ,747 ,057 ,142 ,139 -,006 PC5 ,669 ,132 ,124 ,172 ,148 2 SN1 ,104 ,877 ,121 ,073 -,005 ,824 SN2 ,087 ,877 ,099 ,045 ,122 SN3 ,073 ,700 ,105 ,179 ,228 SN4 ,196 ,653 ,159 ,247 ,001 3 AU1 ,118 ,056 ,832 ,056 ,201 ,785 AU2 ,051 ,174 ,755 ,132 ,188 AU3 ,118 ,108 ,737 ,155 ,209 AU4 ,045 ,153 ,588 ,250 ,091 4 TC1 ,118 ,002 ,123 ,805 ,019 ,811 TC2 ,126 ,252 ,156 ,763 ,170 TC3 ,084 ,176 ,181 ,760 -,094 TC4 ,099 ,136 ,127 ,681 ,347 5 PU1 ,115 ,080 ,181 ,020 ,762 ,752 PU2 ,080 ,023 ,204 ,053 ,712 PU3 ,150 ,176 ,087 ,137 ,711 PU4 ,217 ,033 ,408 ,092 ,566
Extraction Method: Principal Component Analysis. Rotation Method: Varimax with Kaiser Normalization. a. Rotation converged in 6 iterations.
Note: SN = Subjective norm; AU = Actual Use; TC = Task-related Context; PU = Perceived Usefulness; PC= Physical Context.
TABLE 4–PCA FACTOR LOADINGS AND INTERNAL CONSISTENCY (CRONBACH’S ALPHA)
Factor Cumulative % Eigenvalues
1 15,543 6,282
2 28,507 2,349
3 40,869 2,029
4 53,087 1,662
5 64,357 1,193
TABLE 5–CUMULATIVE % OF VARIANCE EXPLAINED AND INITIAL EIGENVALUES OF FACTORS
Kaiser-Meyer-Olkin.
,829
Measure of Sampling Adequacy Approx.
Chi-Square 5115,43 Bartlett's
Test of Sphericity df 210 Sig. ,000 TABLE 6–KMO’S MEASURE OF SAMPLING ADEQUACY AND BARTLETT'S TEST OF SPHERICITY
After obtaining the results of a PCA, some tests must be done to assess its reliability and consistency. Only by obtaining acceptable values in these widely adopted tests can our PCA be considered statistically relevant.
In this study, KMO’s test of sampling adequacy was used, as well as Bartlett’s test of sphericity. Then, each factor was subjected to an internal reliability analysis to verify their internal consistency.
1. Regarding KMO’s test of sampling adequacy, the value of 0.829 on the first row of Table 6 means that there is a good correlation between variables, substantiating the analysis in question.
2. As for Bartlett’s test of sphericity, assuming α = 0.05, it is statistically admissible that the correlation matrix is different from the identity matrix since the p. value = 0.000 and therefore p < α, as can be seen on the last row of Table 6.
3. About Cronbach’s alpha, the last column of Table 4 indicates the results of Cronbach’s alpha reliability analysis for each factor. Cronbach's alpha is an index of internal reliability of the underlying construct (each factor relates to a construct). It ranges in value from 0 to 1. According to Nunnaly (1978) 0.7 is an acceptable reliability coefficient (Table 8). None of the factors scored below 0.75.
KMO Internal Reliabilty 1 – 0.9 Very good 0.8 – 0.9 Good 0.7 – 0.8 Acceptable 0.6 – 0.7 Reasonable 0.5 – 0.6 Bad < 0.5 Unacceptable
TABLE 7–KMO’S SAMPLING ADEQUACY VALUE INTERPRETATION
Cronbach’s α Internal Reliabilty 1 – 0.9 Very good 0.8 – 0.9 Good 0.7 – 0.8 Acceptable 0.6 – 0.7 Bad
< 0.6 Unacceptable
TABLE 8–CRONBACH’S ALPHA VALUE INTERPRETATION
The tables above provide qualitative interpretations for the results of KMO and Cronbach’s alpha reliability tests, respectively.
5.3 Confirmatory Cluster Analysis
Having successfully extracted five factors from the previous PCA, a confirmatory Cluster Analysis was used using Ward’s Method and Squared Euclidean Distances to further corroborate our analysis.
Ward’s Method involves an agglomerative clustering algorithm, that is to say, for n sample units, Ward's Method starts out with all units in n clusters of size 1, then, in the first step, n - 1 clusters are formed, one of size two and the remaining of size 1. The error sum of squares and r2 values are then calculated, and the pair of sample units that produce the smallest error sum of squares then will form the first cluster. The Cluster Analysis goes on until all the observations are included into one single cluster.
The following dendrogram makes it simple to identify the homogeneous groups which resulted from the Cluster Analysis:
Note: Next to the Y axis, on the left, are the variable names as inserted on SPSS, which do not correspond to the number of the question they represent.
The above dendrogram is a visual representation of how the data was arranged after performing the cluster analysis. The individual variables are set along the Y axis and can be referred to as leaf nodes. Clusters are formed by joining individual variables or existing clusters, with the join point being referred to as a node. At each node we have sub-branches of clustered variables. The X axis is denotes a distance measure between clusters, the less distant two clusters or variables are, the more correlated they are. Dendrograms make it easier to visualize the clustered solution that results after doing a cluster analysis.
As can be seen in Figure 6, a five cluster solution is presented in the obtained dendrogram, which seconds the previously done PCA, each cluster relating to one of the previously obtain factors. Variable codes can be seen on the Y axis.
The constructs have proven to be statistically adequate.
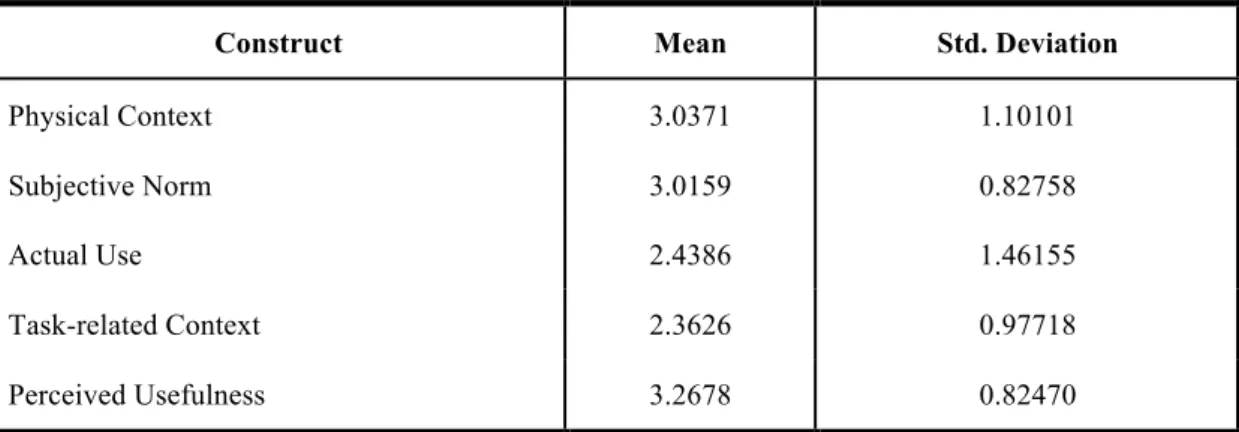
Table 9 contains simple descriptive data (mean and standard deviation) on each one of them. Keep in mind that all are based on Likert scales.
Construct Mean Std. Deviation
Physical Context 3.0371 1.10101
Subjective Norm 3.0159 0.82758
Actual Use 2.4386 1.46155
Task-related Context 2.3626 0.97718
Perceived Usefulness 3.2678 0.82470
TABLE 9–CONSTRUCT’S DESCRIPTIVE STATISTICS
With the constructs having so far proven to be statistically valid, the next step of the analysis will be to verify the global quality of the proposed model.
5.4 Assessment of the Conceptual Model
Each one of the conceptual model’s relationships will be analyzed individually with linear regressions. This will allow us to conclude if the proposed hypotheses are supported and the quality of the relations between the constructs. The results of the linear regressions are listed in Table 10.
Hypothesis r2 Coefficient Supported
Task-related Context à Perceived Usefulness 9.9% 0.265 Yes Subjective Norm à Perceived Usefulness 8.4% 0.288 Yes Physical Context à Perceived Usefulness 12.6% 0.266 Yes
Subjective Norm à Physical Context 8.7% 0.393 Yes
Subjective Norm à Task-related Context 15.4% 0.463 Yes
Perceived Usefulness à Actual Use 25.4% 0.894 Yes
TABLE 10–RESULTS OF HYPOTHESIS TESTING
As can be seen all the hypotheses are statistically supported, even though the quality of the relations, represented by r2, is not the best.
The values of r2 mean that for that particular hypothesis, that percentage value of the total variation of the dependent variable is explained by the total variation of the independent variable e.g. 9.9% of the total variation of Perceived Usefulness is explained by the variation of the Task-related Context. Looking at the table it can be seen that our context related constructs explain about 30% of the variation of Perceived Usefulness. Subjective Norm does a much better job of explaining Task-related Context (15.4%) than Physical Context (8.7%) and Perceived Usefulness explains 25.4% of the variance of Actual Use.
The coefficients are the values by which the dependent variables change for each unit increase (or decrease) in the independent variable, e.g. for each unitary increase of Perceived Usefulness, Actual Use is expected to increase 0.894 units.
FIGURE 7–CONCEPTUAL MODEL WITH R2 VALUES SUPERIMPOSED
FIGURE 8–CONCEPTUAL MODEL WITH COEFFICIENT VALUES SUPERIMPOSED
There appear to be strong correlations in some key positions of the proposed model, such as the influence of Subjective Norm on Task-Related-Context or of Perceived Usefulness on Actual Use. Before reaching any conclusions the linear regression’s statistical validity must be tested.
12.6% 8.4% 15.4% 9.9% 25.4% 8.7% Perceived Usefulness Physical Context Task-Related Context Social Context (Subjective Norm) Actual Use Perceived Usefulness Physical Context Task-Related Context Social Context (Subjective Norm) Actual Use 0.266 0.288 0.265 0.894 0.463 0.393 Perceived Usefulness Physical Context Task-Related Context Social Context (Subjective Norm) Actual Use Perceived Usefulness Physical Context Task-Related Context Social Context (Subjective Norm) Actual Use
5.4.1 Testing the Simple Linear Regressions
One final step remains to assess the global quality of our model: in order to be proven valid, each regression must conform to the six assumptions of the simple linear regression model.
The classical assumptions of the simple linear regression model are as follows. Each hypothesis, and therefore, each regression, must comply with every assumption in order to be considered valid:
1. Linear Relation: a linear relation exists between the dependent variable and the independent variables;
2. Zero mean: for any set of values of the independent variables, the expected value of the residuals is 0;
3. No correlation between the residuals and the independent variable: residual values must be random;
4. No serial correlation of the residual values: there is no correlation between residuals – they are independent form each another;
5. Homoscedasticity: the variance of the residuals is constant for all values of the independent variable;
6. Normality: the error term is a normally distributed random variable.
Each linear regression will be tested to verify conformity to the assumptions listed above, one by one, as follows.
5.4.1.1 Linear Relation
It is safe to assume that in each hypothesis there is a linear relation between the dependent variable and the independent variable, as shown below:
1. 𝑃𝑈 = 𝛽!+ 𝛽!𝑃𝐶 + 𝜇 2. 𝑃𝑈 = 𝛽!+ 𝛽!𝑇𝐶 + 𝜇 3. 𝑃𝐶 = 𝛽!+ 𝛽!𝑆𝑁 + 𝜇 4. 𝑃𝑈 = 𝛽!+ 𝛽!𝑆𝑁 + 𝜇 5. 𝑇𝐶 = 𝛽! + 𝛽!𝑆𝑁 + 𝜇 6. 𝐴𝑈 = 𝛽!+ 𝛽!𝑃𝑈 + 𝜇 5.4.1.2 Zero mean
Every unstandardized residual mean is approximately equal to zero, as expected. The following table presents the SPSS outputs for each regression:
Means TC à PU ~ 0 × 10-7 SC à PU ~ 0 × 10-7 PC à PU ~ 0 × 10-7 SC à PC ~ 0 × 10-7 SC à TC ~ 0 × 10-7 PU à AU ~ 0 × 10-7
TABLE 11–UNSTANDARDIZED RESIDUAL MEANS CALCULATED FOR EACH REGRESSION
The values are zero times ten to the negative seventh power across the board, which is indeed very close to zero. The regressions conform to this assumption.
5.4.1.3 No correlation between the residuals and the independent variable
This can be assessed using a simple bivariate correlation test for each regression’s independent variable and the respective residual values. The results were as follows:
Hypothesis Independent Variable Pearson Correlation
TC à PU TC 0.000 SC à PU SC 0.000 PC à PU PC 0.000 SC à PC SC 0.000 SC à TC SC 0.000 PU à AU PU 0.000
TABLE 12–CORRELATIONS BETWEEN INDEPENDENT VARIABLES AND RESIDUALS
There is no correlation between any of the independent variables and the respective residuals. The regressions conform to this assumption.
5.4.1.4 No serial correlation of the residual values
To assess this assumption, our Durbin-Watson stat must be approximately 2 for each regression. Once more, the results can be found on the following table:
As can be seen on Table 13 results were quite favorable across the board, with every result being fairly close to 2
Durbin-Watson values TC à PU 2,006 SC à PU 2,017 PC à PU 1,992 SC à PC 2.155 SC à TC 2.209 PU à AU 1.914
TABLE 13–DURBIN-WATSON VALUES FOR EACH REGRESSION
5.4.1.5 Homoscedasticity
To test this assumption, a graphic solution is available.
In a scatterplot of standardized residuals against the values of the unstandardized predicted value, residual values must maintain a fairly constant distance to the horizontal axis (y = 0); in other words, there must be constant variability.
The resulting scatterplots can be found as images in the next page (one for each regression as labeled).
Graphical solutions can be tricky to analyze because they’re highly subjective, but in this particular case it is clear that the last three scatterplots (Figure 12, Figure 13 and Figure 14), do not present constant variation along the Y axis, which points towards heteroscedasticity.
The previous scatterplots (Figure 9, Figure 10 and Figure 11) present somewhat homoscedastic solutions, although not unequivocally homoscedastic.
This means that at least the linear regressions represented by the three final scatterplots failed this assumption – the estimators obtained through OLS (Ordinated Least Squares) are no longer BLUE (Best Linear Unbiased Estimates), which means that within the class of unbiased linear estimators, the 𝛽 parameters are not the most efficient. For H3,
FIGURE 9–TASK-RELATED CONTEXT àPERCEIVED
USEFULNESS
FIGURE 10–SUBJECTIVE NORM àPERCEIVED
USEFULNESS
FIGURE 11–PHYSICAL CONTEXT àPERCEIVED
USEFULNESS
FIGURE 12–SUBJECTIVE NORM àPHYSICAL
CONTEXT
FIGURE 13–SUBJECTIVE NORM àTASK-RELATED
CONTEXT
5.4.1.6 Normality
To test normality, the Kolomogorov-Smirnov (K-S) test is available. K-S values should be higher than 0.05 (for a significance level < 0.05). If the value is lower, then the null hypothesis is rejected and one must conclude that the residual values do not follow a normal distribution. The results of the K-S test are presented in table below:
Kolmogorov-Smirnov values TC à PU 0.066 SC à PU 0.016 PC à PU 0.029 SC à PC 0.001 SC à TC 0.026 PU à AU 0.001
TABLE 14–RESULTS OF NORMALITY TESTS
Only the first regression presents a value higher than 0.05, meaning that all the others would fail the assumption. However, for a sample size higher than 30, having the law of large numbers in consideration, it is safe to admit that the residual values do actually follow a normal distribution, asymptotically.
5.5 Summary and Major Results
The conceptual model used in this research integrated the proposed context-related constructs with the core of the TAM model. Results of this research are in line with the already established conclusions that TAM is still in fact a good predictor of MDS adoption and perfectly consistent with IT and EC studies.
All five factors extracted using the PCA, each one reflecting one of the proposed constructs, show very strong internal consistency and passed the multiple reliability tests with distinction, meaning they are dependable and statistically relevant.
From the correlation analysis all six relationships show significance, despite not demonstrating the best quality. Perceived Usefulness shows a relatively high influence
over Actual Use, with a coefficient of 0.89 and 25% of variance explained; however, the presence of heteroscedasticy makes this assumption invalid.
Subjective Norm appears to have little influence over Physical Context or Perceived Usefulness, but Physical and Task-Related Context do show a stronger influence over Perceived Usefulness.
Perhaps the most interesting result is the relatively high influence that Subjective Norm seems to have over Task-Related Context, possibly reflecting the fact that MDS users will in fact adopt different roles in different social contexts (e. g. an employee at work using productivity applications, a friend among friends using entertainment apps, a runner or bodybuilder in the gym using fitness apps, etc.) and therefore find use in different types of MDS, depending on the situation, which is in line with what this paper proposes to demonstrate.
Unfortunately, at least half the relationships failed to pass the homoscedasticity test (of the six simple linear regression assumptions) which means the statistical inference is not valid for these hypotheses (H3, H4 and H6). This may be due to the relative flatness of
the answers provided: the constructs Subjective Norm and Perceived Usefulness, present in all these Hypotheses, have very similar Means (3) and Std. Deviations (approx. 1), as can be confirmed back in Table 9, which could affect the variance negatively due to the apparent lack of independence between these two clusters (the mean and variation apparently increase together). One other explanation would be that perhaps the chosen measurement scales were not the best to test the proposed assumptions, even though they all passed the multiple validity and internal consistency tests after the PCA.
6. Conclusion
6.1 Major Contributions
Despite the conceptual model’s shortcomings, every facet of context of use proved to be positively correlated with the perceived usefulness of MDS and it is undeniable that different aspects of context affect perceived usefulness in different ways. Context proved to be an area worth exploring if one intends to capitalize on the specific context-related needs of the mobile consumer.
It is also important for businesses to understand that MDS are increasingly context-sensitive. Applications and/or other types of MDS that are context aware will have a clear advantage in the future as far as market targeting goes: thanks to the most recent developments in mobile technologies, targeted advertising (such as promotional coupons) may be delivered directly to your phone depending where you are, allowing for a context relevant ad experience. Consumers may opt in or out of these contextual ads to further increase targeting effectiveness using permission marketing. The kind of apps and messages you receive may very well be completely different based on your surroundings.
In conclusion, this study hopefully helps marketers better allocate their resources in order to enhance consumer’s perceived value of MDS, having in consideration just how important context will be in the coming years for mobile business, and makes clear that when approaching a subject as sensitive to context as MDS, it is worthwhile to go beyond the pre-established constructs and conduct deeper context analyses.
6.2 Limitations
The collected data is to some extent outdated. Because mobile technologies advance rapidly, today’s mobile consumer behavior might be different from 2010 and the “state of the art” is certainly very different; MI is more pervasive and access to MDS is cheaper and faster. Consumers may be more accepting of these kinds of services nowadays. Devices themselves are much more powerful. The tendency is still exponential growth for the next few years, especially with the upcoming shift to 4G technologies. Constant, periodical monitoring is needed to deliver relevant results in regards to the evolution of context of use.
Sampling is another limitation of this study. Although the sample itself is significantly sized, the attentiveness or truthfulness of the responses could be compromised because the survey is done online, despite Netsonda’s strict quality assurance processes.
6.3 Future research recommendations
MDS are evolving very rapidly. As stated before, a continuous research effort is necessary to keep up with the ever-changing trends of mobile consumerism. New data should be collected at least yearly to conduct reasonable trend analyses. The influence of context in MI and MDS adoption should be then further investigated, perhaps conjugated with a trend analysis or even using a qualitative approach (focus groups) to better identify the particulars of context in MDS before proceeding to quantitative analysis. An in-depth study focused specifically on context of use and how it relates to the actual use of MDS could prove invaluable in breaking the code of the mobile consumer’s mind.
Online surveys are an effective and relatively cheap way of obtaining a vast amount of data since it gives access to the type of consumer that is already most likely to own a tablet or smartphone: the one that is online.
The crucial point might even be in bringing together the technological possibilities of context-aware MDS and the privacy issues that rise with it, since the end-user must provide large amounts of personal data in order for context sensitive technologies to be of any use.
Bibliography
Accenture. (2012). Mobile Internet — spawning new growth opportunities in the
convergence era. Accenture.
Ajzen, I., & Fishbein, M. (1980). Understanding attitudes and predicting social
behavior. Englewood Cliffs: Prentice-Hall.
AlHinai, Y. S., Kurnia, S., & Smith, S. P. (2010). The adoption of mobile commerce services by individuals: A Current State of the Literature. Pacific Asia
conference on information systems proceedings, (p. 72).
ANACOM. (2012). Situação das Comunicações. Lisbon: ANACOM.
Bhattacher, A. (2000). Acceptance of Internet applications services: the case of electronic Brokerages. IEEE Transactions on systems, Man, and Cybernetics –
Part A: Systems and Humans, 411-420.
Bouwman, H., & Wijngaert, L. v. (2009). Coppers context, and conjoints: a reassessment of TAM. Journal of Information Technology, XXIV, 186-201.
Carlsson, C. (2006). Special issue on mobile technology and services. Electronic
Commerce Research and Applications, V, 189-191.
Choi, H. (2004). An empirical study on factors influencing the use intention of mobile internet. Institute of Industrial and Management, 1399–1420.
Cisco. (2012, May 30). Internet traffic to grow four-fold to 2016 - Cisco. Retrieved September 24, 2012, from Telecompaper - Telecom news and research: http://www.telecompaper.com/news/internet-traffic-to-grow-four-fold-to-2016-cisco
Daft, R. L., & Lengel, R. H. (1984). Information richness: A new approach to managerial behavior and organizational design. Research in Organizational
Behavior, VI, 191-233.
Davis, F. D., Bagozzi, R. P., & Warshaw, P. R. (1989). User Acceptance of Computer Technology: A Comparison of Two Theoretical Models. Management Science, 982-1003.
Ding, X. (2010). A study on adoption behavior of mobile commerce consumer based on TAM-MIA. Progress in Informatics and Computing (pp. 1305-1309). Dalian: IEEE.
Gartner. (2012, May 16). Gartner Says Worldwide Sales of Mobile Phones Declined 2
Percent in First Quarter of 2012; Previous Year-over-Year Decline Occurred in Second Quarter of 2009. Retrieved from Technology Research | Gartner Inc.:
Gerpott, T. (2010). Communication behaviors and perceptions of mobile internet adopters. Journal of Policym Regulation and Strategy for Telecommunications,
Infromation and Media 12.4, 54-73.
Goodhue, D. L., & Thompson, R. L. (1995). Task-Technology Fit and Individual Performance. Mis Quarterly, XIX, 213-236.
Hair, J. F., Black, W. C., Babin, B. J., & Anderson, R. E. (2009). Multivariate Data
Analysis (7th Edition). Prentice Hall.
Harris Interactive. (2009). ESOMAR 26 questions. Retrieved 12 23, 2012, from Harris Interactive: www.harrisinteractive.com
Hong, S., & Tam, K. Y. (2006). Understanding the adoption of multipurpose information appliances: the case of mobile data services. Information Systems
Research, 17, 162-179.
Hung, S. Y., Ku, C. Y., & Chang, C. M. (2003). Critical factors of WAP services adoption: An empirical study. Electronic Commerce Research and Applications, 42–60.
I. Brown, Z. C. (2003). Cell phone banking: predictors of adoption in South Africa—an exploratory study. International Journal of Information Management, 23, 381-394. Retrieved September 26, 2012
International Telecommunication Union. (2011, November). Global mobile statistics
2012 Part A: Mobile subscribers; handset market share; mobile operators.
Retrieved September 24, 2012, from mobiThinking:
http://mobithinking.com/mobile-marketing-tools/latest-mobile-stats/a#subscribers
ITU. (2002). ITU Internet Reports - Internet for a Mobile Generation. Geneva: International Telecommunication Union (ITU).
Jain, R. (2005, September). Tomorrow's Internet; The two key drivers which will define tomorrow's internet are broadband networks and mobile phones. Business
Today, 98-98.
Kargin, B., & Basoglu, N. (2007). Factors Affecting the Adoption of Mobile Services.
PICMET 2007 (pp. 2993-3001). Oregon: PICMET.
Kim, H. W., Chan, H. C., & Gupta, S. (2007). Value-based adoption of mobile Intern et: An empirical investigation. Decision Support Systems, 111-126.
Kleijnen, M., De Ruyter, K., & Wetzels, M. (2007). An assessment of value creation in mobile service delivery and the moderating role of time consciousness. Journal