HAZARD IDENTIFICATION AND RISK ANALYSIS IN
MINING INDUSTRY
A THESIS SUBMITTED IN PARTIAL FULFILLMENT OF THE REQUIREMENTS FOR THE DEGREE OF
Bachelor of Technology
In
Mining Engineering
By
AMOL PAITHANKAR
107MN026
DEPARTMENT OF MINING ENGINEERING
NATIONAL INSTITUTE OF TECHNOLOGY
ROURKELA-769008
HAZARD IDENTIFICATION AND RISK ANALYSIS IN
MINING INDUSTRY
A THESIS SUBMITTED IN PARTIAL FULFILLMENT OF THE REQUIREMENTS FOR THE DEGREE OF
Bachelor of Technology
In
Mining Engineering
By
AMOL PAITHANKAR
107MN026
Under the guidance of
Dr. H. B. SAHU
Associate Professor
DEPARTMENT OF MINING ENGINEERING
NATIONAL INSTITUTE OF TECHNOLOGY
ROURKELA-769008
i
National Institute of Technology, Rourkela
C E R T I F I C A T E
This is to certify that the thesis entitled “Hazard Identification and Risk Analysis in Mining Industry” submitted by Sri Amol Paithankar (Roll No. 107MN026) in partial fulfilment of the requirements for the award of Bachelor of Technology degree in Mining Engineering at the National Institute of Technology, Rourkela is an authentic work carried out by him under my supervision and guidance.
To the best of my knowledge, the matter embodied in this thesis has not formed the basis for the award of any Degree or Diploma or similar title of any University or Institution.
Date: Dr. H. B. Sahu Associate Professor Department of Mining Engineering
ii
A C K N O W L E D G E M E N T
I wish to express my gratitude and indebtedness to Dr. H. B. Sahu, Associate Professor, Department of Mining Engineering, National Institute of Technology, Rourkela for his valuable guidance, constructive and valuable suggestions throughout the project work. I express my sincere thanks to him for his thorough supervision at every stage of the work.
I would like to express my thanks to the faculty members of the department for their suggestions, which helped in improving the work.
I would also like to extend my sincere thanks to the officials of the iron ore and coal mines I visited for carrying out the field studies. I am particularly thankful to Er. Tapan Jena, Training Officer, Tata Steel, Joda; and Er S. K. Singh, Safety officer, South Eastern Coalfields Limited, Raigarh area, for their help in visiting the mines.
Last but not the least, I express my sincere thanks to all my family members and friends for their help and encouragement for accomplishing this undertaking.
Date: AMOL PAITHANKAR 107MN026 Department of Mining Engineering
iii
A B S T R A C T
For any industry to be successful it is to identify the Hazards to assess the associated risks and to bring the risks to tolerable level. Mining activity because of the very nature of the operation, complexity of the systems, procedures and methods always involves some amount of hazards. Hazard identification and risk analysis is carried for identification of undesirable events that can leads to a hazard, the analysis of hazard mechanism by which this undesirable event could occur and usually the estimation of extent, magnitude and likelihood of harmful effects. It is widely accepted within industry in general that the various techniques of risk assessment contribute greatly toward improvements in the safety of complex operations and equipment.
Hazard identification and risk analysis involves identification of undesirable events that leads to a hazard, the analysis of hazard mechanism by which this undesirable event could occur and usually the estimation of extent, magnitude and likelihood of harmful effects. The objective of hazards and risk analysis is to identify and analyze hazards, the event sequences leading to hazards and the risk of hazardous events. Many techniques ranging from simple qualitative methods to advanced quantitative methods are available to help identify and analyze hazards. The use of multiple hazard analysis techniques is recommended because each has its own purpose, strengths, and weaknesses.
As the part of the project work, hazard identification and risk analysis was carried out for an iron ore mine and a coal mine and the hazards were identified and risk analysis was carried out. The different activities were divided in to high, medium and low depending upon their consequences and likelihood. The high risks activities have been marked in red colour are un-acceptance and must be reduced. The risks which are marked in yellow colour are tolerable but efforts must be made to reduce risk without expenditure that is grossly disproportionate to the benefit gained. The risks which are marked in green have the risk level so low that it is not required for taking actions to reduce its magnitude any further.
iv
roads were not proper for haulage purpose, inappropriate use of personal protective equipment and inrushes of water into the mine causing inundation.
v
C O N T E N T S
SUBJECT PAGE NO.
CERTIFICATE i
ACKNOWLEDGEMENT ii
ABSTRACT iv
LIST OF FIGURES vi
LIST OF TABLES vii
CHAPTER 1: INTRODUCTION 1
1.1 Need for Risk Assessment
1.2 Objective 3 3
CHAPTER 2: LITERATURE REVIEW 4
CHAPTER 3: ACCIDENTS IN MINES AND THEIR ANALYSIS 10
3.1 Hazards in different operations and precautions in surface mines 3.2 Hazards in underground working
3.3 Accident statistics in Indian mines
11 15 17
CHAPTER 4: RISK ASSESSMENT 28
4.1 Different terminologies associated with risk assessment 4.2 Types of hazard identification and risk analysis
4.3 The inter-relationship between types of hazard identification and risk analysis
4.4 Risk analysis 4.5 Acceptable risk
4.6 Methodologies for risk analysis
4.7 Risk assessment procedures
29 31 32 34 35 36 44
CHAPTER 5: HAZARD IDENTIFICATION AND RISK ANALYSIS - CASE STUDIES
51
5.1 Case study of an iron ore mine 5.2 Case study of a coal mine
52 59
CHAPTER 6: DISCUSSION AND CONCLUSION 65
6.1 Discussion 6.2 Conclusion
66 69
vi
LIST OF FIGURES
Figure 3.1: Average accidents in coal mines
Figure 3.2: Pi Chart representation for average accidents in coal mines Figure 3.3: Average accidents in non-coal mines
Figure 3.4: Pi Chart representation for average accidents in coal mines Figure 3.5: Average cause wise fatal accidents in coal mines in 2007
Figure 3.6: Pi chart representation of average cause wise fatal accidents in coal mines in 2007 Figure 3.7: Average cause wise serious accidents in coal mines in 2007
Figure 3.8: Pi chart representation of average cause wise serious accidents in coal mines in 2007
Figure 3.9: Average cause wise fatal accidents in non-coal mines in 2007
Figure 3.10: Pi chart representation of average cause wise fatal accidents in non-coal mines in 2007
Figure 3.11: Average cause wise serious accidents in non-coal mines in 2007
Figure 3.12: Pi chart representation of average cause wise serious accidents in non-coal mines in 2007
Figure 4.1: The European community‟s definition of risk.
Figure 4.2: The inter-relationship between different types of HIRA. Figure 4.3: Steps in risk assessment
Figure 4.4: The risk acceptability criteria. Figure 4.5: Example risk map
Figure 4.6: Example of risk profile Figure 4.7: Example of Exposure Profile
Figure 4.8: HAZOP (Hazard and operability analysis) Concept. Figure 4.9: Procedure of Event Tree Analysis
vii
LIST OF TABLES
Table 3.1: Trend in Fatal Accidents and Fatality in Coal mines (1951-2007) Table 3.2: Trend in Fatal Accidents and Fatality in Non-Coal mine (1951-2007) Table 3.3: Trend of Accidents in Coal Mines – Cause wise (2001-07)
Table 3.4: Trend of Accidents in Non-coal Mines – Cause wise (2001- 07) Table 4.1: A qualitative method for the classification of risks
Table 4.2: Risk Likelihood Table for Guidance
Table 4.3: Example of a basic semi-quantitative risk rating matrix
1
CHAPTER 1
2
1.
INTRODUCTION
For any industry to be successful it should meet not only the production requirements, but also maintain the highest safety standards for all concerned. The industry has to identify the hazards, assess the associated risks and bring the risks to tolerable level on a continuous basis. Mining being a hazardous operation has considerable safety risk to miners. Unsafe conditions and practices in mines lead to a number of accidents and causes loss and injury to human lives, damages the property, interrupt production etc. Risk assessment is a systematic method of identifying and analysing the hazards associated with an activity and establishing a level of risk for each hazard. The hazards cannot be completely eliminated, and thus there is a need to define and estimate an accident risk level possible to be presented either in quantitative or qualitative way.
Because of the existing hazards of mining as an activity and the complexity of mining machinery and equipment and the associated systems, procedures and methods, it is not possible to be naturally safe. Regardless of how well the machinery or methods are designed, there will always be potential for serious accidents. It is not possible for an external agency to ensure the safety of an organisation such as a mining company nor of the machinery or methods it uses. The principal responsibility for the safety of any particular mine and the manner in which it is operated rest with the management of that mine. It is widely accepted within industries in general that the various techniques of risk assessment contribute greatly toward improvements in the safety of complex operations and equipment. In many industries there is legislative requirement for risk assessment to be undertaken of all hazardous equipment, machinery and operations taking account of the procedures used for operation, maintenance, supervision and management.
Hazard identification and risk analysis involves identification of undesirable events that leads to a hazard, the analysis of hazard mechanism by which this undesirable event could occur and usually the estimation of extent, magnitude and likelihood of harmful effects.
3
more commonly used techniques for risk assessment include: failure modes and effects analysis (FMEA), hazard and operability studies (HAZOP), fault-tree analysis (FTA), event-tree analysis (ETA) etc.
1.1 NEED FOR RISK ASSESSMENT
Risk assessments will help the mine operators to identify high, medium and low risk levels. Risk assessments will help to prioritise risks and provide information on the probability of harm arising and severity of harm by understanding the hazard, combine assessments of probability and severity to produce an assessment of risk and it is used in the assessment of risk as an aid to decision making. In this way, mine owners and operators will be able to implement safety improvements. Different types of approaches for the safety in mines various tools and appropriate steps have to be taken to make mining workplace better and safer.
A Hazard Identification and Risk (HIRA) analysis is a systematic way to identify and analyse hazards to determine their scope, impact and the vulnerability of the built environment to such hazards and its purpose is to ensure that there is a formal process for hazard identification, risk assessment and control to effectively manage hazards that may occur within the workplaces.
1.2 OBJECTIVES
Keeping the aforementioned problems in mind, the project work has been planned with the following objectives
Review of literature on Hazard Identification and Risk Assessment Review of accidents in mines and their analysis.
Study of risk assessment methodologies.
4
CHAPTER 2
5
2.
LITERATURE REVIEW
The following is the brief review of the work carried out by different researchers in the field of hazard identification and risk analysis (HIRA).
Qureshi (1987) had done a Hazard and Operability Study (HAZOP) in which potential hazards and identified by looking at the design in a dynamic manner
To identify the nature and scale of the dangerous substances;
To give an account of the arrangements for safe operation of the installation, for control of serious deviations that could lead to a major accident and for emergency procedures at the site;
To identify the type, relative likelihood and consequences of major accidents that might occur; and
To demonstrate that the manufacturer (operator) has identified the major hazard potential of his activities and has provided appropriate controls.
Khan and Abbasi (1995) proposed optimal risk analysis (ORA) which involved the following:
1. Hazard identification and screening.
2. Hazard analysis using qualitative hazard assessment by optimal hazard and operability study (optHAZOP).
3. Probabilistic hazard assessment by modified fault tree analysis (MFTA).
4. Consequence analysis which include development of accident scenarios and damage potential estimates.
5. Risk estimates.
Carpignano et al. (1998) applied quantitative risk analysis (QRA) for drawing conclusions concerning serious accidental events with the occurrence frequency and the consequences. The QRA approach they selected was based on reservoir analysis and management systems (RAMS) such as Preliminary Hazard Analysis (PHA), Failure Mode Effect and Critical Analysis (FMECA), Fault Tree Analysis (FTA), Event Tree Analysis (ETA) and Cause Consequence Analysis and were able
6
To determine the related consequences with respect to workers, population and the environments.
Duijm (2001) identified hazards for six different techniques for disposing decommissioned ammunition. Use has been made of functional modelling as a basis for hazard identification. Risk levels are estimated based on general accident rates in the chemical industry. The
disposal techniques are “open burning” (OB), “open detonation” (OD), “closed detonation” (CD), “fluidised bed combustion” (FBC), “rotary kiln (RK) incineration”, “mobile incineration” and Comparative risk levels for alternative disposal techniques for ammunition have been derived using hazard identification based on functional modelling of the techniques in combination with the required manpower to perform the operations.
Khan et al. (2001) developed safety weighted hazard index (SWeHI). In quantitative terms SWeHI represents the radius area under moderate hazard (50% probability of fatality/ damage).
In mathematical term it is represented as SWeHI = B/ A
Where B = Quantitative measures of damage that can be caused by unit/ plant. A= credits due to control measures and safety arrangements.
Lambert et al. (2001) used Hierarchical Holographic Modelling (HHM) for identification and management of risk source and prioritize the identified source of risk based on their likelihood and potential consequences and provided with options of risk management in terms of their costs and potential impacts on the acquisition schedule.
Bell and Glade (2003) have done a risk analysis focusing on risk to life. They calculated land slide risk and occurrence of potential damaging events as well as the distribution of the elements at risk and proposed the following approach for risk evaluation:
RISK = HAZARD * CONSEQUENCE * ELEMENT OF RISK
7
( ) ∑
( ) ∑
∑
Where
IR(x, y) = individual fatality risk at a specific location (x, y)
Pio(x, y) = conditional probability of fatality at specific location (x, y) at given
outcome incident case io. IO = total no. of incident event
Pio, d = conditional probability that the plant damage state case d will lead
to the incident outcome case io. D = total no. of plant damage states
Pd, I= conditional probability that the initiating event case I will lead to the
plant damage case d.
I = total no of initiating event.
Kecojevic and Radomsky (2004) studied about loader and truck safety and found out the severity and number of accidents involving loader and trucks are higher when compared to other operations. They established fatal categories and causes of accidents and control strategies are discussed and evaluated to increase hazard awareness.
Dziubinski et al. (2006) studied basic reasons for pipeline failure and its probable consequences taking individual and societal risk into consideration and proposed methodology of risk assessment for hazards associated with hazardous substance transport in long pipelines. Taking that methodology as example, subsequent stages of risk analysis were considered paying special attention to the applied techniques and calculation models. A specific feature of this methodology was a combination of qualitative and quantitative techniques which offer a possibility of a full risk assessment for long pipelines.
Laul et al. (2006) identified hazards (chemical, electrical, physical, and industrial) and potential initiators that could lead to an accident. Hazard analysis is used to evaluate
identified hazards. Hazard analysis is done by “what if check list”, Hazard and
8
advantages and disadvantages, for developing a safety document for chemical, non-nuclear facilities.
Jeong et al. (2007) made a qualitative analysis by Hazard and Operability Method (HAZOP) to identify the potential hazards and operability problems of decommissioning operations and concluded that the decommissioning of a nuclear research reactor must be accomplished according to its structural conditions and radiological characteristics and radiation exposure must be controlled to within the limitation of the regulation to perform the dismantling work under the ALARA principle safely.
Frank et al. (2008) carried out a risk assessment using common risk management tools. In basic tools, they used diagram analysis and risk rating and filtering. In advanced tools they used fault tree analysis (FTA), Hazard and Operability Analysis (HAZOP), Hazard Analysis and Critical Control Points (HACCP), Failure Mode Effect Analysis (FMEA) and established a severity categorization table which divides severity of consequence into noticeable, important, serious, very serious and catastrophic.
Nor et al. (2008) studied risk related to loaders and dozers and were assessed and ranked.
The hazards “failure to follow adequate maintenance procedure” and “failure of mechanical / electrical/ hydraulic components” were the most severe and frequent hazards
for the loaders and they fell into the category of high risk.
Hassan et al. (2009) carried out a Quantitative Risk Assessment (QRA) into basic steps including system definition, Hazard Identification, Frequency Analysis, Consequence Modelling, Risk calculations and Assessment to determine the safest route for the transportation of hazardous material.
Kecojevic and Nor (2009) studied reports on equipment related fatal incidents and showed that underground mining equipment including continuous miners, shuttle cars,
roof bolters, LHD‟s, longwall and hoisting contributed total of 69 fatalities. The study revealed the major hazards resulting in fatal incidents for continuous mining equipment,
9
Wang et al. (2009) applied HAZOP analysis to determine if the operation has potential to give rise to hazardous situation and found the range of hazardous events. They identified the route by which each of the hazardous events could be realised. After HAZOP analysis they introduced MO-HAZOP program which calculates probability of an event which is the product of probabilities of every factor.
10
CHAPTER 3
11
3.
ACCIDENTS IN MINES AND THEIR ANALYSIS
Mining is a hazardous operation and consists of considerable environmental, health and safety risk to miners. Unsafe conditions in mines lead to a number of accidents and cause loss and injury to human lives, damage to property, interruption in production etc. The following section presents the different hazards in surface and underground mines, their precautions and statistics of accidents in coal and non-coal mines.
3.1 HAZARDS IN DIFFERENT OPERATIONS AND PRECAUTIONS IN SURFACE MINES
The major hazards due to different mining operations and their prevention and control are as outlined below:
I. Surveying
Fall from heights.
Thrown from overturning vehicle.
Since hazards are by ground formation it is unlikely to be removed. By the use of good properly constructed scaffolds.
II. Clearance
Struck by falling tree and debris from demolition building. Can be avoided by using trained operator.
Use of power saw or by other equipment used for removal of top soil. Avoided by wearing full personal protection by operator.
III. Laying out
Hazards prevalent during construction of building.
Single storey building is less hazardous than a larger higher store building.
Hazard during construction of roadways.
Roadways on level ground will involve fewer hazards than on inclined terrain.
Overhead electricity lines.
Falling while working at height.
Avoid driving at the edge of roadway under construction.
Plant moving out of control.
12
Individual struck by moving vehicle.
Heavy earth moving equipment and vehicle drivers and those giving signals should be well trained.
IV. Drilling
Falling from the edge of a bench.
Part of training should include instructions to face towards the open edge of the bench so any inadvertent backward step is away from the edge.
Provide suitable portable rail fencing which can be erected between the drilling operations and the edge of the mine.
Attachment of a safety line to the drilling rig and provide harness for the driller to wear.
Inhalation of dust created during drilling operation. Use water during the drilling operations.
Providing a ventilation system on drilling rig with dust filter to remove harmful dust.
Noise
Risk is higher in older machines.
Newer drill machines are provided with cabin which controls noise level within cabins.
Providing operators with ear protection.
Entrapment of being struck by a moving and revolving part of the drill equipment. Accidents will be lowered by properly guarding dangerous parts of the
equipment.
Operators must be well trained and supervised.
V. Explosives
Poorly designed shots can result in misfires early ignition and flying rock.
Safety can be ensured by planning for round of shots to ensure face properly surveyed, holes correctly drilled, direction logged, the weight of explosion for good fragmentation.
13
VI. Face stability
Rock fall or slide
Regular examination of face must be done and remedial measures must be taken to make it safe if there is any doubt that a collapse could take place. Working should be advanced in a direction taken into account the geology
such that face and quarry side remain stable.
VII. Loading
Rock falling on the driver.
Plant toppling aver due to uneven ground.
Failure of hydraulic system.
Fires
Fall while gaining access to operating cabin.
Electrocution in Draglines.
Failure of wire ropes in Draglines.
Operator cabin should be of suitable strength to protect he driver in event of rock fall.
Electrical supply to dragline should be properly installed with adequate earth continuity and earth leakage protection.
Wire rope should be suitable for work undertaken and be examined periodically.
Ensure that loaders are positioned sufficiently away from face edges.
VIII. Transporting
Brake failure
Lack of all-around visibility from driver position
Vehicle movements particularly while reversing
Rollover
Vibrations
Noise
Dust and maintenance
Visibility defects can be eliminated by the use of visibility aids such as closed circuit television and suitable mirrors.
14
Seatbelt to protect driver in event of vehicle rollover.
Good maintenance and regular testing necessary to reduce possibility of brake failure.
IX. Processing of mineral 1) Crushing
Blockages
High noise
Dust
Vibrations
Use of hydraulic hammers to break up blockages.
Provide noise isolators and provide mechanical ventilation systems designed to remove any harmful dust.
2) Grinding
Noise
Dust
Entrapment
Confined spaces
Chemical additives
Noise and dust hazards can be reduced by providing noise isolation devices and air filtration system.
Chemical additives can be reduced by the adaptation of normal preventative measures such as substitution automated pipe feeds personal protection.
3) Screening
Dust
Noise
Vibration
Fall from height during maintenance
15
3.2HAZARDS IN UNDERGROUND WORKING
Fall of roof and sides
Roof and side of working should be kept secure. Support should be set as per systematic support rules. Fencing should be provided in unauthorised area.
Workers should not be permitted to work under unsupported roof. Safety prop with drawers should be used.
Temporary supports should be provided before clearing roof.
Collapse of pillar in coal mines
Stook left in depillaring must be kept of adequate size.
Air blast
Extensive area of un-collapsed roof should not be allowed to exist.
Seams with strong and massive roof rocks more no. of entries should be kept open.
Shelters should be provided at suitable sites.
Installation of warning system to warn people about imminent air blast.
Rock burst and bumps
X. Rope haulage
Runaway of tubs due to breakage of rope, failure of attachment to rope, failure of couplings and drawbars.
Rope should be selected properly and maintained with care.
Non functionality of safety devices.
Travelling along haulage roadway.
Unauthorised travelling on haulage roadways should be strictly prohibited.
Uncontrolled movement of tubs.
Derailment of tubs.
Bad patches in the track should be corrected.
Poor construction of curves.
16
XI. Electrical hazards
Electric shock and/or burn.
Ignition of firedamp or coal dust.
Fire arising from electric defects.
Inspect equipment regularly for signs of overheating, partial discharge and mechanical damage.
Inspect earthing point regularly.
Use of flameproof and intrinsically safe apparatus. Cables should be provided with double wire armouring.
XII. Fire hazard
No petrol power equipment must be permitted.
Hard held extinguishers should be provided in various places in mines.
All underground equipment containing more than 100 litres of flammable hydraulic fluid must be fitted with an automatic suppression system with suitable manual activation.
Storage of flammable substances must be minimised.
XIII. Inundations
No working should be done vertically below any river, lake or other reservoir. If there is a river nearby entrance into a mine shall be constructed and maintained
such that lowest point of its mouth is not less than 1.5m above the highest flood level at that point.
Shaft sites should be located away from faults and other geological disturbances. All abandoned shaft and boreholes not required for any purpose should be filled
up with debris and sealing material.
In case of presence of highly water bearing strata in the vicinity of the proposed working mining should be so planned as not to disturb the water bearing strata.
XIV. Ventilation
Failing of cooling system.
Oxygen deficiency (<19%)
Gas evolution from coal
17
Presence of CO2 > 1%
Presence of H2S > 20ppm
Presence of NOX
Increase in temperature due to rock temperature and heats from machines
XV. Illumination
Insufficient illumination system
Permanent lighting should be provided in places where equipment can be hazardous.
Separate and independent emergency light source should be provided at all places where a hazard could be placed by failure if light.
3.3 ACCIDENT STATISTICS IN INDIAN MINES
18
Table 3.1: Trend in Fatal Accidents and Fatality in Coal mines (1951-2007)
Year Coal Mines
Average
Accidents Accident Rate
Average Killed
Death Rate
1951-60 222 0.61 295 0.82
1961-70 202 0.48 260 0.62
1971-80 187 0.40 264 0.55
1981-90 162 0.30 185 0.34
1991-2000 140 0.27 170 0.33
2001-2007 87 0.22 112 0.28
Source: Annual Report, Ministry of Labour, 2007-08
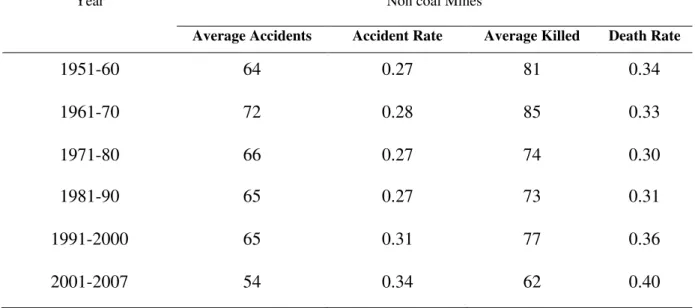
Table 3.2: Trend in Fatal Accidents and Fatality in Non-Coal mine (1951-2007)
Year Non coal Mines
Average Accidents Accident Rate Average Killed Death Rate
1951-60 64 0.27 81 0.34
1961-70 72 0.28 85 0.33
1971-80 66 0.27 74 0.30
1981-90 65 0.27 73 0.31
1991-2000 65 0.31 77 0.36
2001-2007 54 0.34 62 0.40
19
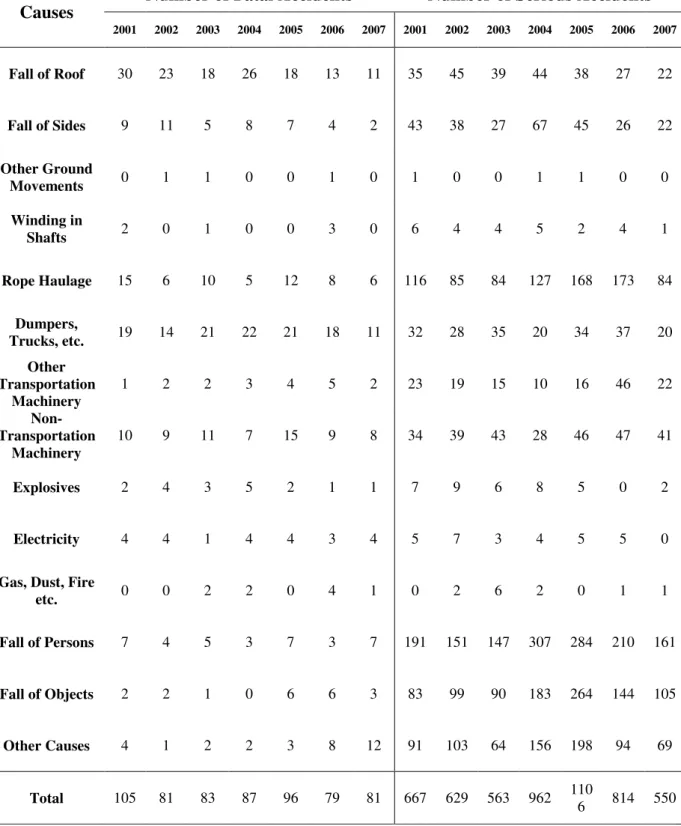
Table 3.3: Trend of Accidents in Coal Mines – Cause wise (2001-07)
Causes
Number of Fatal Accidents Number of Serious Accidents
2001 2002 2003 2004 2005 2006 2007 2001 2002 2003 2004 2005 2006 2007
Fall of Roof 30 23 18 26 18 13 11 35 45 39 44 38 27 22
Fall of Sides 9 11 5 8 7 4 2 43 38 27 67 45 26 22 Other Ground
Movements 0 1 1 0 0 1 0 1 0 0 1 1 0 0
Winding in
Shafts 2 0 1 0 0 3 0 6 4 4 5 2 4 1
Rope Haulage 15 6 10 5 12 8 6 116 85 84 127 168 173 84 Dumpers,
Trucks, etc. 19 14 21 22 21 18 11 32 28 35 20 34 37 20 Other
Transportation Machinery
1 2 2 3 4 5 2 23 19 15 10 16 46 22
Non- Transportation
Machinery
10 9 11 7 15 9 8 34 39 43 28 46 47 41
Explosives 2 4 3 5 2 1 1 7 9 6 8 5 0 2
Electricity 4 4 1 4 4 3 4 5 7 3 4 5 5 0
Gas, Dust, Fire
etc. 0 0 2 2 0 4 1 0 2 6 2 0 1 1
Fall of Persons 7 4 5 3 7 3 7 191 151 147 307 284 210 161
Fall of Objects 2 2 1 0 6 6 3 83 99 90 183 264 144 105
Other Causes 4 1 2 2 3 8 12 91 103 64 156 198 94 69
Total 105 81 83 87 96 79 81 667 629 563 962 110
20
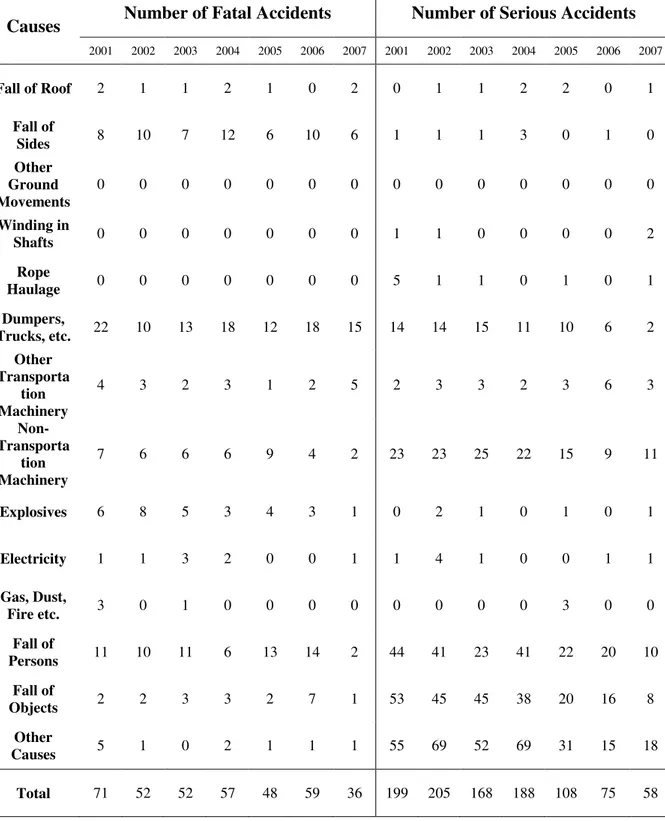
Table 3.4: Trend of Accidents in Non-coal Mines – Cause wise (2001- 07)
Causes Number of Fatal Accidents Number of Serious Accidents
2001 2002 2003 2004 2005 2006 2007 2001 2002 2003 2004 2005 2006 2007
Fall of Roof 2 1 1 2 1 0 2 0 1 1 2 2 0 1
Fall of
Sides 8 10 7 12 6 10 6 1 1 1 3 0 1 0
Other Ground Movements
0 0 0 0 0 0 0 0 0 0 0 0 0 0
Winding in
Shafts 0 0 0 0 0 0 0 1 1 0 0 0 0 2
Rope
Haulage 0 0 0 0 0 0 0 5 1 1 0 1 0 1
Dumpers,
Trucks, etc. 22 10 13 18 12 18 15 14 14 15 11 10 6 2 Other
Transporta tion Machinery
4 3 2 3 1 2 5 2 3 3 2 3 6 3
Non- Transporta
tion Machinery
7 6 6 6 9 4 2 23 23 25 22 15 9 11
Explosives 6 8 5 3 4 3 1 0 2 1 0 1 0 1
Electricity 1 1 3 2 0 0 1 1 4 1 0 0 1 1
Gas, Dust,
Fire etc. 3 0 1 0 0 0 0 0 0 0 0 3 0 0
Fall of
Persons 11 10 11 6 13 14 2 44 41 23 41 22 20 10 Fall of
Objects 2 2 3 3 2 7 1 53 45 45 38 20 16 8
Other
Causes 5 1 0 2 1 1 1 55 69 52 69 31 15 18
21
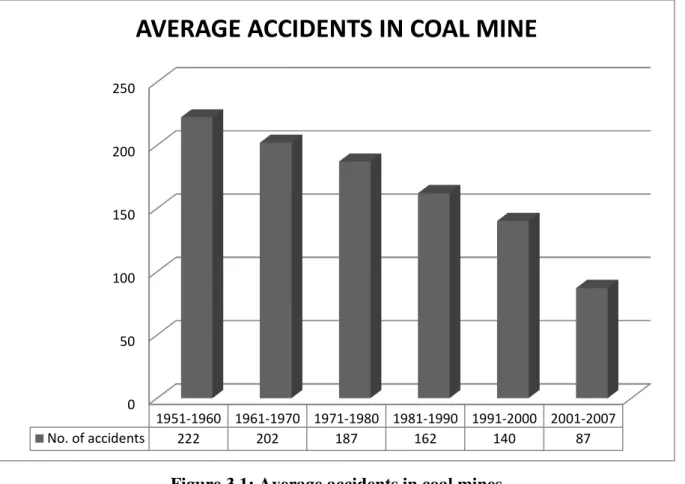
Figure 3.1: Average accidents in coal mines
Figure 3.2: Pi Chart representation for average accidents in coal mines 0
50 100 150 200 250
1951-1960 1961-1970 1971-1980 1981-1990 1991-2000 2001-2007
No. of accidents 222 202 187 162 140 87
AVERAGE ACCIDENTS IN COAL MINE
22%
20%
19% 16%
14%
9%
AVERAGE ACCIDENTS IN COAL MINE
1951-1960
1961-1970
1971-1980
1981-1990
1991-2000
22
Figure 3.3: Average accidents in non-coal mines
Figure 3.4: Pi Chart representation for average accidents in coal mines 0
10 20 30 40 50 60 70 80
1951-1960 1961-1970 1971-1980 1981-1990 1991-2000 2001-2007
1951-1960 1961-1970 1971-1980 1981-1990 1991-2000 2001-2007
No. of accidents 64 72 66 65 65 54
AVERAGE ACCIDENTS IN NON-COAL MINES
16%
19%
17% 17%
17%
14%
AVERAGE ACCIDENT IN NON-COAL MINES
1951-1960
1961-1970
1971-1980
1981-1990
1991-2000
23
Figure 3.5: Average cause wise fatal accidents in coal mines in 2007
Figure 3.6: Pi chart representation of average cause wise fatal accidents in coal mines in 2007
0 2 4 6 8 10 12 14
CAUSE WISE FATAL COAL MINE ACCIDENTS IN
2007
No. of accidents
16%
3% 0%
0%
9%
16%
3% 12%
2% 6% 1%
10% 4%
18%
CAUSE WISE FATAL COAL MINE ACCIDENTS IN
2007
Fall of Roof
Fall of sides
ground movement
Winding in shaft
Rope haulage
Dumper, trucks etc.
Other Transportation machinery
Non transportation machinery
Explosives
Electricity
Gas,Dust,Fires etc.
Fall of Persons
Fall of objects
24
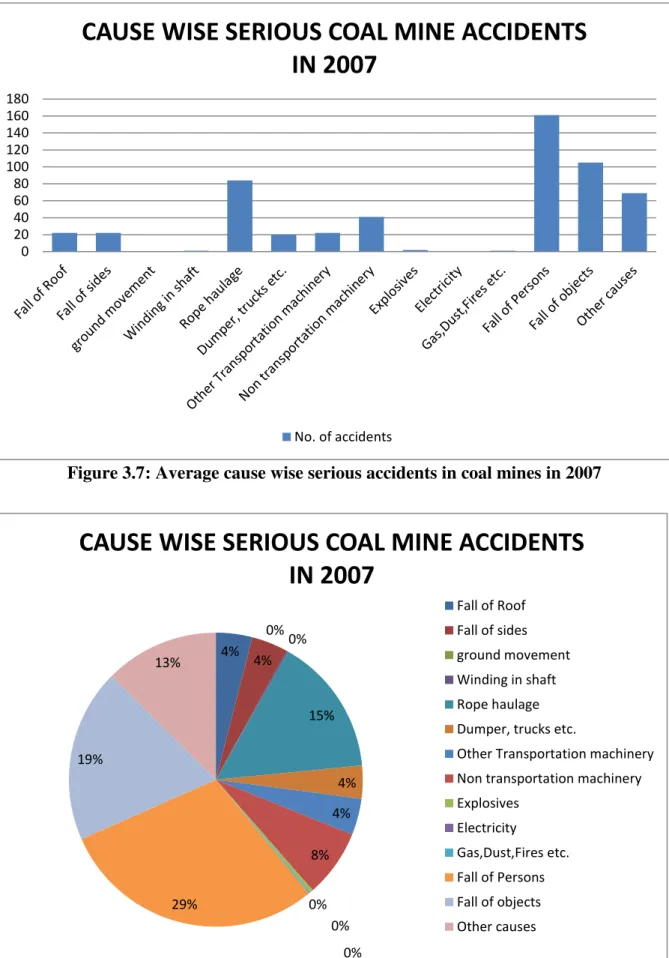
Figure 3.7: Average cause wise serious accidents in coal mines in 2007
Figure 3.8: Pi chart representation of average cause wise serious accidents in coal mines in 2007 0 20 40 60 80 100 120 140 160 180
CAUSE WISE SERIOUS COAL MINE ACCIDENTS
IN 2007
No. of accidents
4% 4% 0% 0% 15% 4% 4% 8% 0% 0% 0% 29% 19% 13%
CAUSE WISE SERIOUS COAL MINE ACCIDENTS
IN 2007
Fall of Roof
Fall of sides
ground movement
Winding in shaft
Rope haulage
Dumper, trucks etc.
Other Transportation machinery
Non transportation machinery
Explosives
Electricity
Gas,Dust,Fires etc.
Fall of Persons
Fall of objects
25
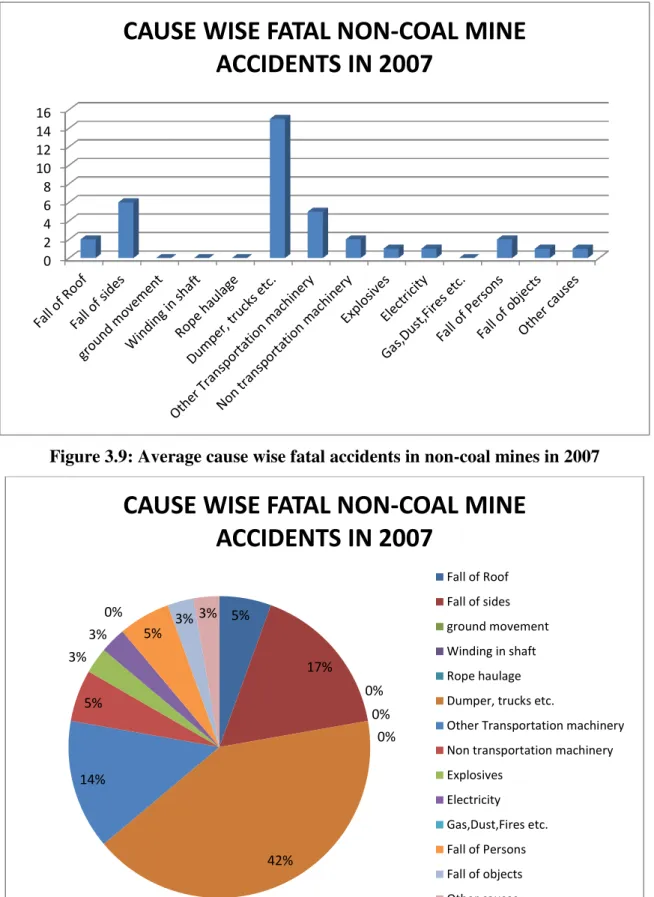
Figure 3.9: Average cause wise fatal accidents in non-coal mines in 2007
Figure 3.10: Pi chart representation of average cause wise fatal accidents in non-coal mines in 2007
0 2 4 6 8 10 12 14 16
CAUSE WISE FATAL NON-COAL MINE
ACCIDENTS IN 2007
5%
17%
0%
0%
0%
42% 14%
5% 3%
3% 0%
5%
3% 3%
CAUSE WISE FATAL NON-COAL MINE
ACCIDENTS IN 2007
Fall of Roof Fall of sides ground movement Winding in shaft Rope haulage Dumper, trucks etc.
Other Transportation machinery Non transportation machinery Explosives
26
Figure 3.11: Average cause wise serious accidents in non-coal mines in 2007
Figure 3.12: Pi chart representation of average cause wise serious accidents in non-coal mines in 2007
0 2 4 6 8 10 12 14 16 18
CAUSE WISE SERIOUS NON-COAL MINE
ACCIDENTS IN 2007
2% 0% 0%
3% 2%
3%
5%
19%
2% 2%
0% 17%
14% 31%
CAUSE WISE SERIOUS NON-COAL MINE
ACCIDENTS IN 2007
Fall of Roof Fall of sides ground movement Winding in shaft Rope haulage Dumper, trucks etc.
Other Transportation machinery Non transportation machinery Explosives
27
It can be seen that the trend of accidents in coal mine is decreasing from 1951-1960 to 2001-2007and the numbers of fatal accidents are almost reduced to less than half from 1951 to 2007 (figure 3.1). The trend of non-coal mine is not as steep as that for coal mine it is increasing in a period of 1961-1970 after that it is gradually decreasing (figure 3.3).
The main factors for fatal accidents of coal mine for the year 2007 (figure 3.6) are roof fall, dumper and truck and others contributing 16%, 16% and 18% respectively. The main factors for fatal accidents of non-coal mine for the year 2007 (figure 3.10) are fall of sides, dumpers and trucks, and non-transportation machinery are 17%, 42% and 14% respectively.
28
CHAPTER 4
29
4.
RISK ASSESSMENT
Risk assessment is the process used to determine likelihood that people may be exposed to an injury, illness or disease in the workplace arising from any situation identified during the hazard identification process prior to consideration or implementation of control measures.
Risk occurs when a person is exposed to a hazardous situation. Risk is the likelihood that exposure to a hazard will lead to an injury or a health issue. It is a measure of the probability and potential severity of harm or loss.
Risk assessment forms crucial early phase in the disaster management planning cycle and is essential in determining what disaster mitigation measures should be taken to reduce future losses. Any attempt to reduce the impact of disaster requires an analysis that indicates what threats exist, their expected severity, who or what they may affect, and why. Knowledge of what makes a person or a community more vulnerable than another added to the resources and capacities available determines the steps we can take to reduce their risk.
Risk assessment is carried out in series of related activities which builds up a picture of the hazards and vulnerabilities which explain disaster events.
4.1. DIFFERENT TERMINOLOGIES ASSOCIATED WITH RISK ASSESSMENT
Following are some of the important terminologies involved in hazard identification and risk analysis:
Harm: Physical injury or damage to the health of peoples either directly or indirectly as a result of damage to property or to the environment.
Hazard: Hazard is a situation that poses a level of threat to life, health, property or environment. Most hazards are dormant with only a theoretical risk of harm however once a hazard becomes active it can create emergency situation.
Hazardous situation: A circumstance in which a person is exposed to a hazard Hazardous event: A hazardous situation which results in harm
30
Risk: Risk concerns the deviation of one or more results of one or more future events from their expected value.
Figure 4.1: The European Community’s Definition of Risk.
Tolerable risk: Risk which is accepted in a given context based on the current values of society
Protective measure: The combination of risk reduction strategies taken to achieve at least the tolerable risk. Protective measures include risk reduction by inherent safety, protective devices, and personal protective equipment, information for use and installation and training. Severity: Severity is used for the degree of something undesirable.
Different Forms of Injury
Serious Bodily Injury means any injury which involves the permanent loss of any part or section of the body or the permanent loss of sight or hearing or any permanent physical incapability or the facture of any bone or one or more joint or bone of any phalanges of hand or foot.
Reportable Injury means any injury other than any serious bodily injury, which involves the enforced absence of injured person from work for a period of 72 hours or more. Minor Injury means any injury which results in enforced absence from work of the person
exceeding 24hrs and less than 72 hours.
Risk Analysis: A systematic use of available information to determine how often specified events may occur and the magnitude of their likely consequences.
RISK
related to the considere
d hazard
SEVERITY of the possible harm that can result from the considere d hazard
PROBABILITY OF OCCURRENCE of the harm.
Is a function of
and
Frequency and duration of exposure.
Probability of occurrence of hazardous event.
31
Risk Assessment: The process used to determine risk management priorities by evaluating and comparing the level of risk against predetermined standards, target risk levels or other criteria.
Risk Treatment: Selection and implementation of appropriate options for dealing with risk.
4.2 TYPES OF HAZARD IDENTIFICATION AND RISK ANALYSIS
There are three types of hazard identification and risk assessments: Baseline Hazard Identification and Risk Analysis;
Issue-based Hazard Identification and Risk Analysis; and Continuous Hazard Identification and Risk Analysis.
They are all inter-related and form an integral part of a management system. A brief description of each of the three types of Hazard Identification and Risk Analysis is given below:
Baseline Hazard Identification and Risk Analysis
The purpose of conducting a baseline HIRA is to establish a risk profile or setoff risk profiles. It is used to prioritise action programmes for issue-based risk assessments.
Issue-based Hazard Identification and Risk Analysis
The purpose of conducting an issue-based HIRA is to conduct a detailed assessment study that will result in the development of action plans for the treatment of significant risk.
Continuous Hazard Identification and Risk Analysis
The purpose of conducting continuous Hazard Identification and Risk Analysis is to:
Identify Operational health and safety hazards with the purpose of immediately treating significant risks
Gather information to feed back to issue-based Hazard Identification and Risk Analysis
32
4.3 THE INTER-RELATIONSHIP BETWEEN TYPES OF HIRA
The relationship between the different types of HIRA is as illustrated in Figure 4.2. The figure illustrates
1. Risk profiles are used for planning the issue-based HIRA action programme.
2. Provides clear guiding principles for compatibility so that the issue-based HIRA and continuous HIRA are more effective enabling continuous improvement.
3. Codes of practice, standard procedures and management instructions etc. and new information from issue-based HIRA can be used to improve on the continuous HIRA and update the baseline HIRA so that it remains comprehensive.
4. The issue-based HIRA and baseline HIRA draw from the data captured by the continuous HIRA process to be effective.
5. The risk management process serves management.
Figure 4.2: The Inter-relationship between Different Types of HIRA.
2
4
1
4
3
Management
Baseline Risk Assessment Continuous
Risk Assessment
Issue–Based Risk Assessment
4
5
4
4
2
3
5
4
5
33
The different steps of risk assessment procedure are as given below (Figure 4.3):
Figure 4.3: Steps in Risk Assessment
Step 1 Hazard Identification
The purpose of hazard identification is to identify and develop a list of hazards for each job in the organization that are reasonably likely to expose people to injury, illness or disease if not effectively controlled. Workers can then be informed of these hazards and controls put in place to protect workers prior to them being exposed to the actual hazard.
Step 2 Risk Assessment
Risk assessment is the process used to determine the likelihood that people exposed to injury, illness or disease in the workplace arising from any situation identified during the hazard identification process prior to consideration or implementation of control measures.
Risk occurs when a person is exposed to a hazard. Risk is the likelihood that exposure to a hazard will lead to injury or health issues. It is a measure of probability and potential severity of harm or loss.
Step 3 Risk Control
Risk control is the process used to identify, develop, implement and continually review all practicable measures for eliminating or reducing the likelihood of an injury, illness or diseases in the workplace.
Step 2: Assess the
Risks
Step 3: Evaluate the
existing controls
Step 4: Implement
additional risk controls Step 5:
Monitor and Review
Step 1: Identify the
34
Step 4: Implementation of risk controls
All hazards that have been assessed should be dealt in order of priority in one or more of the following hierarchy of controls
The most effective methods of control are: 1. Elimination of hazards
2. Substitute something safer 3. Use engineering/design controls
4. Use administrative controls such as safe work procedures
5. Protect the workers i.e. By ensuring competence through supervision and training, etc.
Each measure must have a designated person and date assigned for the implementation of controls. This ensures that all required safety measures will be completed.
Step 5: Monitor and Review
Hazard identification, risk assessment and control are an on-going process. Therefore regularly review the effectiveness of your hazard assessment and control measures. Make sure that you undertake a hazard and risk assessment when there is change to the workplace including when work systems, tools, machinery or equipment changes. Provide additional supervision when the new employees with reduced skill levels or knowledge are introduced to the workplace.
4.4 RISK ANALYSIS
The risk assessment portion of the process involves three levels of site evaluation: 1) Initial Site Evaluation,
2) Detailed Site Evaluation,
3) Priority Site Investigations and Recommendations.
The risk assessment criteria used for all levels of site evaluation take into account two basic factors:
The existing site conditions
The level of the travelling public's exposure to those conditions.
35
Site Evaluation risk assessment is then performed on each of the three highest risk site groups in order of the group priority level of risk. The result of the Detailed Site Evaluation process is a prioritized listing of the sites within each of the three highest risk site groups.
Risk analysis is done for
Forecasting any unwanted situation
Estimating damage potential of such situation Decision making to control such situation Evaluating effectiveness of control measures
4.5 ACCEPTABLE RISK
Risk that is acceptable to regulatory agency and also to the public is called acceptable risk.There are no formally recognized regulatory criteria for risk to personnel in the mining industry. Individual organizations have developed criteria for employee risk and the concepts originally arising from chemical process industries and oil and gas industries.
Because of the uncertainties linked with probabilistic risk analysis used for quantification of the risk levels the general guiding principle is that the risk be reduced to a level considered As Low as Reasonably Practicable (ALARP). The risk acceptability criteria are illustrated in Figure 4.4. It can be seen that there are three tiers:
a. A tolerable region where risk has been shown to be negligible and comparable with everyday risks such as travel to work.
b. A middle level where it is shown the risk has been reduced to As Low As Reasonably Practicable level and that further risk reduction is either impracticable or the cost is grossly disproportionate to the improvement gained. This is referred as the ALARP region.
36
Figure 4.4: The Risk Acceptability Criteria.
4.6 METHODOLOGIES FOR RISK ANALYSIS
The objective of risk analysis is to produce outputs that can be used to evaluate the nature and distribution of risk and to develop appropriate strategies to manage risk. Events or issues
with more significant consequences and likelihood are identified as „higher risk‟ and are
selected for higher priority mitigation actions to lower the likelihood of the event happening and reduce the consequences if the event were to occur.
Qualitative methods use descriptive terms to identify and record consequences and likelihoods of the events and resultant risk. Quantitative methods identify likelihoods as frequencies or probabilities. They identify consequences in terms of relative scale (orders of magnitude) or in terms of specific values (for example estimate of cost, number of fatalities or number of individuals lost from a rare species).
For both qualitative and quantitative methods it is important to invest time in developing appropriate rating scales for likelihood, consequence and resultant risk. The full range of risk situations likely to be encountered within the scope of the exercise should be considered when developing rating scales.
•Intolerable Region Risk unacceptance and must be
reduced. the actions may include equipments and people or procedural measures. if risk cannot be reduced to ALARP level, operating philosophy must be fundamentally reviewed by
the management.
•ALARP Region Efforts must be made to
reduce risk further and to as low as reasonably practicable, without
expenditure that is grossly disproportionate
to the benefit gained.
•Tolerable Region Risk level is so low
as to not require actions to reduce its magnitude
37
4.6.1 Qualitative methods
Qualitative approaches to risk assessment are the most commonly applied. Qualitative risk assessment methods are quick and relatively easy to use as broad consequences and likelihoods can be identified and they can provide a general understanding of comparative risk between risk events, and the risk matrix can be used to separate risk events into risk classes (ratings).
A logical systematic process is usually followed during a qualitative risk assessment to identify the key risk events and to assess the consequences of the events occurring and the likelihood of their occurrence.
Table 4.1: A qualitative method for the classification of risks
Risk Rank Likelihood x Consequence L1 Almost certain L2 Likely L3 Possible L4 Unlikely L5 Rare 1 Catastrophic
1 2 4 7 11
C2 Major
3 5 8 12 16
C3 Moderate
6 9 13 17 20
C4 Minor
10 14 18 21 23
C5 Insignificant
15 19 22 24 25
Table 4.2: Risk Likelihood Table for Guidance
Step 1: Assess the Likelihood Step 2 Assess the Consequences L1
Happens every time we
operate Almost Certain Common or repeating occurrence
C1 Fatality Catastrophic
L2
Happens regularly (often)
Likely
Known to have occurred "has
happened"
C2 Permanent
disability Major
L3 Has happened
(occasionally) Possible
Could occur or "heard of it happening"
C3 Medical/hospital
or lost time Moderate
L4
Happens irregularly (almost never)
Unlikely Not likely to
occur C4
First aid or no
lost time Minor
L5 Improbable
(never) Rare
Practically
impossible C5 No injury Insignificant
RISK RATING High
Risk 1 - 6
Medium
Risk 7 - 15
Low
38
Qualitative approaches are best used as a quick first-pass exercise where there are many complex risk issues and low-risk issues need to be screened out for practical purposes.
Qualitative approaches have some shortcomings compared with more quantitative approaches. Key criticisms are that qualitative methods are imprecise it is difficult to compare events on a common basis as there is rarely clear justification of weightings placed on severity of consequences and the use of emotive labels makes it difficult for risk communicators to openly present risk assessment findings.
4.6.2 Semi quantitative methods
Semi-quantitative approaches to risk assessment are currently widely used to overcome some of the shortcomings associated with qualitative approaches. Semi-quantitative risk assessments provide a more detailed prioritised ranking of risks than the outcomes of qualitative risk assessments. Semi-quantitative risk assessment takes the qualitative approach a step further by attributing values or multipliers to the likelihood and consequence groupings. Semi-quantitative risk assessment methods may involve multiplication of frequency levels with a numerical ranking of consequence. Several combinations of scale are possible.
39
Table 4.3: Example of a Basic Semi-quantitative Risk Rating Matrix
Consequence Level
1 2 3 4 5
Likelihood
level Descriptor Insignificant Minor Moderate Major Catastrophic
5 Almost
Certain 5 10 15 20 25
4 Likely 4 8 12 16 20
3 Possible 3 6 9 12 15
2 Unlikely 2 4 6 8 10
1 Rare 1 2 3 4 5
An advantage of this approach is that it allows risk ratings to be set based on the derived numeric risk values. A major drawback is that the numeric risk values may not reasonably reflect the relative risk of events due to the possible orders of magnitude differences within the likelihoods and consequences classes.
In many cases the approach used to overcome above drawbacks has been to apply likelihood and consequence values that more closely reflect their relative magnitude, but which are not absolute measures. The semi-quantitative risk matrix ofTable4.4 shows the relative risk values that would be derived by replacing the qualitative descriptions of likelihoods and consequences with values that better reflect their relative order of the magnitude and provide more realistic relativity within each class.
RISK RATING EXTREME
HIGH
MODERATE
40
Table 4.4: Example of an Alternative, Basic Semi-quantitative Risk Rating Matrix
Consequence Level
1 2 3 4 5
Likelihood
level Descriptor Insignificant Minor Moderate Major Catastrophic
1 Almost
Certain 1 10 100 1000 10000
0.1 Likely 0.1 1 10 100 1000
0.01 Possible 0.01 0.1 1 10 100
0.001 Unlikely 0.001 0.01 0.1 1 10
0.0001 Rare 0.0001 0.001 0.01 0.1 1
In this example the risk assessment clearly indicates that there is order of magnitude difference between likelihood classes and also between consequence classes. Using this approach, it is possible to derive numbered risk levels by multiplying likelihood and consequence levels for each cell of the matrix. For example a risk event which is possible (likelihood level = 0.01) and would have a major consequence (consequence level = 1000) would show a risk level of 10. If the issues were comparable then this event would pose same risk as another event which was, for example likely (0.1) but with lower, moderate (100), consequences.
The matrix of Table 4.4 also shows that in this particular case the risk ratings have been weighted to place more emphasis on higher consequence events. This is frequently done to
reflect an organisation‟s lower tolerance of higher consequence events. This step can be
difficult to justify and can be misleading in overemphasising some risk events.
RISK RATING EXTREME
HIGH MODERATE
41
Semi-quantitative risk assessments methods are quick and relatively easy to use clearly identify consequences and likelihoods. They usually provide a general understanding of comparative risk between risk events and are useful for comprehensive risk assessments.
4.6.3. Quantitative methods
Quantitative risk assessment is increasingly applied in the mining and minerals industry due to business requirements to support financial decisions, evenly compare financial risks with environmental and social risks, and to demonstrate transparency, consistency and logic of approach. However quantitative risk approaches often are not intuitive and require some up-front learning investment by decision makers.
Quantitative risk assessment is used across the full range of risk applications from deriving preliminary first-pass separation of risk events to much more comprehensive assessments. The comprehensive assessments can derive detailed risk profiles for priority ranking, estimates of the costs that may be incurred due to risk events, input to financial models and a basis for cost-benefit analysis.
Quantitative risk assessment follows basic risk assessment approach to its full extent by attributing absolute values to likelihood and consequences. Estimates of likelihood are made in terms of event frequency or probability of occurrence of the risk event.
Estimates of consequence can be made using any consistent measure selected according to the nature of the application. The risk quotient is used to differentiate on a comparative basis between the risks events using a consistent measure of risk and to identify those events that pose the most risk. Where consequences are expressed in financial terms, the risk quotient is
equivalent to the commonly used term „expected cost‟ or „expected value‟.
a. Risk maps
A risk map is the quantitative equivalent to risk matrices that are typical outputs from qualitative risk assessments. Like a risk matrix the risk map shows the relationship between likelihood (vertical axis) and consequence level (horizontal axis) for each event and also shows how the events can be rated from low to extreme risk if desired.
The risk map construction recognises that the scales of both likelihood and consequence of risk events are perceived to differ by orders of magnitude. Consequently the diagonal lines
42
that the risk quotient (calculated as likelihood x consequence) is equal to 10 at all intersection points along the line. For example, points (100, 0.1), (1000, 0.01), (10 000, 0.001) all show equal risk. In addition, any events with risk quotients greater than 10 would plot above the selected lower limit and would be considered to pose extreme risk.
Figure 4.5: An Example of Risk Map b. Risk profiles
Risk profiles are more commonly used to express the basic outputs of quantitative risk analysis. Figure shows an example of risk profile generated from the same data as the risk map above.
The risk quotient for each potential event is shown on the vertical axis and is calculated from the product of the likelihood of occurrence and the cost if the event occurred. The selected lower limits of each risk rating are also indicated on the profile.
Additional profiles can be generated to assist development of appropriate risk treatment strategies. Exposure profiles that show estimated cost of risk issues clearly indicate both the risk of each event and the potential financial exposure if the event were to occur. Identification of a high-risk, high-cost event, for example, would indicate that priority action should be carried out to address the risk.
0.1 10 100 1000 10000 100000
Extreme risk Events
High Risk Events
Moderate Risk Events
Low risk Events
Selected lower limit of extremerisk
43
Figure 4.6: An Example of Risk Profile
Figure 4.7: Example of Exposure Profile
Extreme risk Events
High Risk Events
Moderate Risk Events
Low risk Events 0.00001 1 0.1 0.01 0.001 0.0001 100 10 R isk Selected lower limit of extreme risk
Selected lower limit of high risk
Selected lower limit of moderate risk Dr o u g h t In d u str ial d is p u te Pro ce ss w ate r r e le as e Co mmu n ity o p p o si ti o n T ai li n g s d u st in g A R D Lo cal p o li ti cal i n stab il ity R e h ab il itati o n fa il u re Pi t w al l fa il u re T ai li n g s to rag e fa il u re 0 15 10 5 20 30 25
35 100
1 0.1 0.01 0.001 0.0001 0.00001 10 Ri sk Est im a te d co st if ri sk e v ent we re t o o ccur Dr o u g h t In d u str ial d is p u te Pro ce ss w ate r Co mmu n ity T ai li n g s d u st in g A R D Lo cal p o li ti cal R e h ab il itati o n Pi t w al l fa il u re T ai li n g s to rag e Very conservative cost of occurrence
Conservative but realistic cost of occurrence
44
Additional outputs of quantitative risk assessment that are used to develop and support risk management strategies show profiles of event likelihoods and cost-benefit relationships (progressive costs to implement a risk management strategy versus reduction in risk or reduction in the estimated future cost of risk events).
Fully quantitative risk assessment is not very useful for environmental impact study type risk assessments, where there are many diverse environmental and social issues that need to be evaluated and their risk communicated to the community and other stakeholders.
4.7RISK ASSESSMENT PROCEDURES
4.7.1 Hazard and Operability Analysis (HAZOP)
A HAZOP is an organized examination of all possibilities to identify and processes that can malfunction or be improperly operated.
HAZOP analyses are planned to identify potential process hazards resulting from system interactions or exceptional operating conditions.
Features of HAZOP study are:
It gives an idea of priorities basis for thorough risk analysis,
It provides main information on the potential hazards, their causes and consequences, It indicates some ways to mitigate the hazards,
It can be executed at the design stage as well as the operational stage,
It provides a foundation for subsequent steps in the total risk management program. Advantages:
a. Offers a creative approach for identifying hazards, predominantly those involving reactive chemicals.
b. Thoroughly evaluates potential consequences of process failure to follow procedures. c. Recognises engineering and administrative controls, and consequences of their
failures.
d. Provides a decent understanding of the system to team members. Disadvantages
a. Requires a distinct system of engineering documentation and procedures. b. HAZOP is time consuming.
45
d. HAZOP emphases on one event causes of deviations or failures.
Figure 4.8: HAZOP (Hazard and operability analysis) Concept.
4.7.2 Failure Mode and Effect Analysis (FMEA)
An FMEA is a systematic method for examining the impacts of component failures on system performance. Basically FMEA focuses on failures of systems and individual components and examines how those failures can impact facility and processes.
FMEA is most effective when a system is well defined and includes the followings key steps: a. Listing of all system components;
b. Identification of failure modes (and mechanisms) of these components; c. Description of the effects of each component failure mode;
d. Identification of controls (i.e., safeguards, preventive) to protect against the causes and/or consequence of each component failure mode;
e. If the risks are high or the single failure criterion is not met.
List possible causes of deviation
Select a process or operating step
Repeat for all guide words Apply guide word to process variable
or task to develop meaningful deviation
Repeat for all process variables or tasks
Repeat for all process sections or operating steps
Select a process variable or task
Examine consequences associated with deviation
Explain design intention of the process section or operating step
Develop action items
Identify existing safeguards to prevent deviation
46
Information required for an FMEA includes: 1. System structure;
2. System intimation, operation, control and maintenance; 3. System environment;
4. System modelling; 5. System software; 6. System boundary;
7. System functional structure;
8. System functional structure representation; 9. Block diagrams; and
10. Failure significance and compensating provisions.
FMEA is a qualitative inductive method and is easy to apply. FMEA is supported by the preparation of a list of the expected failure modes in the light of
a. The use of the system, b. The elements involved, c. The mode of operation, d. The operation specification, e. The time constraints and f. The environment.
FMEA is an efficient method for analysing elements which can cause failure of the whole, or of a large part, of a system.
Advantages a. Simple b. Efficient c. Cost effective
d. Has quantitative applications
Disadvantages
a. Limited capability to address operational interface and multiple failures b. Human error examination is limited