Airport’s Catchment Area Size Definition: a
Portuguese Case Study
Maria E. Baltazar1, a, b ; Jorge Silva a, b
a Universidade da Beira Interior, Aerospace Science Department (DCA-UBI), Rua Marquês d’Ávila e Bolama, 6201- 001, Covilhã, Portugal.
b CERIS, Instituto Superior Técnico, Universidade de Lisboa, Av. Rovisco Pais 1, 1049-001, Lisboa, Portugal
1 Presenter
Abstract
The definition of the Catchment Area of an airport is very broad and current literature
suggests doing it in combination with certain pre-defined criteria: the assessment of the
impact or effectiveness of a certain airport, or from the perspective of competition
between airports. This paper aims to assess the validity of the hinterland defined by the
Portuguese airport manager, ANA - Aeroportos de Portugal. A case study was
developed involving the three main national airports: Lisbon (LIS), Oporto (OPO) and
Faro (FAO). ANA defined the hinterland of each airport. Thus, a survey was developed
to the companies located within the hinterland of every airport aiming to understand the
existence of any relationship between them and the closest airport. We followed a
stratified sample method to determine the size of the survey. We only considered import
and export companies with the highest business volumes. Data analysis was performed
using GIS (Geographic Information System), that is a software, spatial data and
computational procedures system that enables and facilitates the analysis, management
and representation of space and phenomena that occur in it. We collected a total of 243
surveys. The main conclusion of the study was that the calculation of an airport’s
hinterland based exclusively on the travel time or distance is, potentially, misleading. It
is proposed the use of other factors. The validity of such a method and practice raises
some doubts. The actual distribution of economic activities and population is ignored as
well as the mutual influence of several airports. Further research is now needed to
calculate airports actual influence.
Keywords: Airport, Hinterland, Regional Development, GIS, SPSS.
1 Corresponding author.
E-mail address:
[email protected](Maria Emília Baltazar)
1 Introduction
Nowadays airports have become a necessary infrastructure for a wide range of economic activities, allowing the transportation of people and goods in a global scale. Airports are essential to the global modern economy, providing high speed access for freight, business and leisure travelers, but also they contribute to social development and for a better life quality (Dejan Paliska, et al., 2016). The role that airports play in assuring accessibility allows the businesses to develop enhancing that way the potential growth of a region (Város-Teampannon Ltd, 2014; ACI, 2004).
The rules of business competition and industrial location are being changed by an increasingly fast-paced globally economy were words like digitalization, globalization, aviation and time-based competition are converging to a new era. As the seaports did in the 18th century, railroads in the 19th, highways in the 20th, commercial airports are driving and shaping the business location and industrial development in the 21st century, creating a new economic geography (Abraham Leung, Barbara T.H. Yen, Gui Lohmann, 2017). A new urban form is emerging based on corridors, clusters and spines of aviation-linked business extended outward up to 20 miles from larger airports, the Aerotropolis. Some of these airports have assumed the same role that Central Business Districts (CBD’s) play in the traditional metropolis, by becoming a regional intermodal surface transportation node and contributing with significant employment, shopping and entertainment destinations; this new urban form is called Airport City (Kasarda and Appold, 2008). Nowadays cities with population of 1 million or more have an active role in global economy. They are geographically more dispersed today than 20 years ago but are experiencing a fast economic growth. Global businesses are beginning to plan their strategy from a city perspective, rather than a country (Perry and Raghunath, 2013).
The relationship between airports and local economies changed in the past two decades due to the increase of efficiency of air travel (Paolo Beria, Antonio Laurino, Maria Nadia Postorino, 2017). Airport operators, planners and regulatory agencies frequently used to measure the economic contribution and importance of an airport to the local and regional community (ACRP, 2008). In recent years the trends of airport commercialization and privatization lead to interest in performance comparisons and benchmarking (Maria Emília Baltazar, Tiago Rosa, Jorge Silva, 2018; Ferreira et al, 2010). As airports have become even more commercially oriented there was a need to identify the strongest performers in the industry and to adopt those that can be the best practices (James Wiltshire, 2013; Bilotkach, V. and Mueller, J., 2012; Graham, 2008).
The main object of this paper is to determine and evaluate the catchment area of an airport using a conventional GIS (Geographic Information Systems) approach. Therefore this work has four different objectives:
- To determine an airport catchment area using a conventional GIS approach considering the travel time on the transportation network from any given point to the that airport;
- to evaluate the content of the catchment area based on data available from national census and using several indicators (Population Density, Education Level, Household Income, Economically Active Population, Employment Level, Business Density, Sectorial Structure of Employment, Business Volume, Health, Tourist Attractions, Hotel Establishments, Accommodation Capacity and Occupation Rate);
- to compare the results of the indicators in two temporal scenarios coincident with census of 2001 and 2011, and therefore to analyze the evolution between 2001-2011; and
- to inquiry the major business stakeholders in the regions to understand the perception, the importance, the relationship established (or not) between them and the closest airport.
This work is divided in four sections.
The first section is an Introduction with a brief explanation about the motivation and the object and objectives. The second section is a State of Art Review about hinterland (or catchment area), social and economic indicators, and social and economic impacts of airports; the section ends with an overview about the portuguese case. The third section is the Case Study methodology and results analysis containing the determination of Lisbon airport catchment area, the socio economic evaluation of such area
between 2001 and 2011, and the survey to the main business stakeholders (companies) in a far from the airport strip area. The fourth section presents the Conclusion divided between concluding remarks and perspectives for future research.
2 Catchment Area
2.1 Hinterland or Catchment Area
The definition of the Hinterland or Catchment Area of an airport is very broad and current literature prefers to do it in combination with certain pre-defined criteria: the assessment of the impact or effectiveness of a certain airport, or from a perspective of competition between airports. Each of these definitions is based on different analyzes of the airport infrastructure depending on whether it is of passengers or cargo (Alves P. et al, 2013).
The definition of Hinterland and Catchment Area presented in literature are slightly different and current authors use booth words to describe the same idea. The term Hinterland, also called Umland, was first used in the 19th century by George G. Chisholm to describe backcountry of a port or coastal settlement. In the early 20th century, Andre Allix adopted the expression Umland to describe the economic context of an inland town, while accepts the term Hinterland as a reference to ports. In mid-20th century the term Urban Hinterland has become a reference to cities or metropolitan areas close to central cities. Currently Hinterland in a general way means the rural area linked to the urban catchment of large cities or agglomerations. The size of Hinterland depends on its geography and on the availability, speed and cost transportation between the port and the hinterland, (Encyclopaedia Britannica, 2014; Wikipedia, 2014a; Oxford Dictionaries, 2014).
The definition of Catchment Area in terms of human geography is the area and population from which a city or service can attract visitors or costumers, (Wikipedia, 2014b). Nowadays the difference between Umland, Hinterland and Catchment Area are becoming less distinct.
2.2 Airport Catchment Area
An airport Catchment Area is related to the geographical reach of the airport services to the surrounding population and economy they serve. The catchment area concept is a geographical zone containing the potential users and passengers for the airport infrastructures (Transport Canada, 2008). In other words is the area to which most inbound passengers are travelling, or from which most outbound passengers are originated (Strobach, D., 2006; Graham A., 2008; CAA, 2011).
Bird (1971), cited by Graham (2008), sustains that there are a lot of concepts to define catchment area and they include several typologies:
• Immediate catchment area: refers the airport area itself;
• Primary catchment area: is the area where the airport and the city assume a commanding role on the life in that area;
• Commodity catchment area: is the area based in the shipment of particular types of commodities; • Inferred catchment area: is the airport hegemony over a particular area that satisfies the demand
for the area it serves.
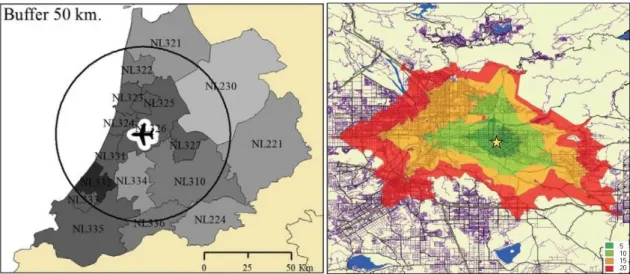
Traditionally Catchment Areas are simple to represent in a spatial form, (Graham A., 2008; Marcucci and Gatta, 2011; Fröhlich and Niemeier, 2011; Lieshout R., 2012; Suau-Sanchez P., 2013):
• One way is by drawing concentric circles of travel distance around airport (Figure 1, left image); • Other is based on an arbitrary assumption of a maximum travel time from any given point to the
Figure 1: Traditional Catchment Areas: Fixed radius (left); Travel time (right), (Graham A., 2008)
For the fixed radius travel distance, Kasarda defines the Aerotropolis as 25Km from airport (Kasarda J., 2000). These same approach with a different, and broad, interpretation defines the Aerotropolis as 50Km from airport (Arend et al., 2004) or as a city-port size for Europe (Van Wijk, M., 2007). Maertens considers that relevant catchments are located within 100Km from airport (Maertens S., 2011). In 2012 the European Commission considers 100Km of distance radius or 1h driving time as an airport’s typical catchment area (Copenhagen Economics, 2012).
For travel time, the approximated catchment area of any given airport is everything that is installed within a 2h drive time by car (Marcucci and Gatta, 2011).
A primary catchment area can be defined as a typically 1 or 2 hour travel time while isochrones of longer timer may be consider to represent a secondary or tertiary catchment areas (Graham, A., 2008).
Although the previous approaches are relative simple to interpret and apply, they have some important drawbacks (Lieshout R., 2012):
1. The result is a static image of an airport catchment area. Changes in the factors that drive the passengers to choose an airport does not affect the size of the catchment area;
2. The market shares in the catchment area remain unclear. This ignores the fact that the market shares tend to decrease when moving further away from the airport;
3. The catchment area is assumed the same for every destination. This seems unrealistic because an airport that offers a higher level of destinations may attract passengers from regions over 2h away.
Catchment area analysis can provide useful information regarding an airport’s passenger base, the potential and strengths but is very important to note the differences between catchment area and geographic market (market share). Catchment area analysis is a way to estimate the geographic area from witch an airport can attract passengers, while geographic market analyses the area over which passengers would substitute to other airport in light of a small increase, of 5% to 10%, in the price level of original airport. To determine the market share is recurrent the use of utility functions such as: air fares, access time, access costs, airside time costs and flight frequency (CAA, 2011; Lieshout R., 2012).
2.3 Social and Economic Indicators
Table 1 shows the most common socioeconomic indicators reported in current literature. While some indicators are simply to measure others may be quite difficult to obtain, due to the lack of available data or because they are complex indicators.
Table 1: Major socioeconomic Indicators (Source: Authors)
Authors (year) Main indicators reported
ACI (2004) Employment; Income
TRB (2008) Employment; Wages; Regional Spending; Tourism;
Air traffic levels; Emergency service
Colorado (2008) Jobs; Payroll; Output
O’ Donoghue (2009) Employment; Gross Value; Spending; Tourism;
Government revenues
British Chambers of Commerce (2009) Jobs; Output; Tourism; Employment
Washington State Department of
Transportation (2012) Jobs; Wages; Output; Spending; Taxes Oregon Department of Aviation (2008) Jobs; Wages; Business sales; Expenditures
NERLEI (2002)
Population density; Unemployment rate; Business volume; Occupation rate; Tourism; Real estate activities; Housing; Accommodation capacity
NERA (2008)
Population density; Employed population; Active population; Average monthly income; Housing; Business Volume; Hotel Establishments; Accommodation capacity; Occupation rate; Number of companies; Health; Social protection; Education level; Environment protection
Silva S. (2009)
Population; Population growth; Active population; Education level; Gross Domestic Product; Unemployment rate; Health
Hakfoort et al. (2001)
Employment; Population; Tourist attractions; Airport taxes, Airport accessibility; Flight frequency; Operation costs; Education level
2.4 Social and Economic Impacts of Airports
Airport operators, managers and other agencies usually conduct economic impact studies for several reasons; one of them is to add vitality to regional interest by pursuing business lines and other projects. This impact studies are used by several policy makers as evidence of cost-benefit analysis or as backup environmental documents. ACRP (2008) presents the three most common methods to analyze aviation impacts:
• Input-output method – it measures: o Direct impacts;
o Indirect impacts; o Induced impacts.
• Collection of benefits method – it describes the beneficial economic activities associated to airports;
• Catalytic method – it analyzes the spillover effects on the supply side of the economy. Measuring the employment and income generated in the economy by wider role of airport businesses and in the attraction of economic activities such as tourism.
For ACI (2004) and ACRP (2008) the most used method is the input-output one, that measures the direct, indirect and induced impacts or as referred sometimes, the first, second and third round of impacts. Usually the third round of impacts (induced impacts) is the largest one, because it represents the sum of the previous ones (direct and indirect impacts). They are defined as:
• Direct impacts: they represent the employment, income and spending related to the operation of the airport;
• Indirect impacts: they represent the employment, income and spending generated in the economy by the chain of suppliers of goods and services;
• Induced impacts: they represent the employment, income and spending generated in the economy by the direct and indirect activities of local businesses and employees.
The variables used to measure the flow of money within the previous methods (ACRP, 2008) include: • Employment - jobs in the aviation industry and aviation related;
• Payroll – wages paid to the workers employed in aviation industry or aviation related;
• Output – value generated by services and goods sold, spending by visitors, operational budgets for aviation industry;
• Multiplier effect – re-spent of money attributed by direct and indirect impacts;
• Qualitative – economic impacts related to safety, agriculture and medical uses, protection of open space, fire and pest control, recreation, military, search and rescue, and rescue.
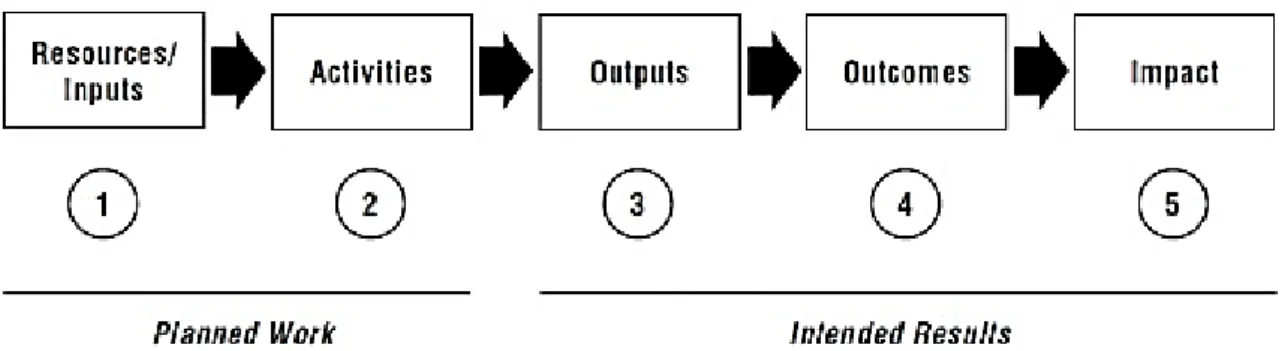
Figure 2: Impacts origin (Sept et al., 2011)
Figure 2 represents a basic logic model of how a program’s day-to-day actions and resources are believed to create a social impact (Sept et al., 2011).
Impacts are the result of a sum of necessary resources (inputs) and actions (activities). The impacts can be positive or negative, intended or unintended, temporary or sustainable over time.
2.5 The Portuguese Case
Aeroportos de Portugal (ANA) was up to 2014 the national authority of the airports in the country. The objective of the company was to provide public airport services in support of civil aviation. The company mission was to efficiently manage the airport infrastructures and to contribute toward the economic, social and cultural development of the surrounding communities. ANA was responsible for the management of airports in mainland Portugal (Lisbon, Porto, Faro and Beja civilian terminal), in Azores (Ponta Delgada, Horta, Flores and Santa Maria) and Madeira (Madeira and Porto Santo) autonomous regions, (ANA, 2014a).
ANA defined the Catchment Area of the airports, by travel time distance; for the mainland Portuguese airports of Lisbon, Oporto, Faro and Beja we may consider:
➢ Lisbon airport: as the main gateway to Portugal and a hub to America and Africa continents, serving over 15.3 million passengers (in 2012) and with a Catchment Area of around 5 million people within a 2 hour driving distance, as far as Badajoz in Spain, (ANA, 2014b).
➢ Oporto airport: has the Portugal’s largest mainland Catchment Area and in 90 minutes driving distance it is possible to reach 4 million inhabitants, (ANA, 2014c).
➢ Faro airport: is the number one gateway for accessing to Algarve and Huelva (Spain) regions. Easily accessible, Faro airport has a Catchment Area that reaches over than half million people within 60 minutes driving distance, (ANA, 2014d).
The airports included in our original work are those of Oporto, Lisbon and Faro. However for the paper purposes only the case of the Lisbon airport is presented.
3 Case Study: Methodology and Results
3.1 Catchment Areas Determination
To determine the airport Catchment Area is considered the travel time from any given point to the airport, using a conventional GIS approach.
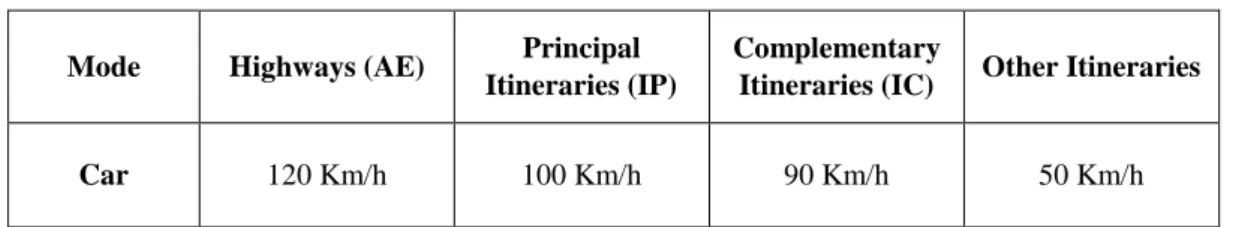
The first step to determine the Catchment Area is to take into consideration the speed limits in Portuguese routes as defined by the national authority (Table 2) and build the transportation network with GIS.
Table 2: Speed Limits (ANSR, 2014)
Mode Highways (AE) Principal Itineraries (IP)
Complementary
Itineraries (IC) Other Itineraries
Car 120 Km/h 100 Km/h 90 Km/h 50 Km/h
To build the transportation network it was considered an ideal (perfect) scenario with the following assumptions:
• The speed considered is the maximum speed allowed; • The travel speed is considered constant;
• It doesn’t take into account the acceleration time needed to get the reference speed; • The resulting Catchment Area does not evolves over time (static image);
• The Catchment Area obtained is the same for every destination from the airport;
• It doesn’t take into account speed limitations in specific situations as tunnels, residential roads and roads inside towns.
The travel time considered to determine the Catchment Area of each mainland airports, as defined by ANA and stated previously, is the following:
➢ Lisbon airport (LIS): 120 minutes; ➢ Oporto airport (OPO): 90 minutes; ➢ Faro airport (FAO): 60 minutes.
Figure 2: Major Airport Catchment Areas and Competition Zones (Source: Authors)
Figure 2 shows the catchment areas of Oporto, Lisbon and Faro airports and the overlaps between them. The overlap areas are the so called competition zones. The northern competition zone shows the competition between Oporto and Lisbon airports, and the southern competition zone shows the competition between Lisbon and Faro airports. The northern competition zone seems to be more pronounced than the southern one: quite all of Baixo Mondego region (more populated and with a considerable number of enterprises, jobs, etc.) vs a small portion of Baixo Alentejo region (less populated and with a few number enterprises, jobs, etc.).
3.2 Catchment Areas Evaluation
As stated previously to evaluate each Catchment Area it was considered the socio-economic characterization of the related regions, and using a set of socio-economic indicators commonly referred in literature upon availability in the Instituto Nacional de Estatística (INE), (Table 3).
Table 3: Socio-economic indicators (Source: Authors)
Indicator Description
Population Density
Population density is expressed by the ratio between the population and the surface area, usually applied to human beings, but also in other living beings (commonly, animals). It is usually expressed in inhabitants per square kilometer
Education Level It is a ratio between the inhabitants with higher education level by the total
number of inhabitants
Household Income Average income per capita by month (in euros)
Economically Active Population
It is the fraction of a population that is either employed or actively seeking employment. Is measured by the ratio between the economically active populations by the number of inhabitants
Employment Level
The employment rate is one of the economic indicators that economists examine to help understand the state of the economy. Is measured by the ratio between the numbers of employees by economically active population
Companies Density It is the number of companies by square kilometer
Sectorial Structure of Employment
Is the number of employed people by the total of companies from the sectors (industrial, real estate, and housing)
Business Volume Is measured as a GDP (Gross Domestic Product) density
Health It is the number of doctors by square kilometer
Tourist Attractions Tourist attractions are measured by the number of attractions by square
kilometer. Includes museums, golf camps, zoos, botanic gardens...
Hotel Establishments Hotel establishments is the number of hotels; apart hotel; guesthouses;
motels; hostels; tourist villages, by square kilometer
Accommodation
Capacity Is measured as the number of beds available in hotel establishments
Occupation Rate Is measured as the ratio between the numbers of beds occupied, in hotel
establishments, by the number of beds offered
3.2.1 Temporal Scenarios
Using the set of indicators of Table 3 and related data from INE Census of 2001 and 2001two temporal scenarios were constructed. Then we constructed a third scenario based on the indicators evolution between 2001 and 2011.
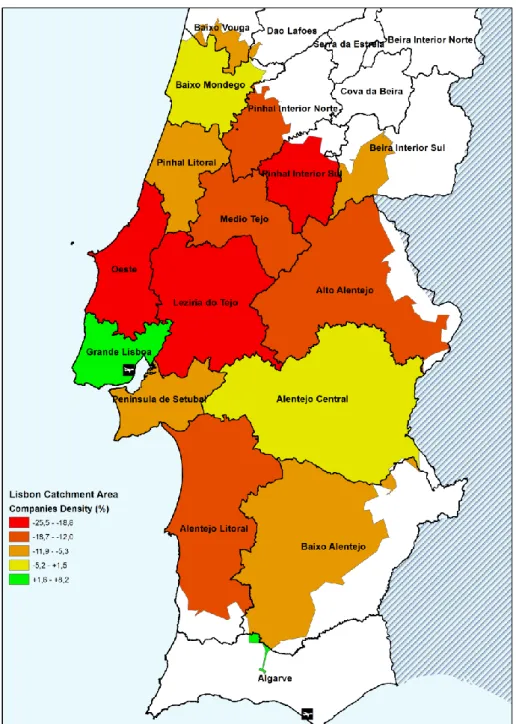
Although the indicators included in our original work are those of Table 3, for this paper purposes only the 2001-2011 evolution scenario for Companies Density is illustrated below (Figure 3).
Figure 3: Companies Density, Lisbon Airport Catchment Area, 2001-2011(Source: Authors)
Figure 3 shows that only Grande Lisboa has an increase of companies. The remaining regions have a decrease that reaches 25% in some cases.
Similarly, with the other indicators it was possible to conclude:
• Population Density - the coastal region has a small increase while inland regions have a big decrease;
• Education Level - a global increase of education level with values over 130% for the regions of Pinhal Interior Norte and Pinhal Interior Sul. Grande Lisboa has the lowest increase;
• Household income - an increase of income since 2001, wherein Baixo Alentejo have the highest increase;
• Economically Active Population - since 2001 the regions of Grande Lisboa and Península de Setúbal have a significant reduce of active population while inland regions have a small increase;
• Employment Level - a major decrease in the employment level in Baixo Vouga, Alto Alentejo, Pinhal Interior Norte and Pinhal Interior Sul. However Alentejo Litoral have a slight increase; • Sectorial Structure of Employment - a global growth with Alentejo Litoral as the highest result; • Business Volume – an increase of Business Volume, being the regions of Baixo Alentejo, Pinhal
Interior Norte and Pinhal Interior Sul the leaders exceeding 50%;
• Health - a global growth of this indicator, being the region of Alto Alentejo the leader with an increase over 90%;
• Tourist Attractions - Alentejo Litoral have the highest growth, almost 400%. Despite the growth of some regions, others have a slightly decrease;
• Hotel Establishments – an increase in most of the regions, with Baixo Alentejo and Dão Lafões leading that increase. Baixo Mondego and Beira Interior Sul have the highest decrease reaching 15%;
• Accommodation Capacity - a global growth with Pinhal Interior Sul achieving the best result. The remaining regions have a small increase;
• Occupation Rate – Médio Tejo and Pinhal Litoral have the highest growth while Península de Setúbal and Alto Alentejo have the highest decrease.
3.3 Companies Survey
The survey research encompasses any measurement procedures involving asking questions to the respondents. A survey can be as simple as a short paper and pencil feedback to an extensive individual interview, (Trochim W., 2014)
Nowadays, with computer network access almost worldwide, alternative means of data collection for researchers are being available. Recent studies have explored several computer-based techniques: Point-of-contact; e-mail based; and web-based (Jansen et al., 2007):
• Point-of-contact type of survey involves having the respondent fill out an e-survey on a computer provided by the researcher. This is a method for researchers that have tight control over the context of the study, and it can be done either on-site or in a laboratory;
• E-mail based survey is usually defined as survey instrument that are delivered through electronic mail applications over the internet;
• Web based surveys are generally defined as survey instruments that physically reside on a network server, and can be accessed only through a Web browser.
3.3.1 Sample Selection
Any research presupposes data collection. What a researcher intend to do, or can do, in most of situations, is to analyze the sample data, draw conclusions, and extrapolate the conclusion to the universe. It is therefore vital that the sample is representative of that universe, (Hill M. and Hill A., 2009). As the universe of companies in Portugal is too big to inquiry, it was followed the stratified sampling method.
The stratified sampling method is especially useful to researchers when there is a large universe, and it’s necessary to get a representative sample according to several predefined variables. After define the various layers of the stratified sample it is important to define the fraction of the sample (commonly 10%), that represents the proportion of cases of the universe used in the sample, (Hill M. and Hill A., 2009).
As the universe of companies in Portugal is over than 600.000 in 2011 (Racius, 2014) several strata were defined to reduce the sample size:
1 It was considered only companies from industrial, real estate, and housing sectors;
2 It was considered only the companies belonging to the Catchment Area previously determined; 3 It was considered only the far from companies of each Catchment Area located in the last 30
minutes travel time by car; that is, in the particular case of Lisbon, a strip of the Catchment Area far from the airport between 90 and 120 minutes of travel time;
4 It was considered only the companies with higher business volumes in that strip of the Catchment Area.
The fourth point, companies’ database, was built in cooperation with the “Informa D&B” that helped to determine the 2,000 biggest and best import and export companies in the specific strip of the Catchment Area, and provided the necessary contacts. The selection of the companies was made based on the business volume of each one, (Informa D&B, 2014).
Due to the lack of information about some companies, in this particular the lack of email address, the sample size had to be reduced to 1,132 companies. In order to get a representative sample it was needed a minimum of 219 responses for a confidence level of 90% with 5% error.
3.3.2 Results
This session describes the main conclusions of the survey conducted to understand the relationship between the companies and the Lisbon airport:
• Currently only 35% of the companies use the airport while 65% have never used an airport; • About 45% of the companies do not foresee the use of airport in future while 34% claims that
having an international partner would lead them to use the airport for commercial activities; • 83% of the companies, which use the airport in their commercial activities, do it for passenger
transportation while 17% use airport for cargo transportation purposes; • Lisbon Airport is the preferred for both passengers and cargo transportation;
• Factors that lead companies to use Lisbon airport for passenger transportation purposes are availability of destinations and geographical proximity;
• The main factor that lead companies to use Lisbon airport for cargo transportation is the geographical proximity;
• Although some of the companies use the Lisbon airport occasionally for passenger transportation, others use it in every three months;
• The companies use Lisbon airport for cargo transportation monthly as well as every three months;
• Some companies preferred alternatively Amsterdam airport instead of Lisbon Airport for cargo transportation based on customs efficiency, connecting time and service costs;
• The companies which preferred alternatively Amsterdam airport instead of Lisbon Airport for cargo transportation used that infrastructure monthly;
• 91% of the companies didn’t feel any influence in the development of the own business by the location of the airport;
• However, the most relevant factors that may influence companies’ location are: region economic profile, customer proximity, accessibility to transportation network, and residence area of workers;
• Companies agreed that the main benefits of the presence in the vicinity of an airport would be: more business trips and market area growth.
5 Conclusions
The main object of this work is to determine and evaluate the catchment area of an airport using a conventional GIS (Geographic Information Systems) approach.
Therefore this work has four specific objectives: (1) to determine an airport catchment area using a conventional GIS approach considering the travel time on the transportation network from any given point to the airport; (2) to evaluate socio-economically the catchment area based on data available from national census and using a set of socio economic indicators; (3) to compare that evaluation between two temporal scenarios, 2001 and 2011; and to inquiry the main business stakeholders in the far 30 minutes travel time of the strip of the catchment area to understand the relationship between them and the closest airport.
From the results there are three previous comments that must be underlined:
• This work permits to observe in real scenarios the dimension and importance of the catchment areas for Oporto, Lisbon and Faro airports based on travel time as suggested by the airport authorities (ANA);
• We evaluate the catchment areas of Oporto, Lisbon and Faro airports in two temporal scenarios 2001 and 2011, and we observe how the socio economic indicators of each catchment area changed between those scenarios; it is difficult to assign a direct connection between each airport and local development, or the impact on local productivity based on the investment related to the infrastructure, but surely it may act somehow as a catalyst for the improvement of socioeconomic indicators even in the far from regions of the catchment areas;
• The perception of the importance assigned by stakeholders to the closest airport is crucial to construct a profitable relationship between them, mainly if there are other transport infrastructures in the vicinity which may be closer or more important for companies to develop own business; thus if quite all the companies have the perception of the importance of such an infrastructure in the vicinity, our conclusion is that airports must do efforts towards that approach too.
Although the objectives of the work were achieved future developments must be addressed as follows: • To search for other models of integration of airport performance data with catchment area
components;
• To search for other tools to inquire companies; • To geo-refer all available data with GIS software;
• To extent the transportation network to the Spanish territory to evaluate the complete catchment areas over the Portuguese border and searching for eventual overlap/competition with Spanish airports;
• To extent the transportation network to other modes of transport, mainly maritime and rail.
Acknowledgements
The authors thank the collaboration of Pedro Miguel Lemos Pinto Alves, MSc in Aeronautical Engineering by the University of Beira Interior (Covilhã, Portugal), by the technical support in the elaboration of this article.
References
Abraham Leung, Barbara T.H. Yen & Gui Lohmann, Why passengers’ geo-demographic characteristics matter to airport marketing, Journal of Travel & Tourism Marketing, 34:6, 833-850, 2017, DOI: 10.1080/10548408.2016.1250698
ACI - Airports Council International, The social and economic impact of airports in Europe, 2004 ACRP - Airport Cooperative Research Program, Airport economic impact methods and models, 2008 Alves P., Baltazar M.E., Silva J., Garra J., Vaz M., The Impact of Hinterland Over the Global Efficiency
of Airports, 19th APDR Congress - Place‐Based Policies and Economic Recovery, Universidade do Minho, Braga, 2013. ISBN 978-989-96353-8-8
ANA, Airports of Portugal,
http://www.ana.pt/en-S/Topo/institucional/aboutANA/AboutANA/Pages/About%20ANA.aspx, last access: 7 August, 2014a
ANA, Airports of Portugal,
http://routelab.ana.pt/en-US/Airports/Lisbon/CatchmentArea/Pages/default.aspx, last access: 7 August, 2014b
ANA, Airports of Portugal,
http://routelab.ana.pt/en-US/Airports/Porto/CatchmentArea/Pages/Catchment-Area-.aspx, last access: 7 August, 2014c
ANA, Airports of Portugal,
http://routelab.ana.pt/en-US/Airports/Algarve/CatchmentArea/Pages/default.aspx, last access: 7 August, 2014d
ANSR, Autoridade Nacional de Segurança Rodoviária, http://www.ansr.pt/Default.aspx?tabid=98, last access: 4 August 2014
Arend, M., Bruns, A., McCurry, J.W., The global Infrastructure Report, Site Selection Magazine, 580-5901, 2004
Bilotkach, V. and Mueller, J., Supply Side Substitutability and Potential Market Power of Airports: Case of Amsterdam Schiphol, Utilities Policy, 23(C), 5–12, 2012
British Chambers of Commerce, Economic Impacts of Hub Airports, 2009
CAA -Civil Aviation Authority, Airport market power assessments: Catchment area analysis, 2011 Colorado Department of Transportation, Colorado Airports Economic Impact Study, 2008
Copenhagen Economics, Airport Competition in Europe, Copenhagen Economics and ACI Europe, Copenhagen, 2012
Dejan Paliska, Samo Drobne, Giuseppe Borruso, Massimo Gardina, Daša Fabjan, Passengers' airport choice and airports' catchment area analysis in cross-border Upper Adriatic multi-airport region, Journal of Air Transport Management, Volume 57, Pages 143-154, October 2016,
https://doi.org/10.1016/j.jairtraman.2016.07.011
Encyclopaedia Britannica, http://www.britannica.com/EBchecked/topic/266517/hinterland, last access: 24 March 2014
Ferreira, E.Z., Junior, H.V., Correia, R.C., Worldwide Efficiency Evaluation of Airports: The use of DEA Methodology, Aeronautics Institute of Technology, Brazil, 2010
Fröhlich, K., Niemeier, H.-M., The importance of spatial economics for assessing airport competition, Journal of Air Transport Management, 2011
Graham A., Managing airports: an International Perspective, 2008
Hakfoort J., Poot T., Rietveld P., The Regional Economic Impact of an Airport: The Case of Amsterdam Schiphol Airport, 2001
Hill M., Hill A., Investigação por Questionário, 2009
Informa D&B, https://www.informadb.pt, last access: 4 August 2014
James Wiltshire, IATA Economics Briefing No 11: Airport Competition, V 1.2, IATA, November 2013 Jansen K., Corley K., Jansen B., E-Survey Methodology, 2007
Kasarda, J.D., Logistics and the rise of aerotropolis, Real Estate Issues, Vol. 25, No.4, 2000 Kasarda J.D. and Appold S. J., Detroit region aerotropolis benchmarking report, 2008 Lieshout R., Measuring the size of an airport’s catchment area, 2012
Maertens S., Estimating the market power of airports in their catchment areas – a Europe-wide approach, 2011
Marcucci E., Gatta V., Regional airport choice: consumer behavior and policy implications, 2011 Maria E. Baltazar, Tiago Rosa, J. Silva, Global decision support for airport performance and efficiency
assessment, Journal of Air Transport Management, 71 (2018) 220-242, 2018, https://doi.org/10.1016/j.jairtraman.2018.04.009
NERA – Associação Empresarial da Região do Algarve, Caracterização da Estrutura Económica do Algarve, 2008
NERLEI – Associação Empresarial da Região de Leiria, Caracterização Económica e Social da Região e do Distrito de Leiria, 2002
O’ Donoghue A., Maximising the Economic Impact of Airports in the BMW Region, 2009 Oregon Department of Aviation, Economic Impact of Oregon Airports, 2008
Oxford Dictionaries, http://www.oxforddictionaries.com/definition/english/hinterland, last access: 24 March 2014
Paolo Beria, Antonio Laurino, Maria Nadia Postorino, Low-Cost Carriers and Airports: A Complex Relationship, in John D. Bitzan , James H. Peoples (ed.) The Economics of Airport Operations (Advances in Airline Economics, Volume 6) Emerald Publishing Limited, pp.361 – 386, 2017 Perry L. and Raghunath S., The emergence of the Airport City in the United States, Leigh-Fisher Focus,
Racius, https://www.racius.com/observatorio/2011/empresas-activas/, last access: 4 August 2014
Sept L., Naylor S., Weston R., Measuring the impact of social programs: A review of best practices, 2011 Silva S., Análise de Indicadores Sócio-Económicos, Ambientais e de Saúde de Araraquara-SP, 2009 Strobach, D., Competition between airports with an application of the state of Baden-Wurttemberg,
University of Hohenheim, Department of Economics, Stuttgart, ISSN 0930-8334, 2006
Suau-Sanchez P., An appraisal of the CORINE land cover database in airport catchment area analysis using a GIS approach, 2013
Transport Canada, Regional and Small Airports Study, Department of Transport, Canada, ISBN 0-662-38001-0, 2008
TRB – Transportation Research Board, Airport Economic Impact Methods and Models, 2008 Trochim W., http://www.socialresearchmethods.net/kb/survey.php, last access: 4 August, 2014 Van Wijk, M., Airports as City Ports in the City-region, Netherlands Geographical Studies, vol. 353,
2007
Város-Teampannon Ltd, Budapest, Catchment Area of the Liszt Ferenc International Airport, Integrated Regional Development Plan, Project No 4ce485p4, Central Europe Project Budapest, 2014
Washington State Department of Transportation, Aviation Economic Impact Study, 2012 Wikipedia, http://en.wikipedia.org/wiki/Hinterland, last access: 24 March 2014a