DOI: http://dx.doi.org/10.1590/2446-4740.01417 Volume 33, Number 4, p. 344-351, 2017
Introduction
The retina is the only place in the body where blood vessels can be viewed noninvasively in vivo. Technological evolution has been leading to the development of digital imaging systems over the last two decades, revolutionizing the ability to take images of the ocular fundus. Essentially, modern digital imaging systems provide images with suficient resolution for most clinical scenarios.
We described the reliability of the digital assessment of perifoveal capillary networks as an indicator of macular perfusion (Faria et al., 2014). This knowledge can be applied to various retinal conditions, such as diabetic macular edema or ischemia and age-related macular degeneration. Moreover, the assessment of foveal perfusion map relects the microcirculation status in the brain, heart, and kidney (Blonde, 2012; Flammer et al., 2013; Klein et al., 2006; McGeechan et al., 2009; Sun et al., 2009; Taylor et al., 2007).
Foveal avascular zone (FAZ) is the central structure of the macula and it is important for the macular function. Many previous studies in 1970s correlated macular ischemia and loss of visual acuity based on the analysis of angiographies (Bresnick et al., 1975; 1976; Kohner and Henkind, 1970). More recent studies have demonstrated that, in diabetics, extensive ischemia of the macular region enlarges the FAZ and this is the main feature of maculopathy, in which profound and irreversible visual loss may occur (Arend et al., 1995; Sim et al., 2013). Particularly, in cases of diabetic maculopathy, the extent of ischemia is masked by coexisting macular edema.
Algorithm for predicting macular dysfunction based on moment invariants
classiication of the foveal avascular zone in functional retinal images
Angélica Moises Arthur
1, Rangel Arthur
2, Alexandre Gonçalves Silva
3*, Marina Silva Fouto
4,
Yuzo Iano
1, Jacqueline Mendonça Lopes de Faria
51 Faculty of Electrical and Computer Engineering, University of Campinas, Campinas, SP, Brazil. 2 Faculty of Technology, University of Campinas, Limeira, SP, Brazil.
3 Department of Informatics and Statistics, Federal University of Santa Catarina, Florianópolis, SC, Brazil. 4 Department of Computer Science, Santa Catarina State University, Joinville, SC, Brazil.
5 Faculty of Medical Sciences, University of Campinas, Campinas, SP, Brazil.
Abstract Introduction: A new method for segmenting and quantifying the macular area based on morphological alternating
sequential iltering (ASF) is proposed. Previous studies show that persons with diabetes present alterations in the
foveal avascular zone (FAZ) prior to the appearance of retinopathy. Thus, a proper characterization of FAZ using
a method of automatic classiication and prediction is a supportive and complementary tool for medical evaluation
of the macular region, and may be useful for possible early treatment of eye diseases in persons without diabetic retinopathy. Methods: We obtained high-resolution retinal images using a non-invasive functional imaging system
called Retinal Function Imager to generate a series of combined capillary perfusion maps. We iltered sequentially
the macular images to reduce the complexity by ASF. Then we segmented the FAZ using watershed transform from an automatic selection of markers. Using Hu’s moment invariants as a descriptor, we can automatically classify and categorize each FAZ. Results: The FAZ differences between non-diabetic volunteers and diabetic subjects were automatically distinguished by the proposed system with an accuracy of 81%. Conclusion: This is an innovative method to classify FAZ using a fully automatic algorithm for segmentation (based on morphological operators)
and for the classiication (based on descriptor formed by Hu’s moments) despite the presence of edema or other
structures. This is an alternative tool for eye exams, which may contribute to the analysis and evaluation of FAZ morphology, promoting the prevention of macular impairment in diabetics without retinopathy.
Keywords Capillary perfusion mapping, Foveal avascular zone, Alternating sequential iltering, Automatic classiication of diabetes.
This is an Open Access article distributed under the terms of the Creative Commons Attribution License, which permits unrestricted use, distribution, and reproduction in any medium, provided the original work is properly cited.
How to cite this article: Arthur AM, Arthur R, Silva AG, Fouto MS, Iano Y, Faria JML. Algorithm for predicting macular dysfunction based on moment invariants classification of the foveal avascular zone in functional retinal images. Res Biomed Eng. 2017; 33(4):344-351. DOI: 10.1590/2446-4740.01417.
*Corresponding author: Department of Informatics and Statistics, School of Technology, Federal University of Santa Catarina, Campus Reitor João David Ferreira Lima, s/n, Trindade, CEP 88040-900, Florianópolis, SC, Brazil. E-mail: [email protected]
A recent research described features of optical coherence tomography that also associated the macular ischemia with impaired visual function (Sim et al., 2014).
In 2015, we developed a new method for automatic segmentation of the FAZ using watershed transform (Silva et al., 2015) applied to the original image from two markers: the irst deined by the global minimum contour of the alternating sequential iltering (ASF) image (ilter to reduce the complexity of the original intensities), and the second deined by an inscribed circle of the irst marker. The growing regions procedure derived from these two markers resulted in two areas precisely bounded by the FAZ, with an island of relatively darker tones around them. The aim of the present work was to demonstrate the reliability of this algorithm in the automatic segmentation of FAZ. In addition, we deined a descriptor for its characterization and classiication in order to detect abnormality in macula image. For this task, we added a set of eye fundus images from diabetics to the database, and implemented a FAZ descriptor based on Hu’s moments. We established the distinction of non-diabetic or diabetic pattern (without retinopathy) after training performed by a classiier, highlighting extra-trees compared to tested k-nearest neighbourhood (KNN), random forests, support vector machines and neural networks.
Methods
Study population
We invited persons with type 1 diabetes at the hospital of the University of Campinas to participate in the study. The criteria for inclusion in the study were a history of sudden onset of severe hyperglycemia and weight loss, spontaneous sustained ketosis or ketonuria, age between 18 to 45 years, living with diabetes mellitus (to allow enough time for the development of diabetic retinal disease), and freedom from any other endocrine and metabolic disease, as well as non-diabetic renal, liver and cardiac disease. In this study, we included 10 persons with diabetes for at least 10 years and without retinopathy, i.e., early treatment diabetic retinopathy study level 1 (Klein et al., 1984). This was conirmed by examination by indirect ophthalmoscopy and biomicroscopy. The exclusion criteria were pregnancy, high degree myopia, chorioretinitis scars, posterior uveitis, glaucoma, and previous ocular surgery, because such events may inluence the development of diabetic retinopathy (Conrath et al., 2005). We invited 10 staff members from the hospital of the University of Campinas to participate as control group, with a mean age of 30 years (range 25-35). All volunteers presented at the time of evaluation best corrected visual acuity of 20/20 in both eyes. Therefore, it is very likely that
ischemic changes present in macular area were very mild. This was important because there is a strong correlation between visual acuity and macular ischemia (Samara et al., 2017). Our research was carried out in conformity with the tenets of the “Declaration of Helsinki” and approved by the local Ethics Committee (approval number 745/2011). The informed consent was obtained from participants prior to conducting the ophthalmic examination.
Image acquisition
We described the image acquisition in previous work (Faria et al., 2014). Briely, we acquired retinal images using a Retinal Function Imager (RFI) that applies fundus illumination with predominantly green component to highlight blood vessels (Grinvald et al., 2004; Izhaky et al., 2009). We acquired each image using a 20-degree aperture camera, focused on the fovea and with a resolution of 4.27 micron/pixel. After image recording, we can create “differential images” by dividing each single retinal image by the average of the entire series in order to extract the motion signal from the stationary retinal background. In the present work, four to ive image series of 1024×1024 pixels per frame were used from each volunteer to get a capillary perfusion map (CPM) by RFI.
Automatic segmentation of foveal avascular zone
After acquisition of the retinal images via RFI, we can apply a sequence of image processing operators, based on dilation and erosion (Dougherty and Lotufo, 2003; Silva et al., 2015). Dilation and erosion of a pixel (p) are, respectively, the maximum and the minimum intensities determined on its neighborhood. Morphological opening of p is achieved by erosion followed by dilation to eliminate small noises as narrow isthmuses or thin protrusions. In contrast, we can achieve morphological closing by dilation followed by erosion (dual of opening) to ill crevices in the borders, thus joining the adjacent regions. ASF consists in an iterative morphological openings and closings applied on an increasing neighborhood (disk-shaped in our case) for each p (Dougherty and Lotufo, 2003; Silva et al., 2015). These authors used ASF typically as a restoration procedure to eliminate noise and mixed granularity. In this work, we applied ASF to simplify the images, enhancing the separation of regions where the intensities are slightly greater compared to surrounding areas, i.e., with high probability of occurrence of FAZ. For segmentation, they applied ASFs for n iterations on a combined CPM series. Increasing disks around each pixel p for 1, 4, we can consider 10 iterations for analyses as shown in Figure 1.
Figure 1. Example of n iterations of alternating sequential iltering (ASF) applied to a combined capillary perfusion map (CPM) series using
disk-shaped neighborhood on each pixel p. (a) Original image after application of the CPM tool; (b) Only one iteration (n=1) of ASF on the previous image; (c) Four sequential iterations (n=4) of ASF on the same initial image generating a simpler image, but still several catchment basins remained; (d) More iterations (n=10) resulted in a very simple image with only one global minimum in the center.
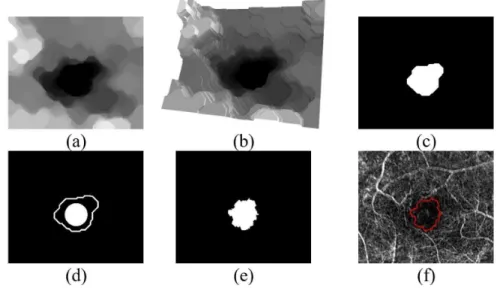
Figure 2. Foveal avascular zone (FAZ) localization and segmentation. (a) Alternating sequential iltering (ASF) image (n=10); (b) 3D representation of topographical surface of this image in greyscale as a relief altitude; (c) Region determined from the global minima of the image in (b), used as automatic internal marker of FAZ; (d) Circle with 75% of the maximum inscribed circle radius, and contour of Figure 2c; (e) FAZ segmentation after watershed transform applied on the original capillary perfusion map (CPM) image of Figure 1a using connected components of Figure 2d as markers; (f) The segmentation border was drawn on the original CPM image.
by a 3D graph of Figure 2a with the intensity of a pixel representing an altitude on the topographic surface. The aim is to approximate the intensities of the darker regions of lower values or even to remove them, deining the global minima or regions completely
boundaries of adjacent catchment basins formed by the accumulation of water over regional minima or regions with markers. For automatic FAZ segmentation, we deine inner and outer markers (seeds labeled as internal or external for growth of regions) as a binary image (Figure 2d) and we obtain the area between both limits (Figure 2e) by watershed transform. As a result, the automatic FAZ segmentation can be obtained (Figure 2f) from a combined CPM series of high-resolution retinal image. The segmentation obtained from the proposed algorithm achieved an accuracy of 99% compared to an average of three manual segmentations. We described details of this implementation in recent publication (Silva et al., 2015).
Automatic classiication of retinal images Next, we processed each FAZ segmented region for extraction of features. Speciically, Hu’s moments are interesting by the invariance to translation, rotation and scale. Seven invariant moments are described using the normalized central moments of second-order and third order (Hu, 1962). Firstly, an object represented by a binary digital image f(x,y) is considered. Then, f(x,y)=1 is associated to a coordinate (x,y) belonging to the object and f(x,y)=0 to a background pixel (x and y are line and column values, respectively). Thus, x and y are the averages of the lines and columns, respectively, of all pixels belonging to the object, (x y, ) is the centroid or mass center. We compute the spatial moments by Equation 1 and use Equation 2 to calculate the invariant central moments with respect to translations.
( ),
i j ij
x y
M = ∑∑x y f x y (1)
( ) (p ) (q , )
pq x y
x x y y f x y
µ =∑∑ − − (2)
Invariants ηij with respect to both translation and scale can be deined from central moments (Equation 2) by dividing through a properly scaled zero-th central moment, according to Equation 3, considering i + j ≥ 2.
1 2 00
ij ij +i+j
µ η =
µ (3)
Finally, Equations 4 to 10 describe the seven Hu’s moments, invariants with respect to translation, scale and rotation.
1 20 02
I = η + η (4)
( )2 2
2 20 02 4 11
I = η − η + η (5)
( ) (2 )2
3 30 3 12 3 21 03
I = η − η + η − η (6)
( ) (2 )2
4 30 12 21 03
I = η + η + η + η (7)
( )( ) ( ) ( )
( )( ) ( ) ( )
2 2
5 30 12 30 12 30 12 21 03
2 2
21 03 21 03 30 12 21 03
3 3
3 3
I = η − η η + η η + η − η + η +
η − η η + η η + η − η + η (8)
( ) ( ) ( )
( )( )
2 2
6 20 02 30 12 21 03
11 30 12 21 03
4
I = η − η η + η − η + η +
η η + η η + η (9)
( )( ) ( ) ( )
( )( ) ( ) ( )
2 2
7 21 03 30 12 30 12 21 03
2 2
30 12 21 03 30 12 21 03
3 3
3 3
I = η − η η + η η + η − η + η −
η − η η + η η + η − η + η (10)
We calculated and depicted these seven values for the FAZ region of non-diabetic and diabetic persons in the multidimensional space (up to seven dimensions) for machine training algorithms. After tests using several classiier algorithms, we chose extra-trees (Geurts et al., 2006) for presenting one of the best accuracies and area under the receiver operating characteristic (ROC) curve (according to Table 2). The idea is to use all of Hu’s moments to compose a descriptor in a multidimensional space and to automatically separate the samples into two classes. We evaluate the descriptor of an unclassiied FAZ based on the determination of the smallest distances in relation to all points already labeled in this space. From the set of Hu’s moment invariants as descriptor, the classiier provides the automatic distinction of an unknown FAZ in two possible classes: non-diabetic and diabetic.
We partitioned the dataset randomly into kf mutually exclusive subsets (folds) that contained a representative number of each class. We retained of the kf parts, a single subset as the validation data for testing the model, and used the remaining kf -1 as training data. We expressed the evaluation statistics of the kf -fold-cross-validation results, with each of the kf subsets used exactly once as the validation data (Kohavi, 1995), as ‘mean’ ± ‘standard deviation’. In other words, we obtained a single estimation from the average and standard deviation of kf results for each subject (non-diabetic or diabetic). We adopted two values for
kf: kf =38 (total of samples) or leave-one-out-validation, and kf =5 or 5-fold-cross-validation.
Results
through the accuracy (sum of true positive and true negative, divided by the sum of true positive, true negative, false positive and false negative classiications) from leave-one-out and 5-fold-cross-validation. We also considered the area under the ROC curve (AUC) from 5-fold-cross-validation. In addition, we took into account the results of the multidimensional classiier expressed as the average and standard deviation for each volunteer (non-diabetic or diabetic).
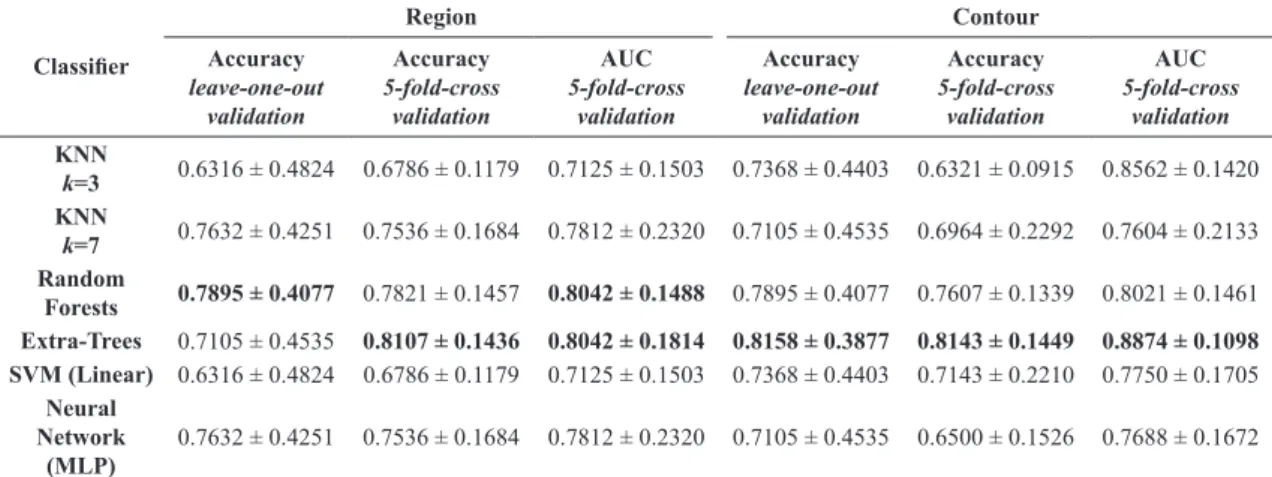
Tables 1 and 2 show the performance of the tested classiiers at detecting the abnormality of each FAZ segmentation. We compared the following classiiers: k-nearest neighbourhood (Shakhnarovich et al., 2006) with two odd values of parameter k, random forests (Breiman, 2001), extra-trees (Geurts et al., 2006), linear support vector machines (Wu et al., 2004),
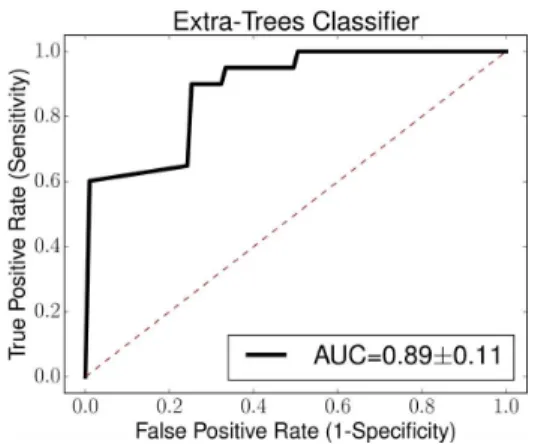
and multi-layer perceptron neural network (MLP) (Kingma and Ba, 2015). We used all seven moments of Hu as descriptor in Table 1. In Table 2, we use only the moments I2, I4, and I7 because they are the most representative to serve as descriptor, reaching the best accuracy from all combinations of reduction of the moment invariants. We obtained the most outstanding set of results with extra-trees, in which the automatic classiication of a new fundus image classiication was correct with about 81% accuracy (using both leave-one-out and 5-fold-cross validations) and 89% AUC, considering only moments I2, I4 and I7
as descriptors of FAZ contours (Figure 3). This result is quite signiicant considering the relatively small number of segmented images in the database and the great dificulty of distinguishing such classes even by an expert.
Table 1. Accuracy and area under the receiver operating characteristic curve (AUC) of multidimensional classiiers for automatic identiication of
the type of subject (non-diabetic or diabetic), using all seven moments of Hu as descriptor of the segmented regions of each foveal avascular zone or contours of these regions. In this table, k is the number of nearest neighbors of k-nearest neighborhood (KNN) algorithm. MLP is the multi-layer perceptron neural network. SVM means support vector machine network. The best results by type of experiment and validation are highlighted in bold.
Classiier
Region Contour
Accuracy
leave-one-out validation
Accuracy
5-fold-cross validation
AUC
5-fold-cross validation
Accuracy
leave-one-out validation
Accuracy
5-fold-cross validation
AUC
5-fold-cross validation
KNN
k=3 0.7105 ± 0.4535 0.7500 ± 0.2140 0.7708 ± 0.2266 0.7368 ± 0.4403 0.7143 ± 0.2210 0.7500 ± 0.2539 KNN
k=7 0.7632 ± 0.4251 0.7750 ± 0.2335 0.7812 ± 0.2381 0.6053 ± 0.4888 0.5321 ± 0.2028 0.6854 ± 0.2763 Random
Forests 0.6842 ± 0.4648 0.7821 ± 0.1457 0.7500 ± 0.1630 0.6842 ± 0.4648 0.6821 ± 0.1329 0.6667 ± 0.1878 Extra-Trees 0.7105 ± 0.4535 0.7286 ± 0.1575 0.6708 ± 0.2245 0.8421 ± 0.3646 0.6000 ± 0.1305 0.8646 ± 0.1385 SVM (Linear) 0.5263 ± 0.4993 0.5286 ± 0.0350 0.7583 ± 0.2614 0.6579 ± 0.4744 0.6821 ± 0.1843 0.6500 ± 0.2643
Neural Network
(MLP)
0.7895 ± 0.4077 0.7250 ± 0.2050 0.7583 ± 0.2614 0.6842 ± 0.4648 0.6536 ± 0.2275 0.6542 ± 0.3032
Table 2. Accuracy and area under the receiver operating characteristic curve (AUC) of multidimensional classiiers for automatic identiication of
the type of subject (non-diabetic or diabetic), using moments I2, I4 and I7 as descriptor of the segmented regions of each foveal avascular zone or contours of these regions. The best result by type of experiment and validation is highlighted in bold. In this table, k is the number of nearest neighbors of k-nearest neighborhood (KNN) algorithm. MLP is the multi-layer perceptron neural network. SVM means support vector machine network.
Classiier
Region Contour
Accuracy
leave-one-out validation
Accuracy
5-fold-cross validation
AUC
5-fold-cross validation
Accuracy
leave-one-out validation
Accuracy
5-fold-cross validation
AUC
5-fold-cross validation
KNN
k=3 0.6316 ± 0.4824 0.6786 ± 0.1179 0.7125 ± 0.1503 0.7368 ± 0.4403 0.6321 ± 0.0915 0.8562 ± 0.1420 KNN
k=7 0.7632 ± 0.4251 0.7536 ± 0.1684 0.7812 ± 0.2320 0.7105 ± 0.4535 0.6964 ± 0.2292 0.7604 ± 0.2133 Random
Forests 0.7895 ± 0.4077 0.7821 ± 0.1457 0.8042 ± 0.1488 0.7895 ± 0.4077 0.7607 ± 0.1339 0.8021 ± 0.1461 Extra-Trees 0.7105 ± 0.4535 0.8107 ± 0.1436 0.8042 ± 0.1814 0.8158 ± 0.3877 0.8143 ± 0.1449 0.8874 ± 0.1098 SVM (Linear) 0.6316 ± 0.4824 0.6786 ± 0.1179 0.7125 ± 0.1503 0.7368 ± 0.4403 0.7143 ± 0.2210 0.7750 ± 0.1705
Neural Network
(MLP)
Discussion
There are few works found in the literature on retina classiication in diabetes based on FAZ shape analysis. According to Table 3, all related studies (Alipour et al., 2012; Ballerini, 1999a; 1999b; Hani et al., 2010) used subjects with diabetic retinopathy. Alipour et al. (2012) and Ballerini (1999a; 1999b) used images obtained by an invasive method of contrast injection. In relation to the segmentation, selections of initial point or image cropping were carried out in some cases (Ballerini, 1999a; 1999b; Hani et al., 2010). Area (Alipour et al., 2012; Hani et al., 2010) or distinct formulation of moments (Ballerini, 1999a; 1999b) were used as features of each
FAZ. As there is no similarity in the image databases used, it is not possible to compare the results objectively. However, we added notes about validation in the last column of Table 3.
In this study, we propose a new method for automatic FAZ classiication using the CPM tool of an RFI apparatus based on an algorithm of morphological operator. Using a high-resolution retinal image CPM tool, we initiated the segmentation with ASF, followed by the deinition of global minima and watershed, thus generating a simpler image. This process enabled us to automatically determine the statistics of each FAZ. The algorithm applied in this technology is able to automatically identify correctly in 81% of the cases whether a certain FAZ is or is not abnormal, with conirmation of the diagnosis of diabetes from the clinical chart. To the best of our knowledge, the main contributions of this work are: simple and direct automatic segmentation of FAZ without vessel identiication, initial selection of point or cropping of image; use of a subset of Hu’s moment invariants as descriptor and multiple classiiers (especially extra-trees) that allowed satisfactory results (>70%) in almost all tests. The proposed technique may be useful in the early prognosis of retinopathy, and may signal de need of ophtalmological care by telemedicine systems, especially in regions with insuficient medical care.
Overall, in this paper, we described a novel computational algorithm to automatically evaluate the retina macular region. Future works can be conducted with a larger diabetic population to improve the training database of this work. The predictive results of this
Table 3. Comparison of related works found in the literature for retina classiication, with or without diabetic retinopathy (DR), based on foveal
avascular zone (FAZ) segmentation, characterization and classiication.
Work Image source Segmentation Features Classiier Validation notes
(Hani et al.,
2010)
Color fundus imaging, 315 images, subjects with DR
Center is chosen to crop the FAZ (600x600 pixels), Otsu’s thresholding, end points of vessels
Area Gaussian Bayes Not applicable
(only for DR grading)
(Al
ipou
r e
t a
l.,
2012)
Color fundus imaging and luorescein angiography, 45 non-diabetics and 30 diabetics with DR
Digital Curvelet Transform, optic disc localization, end points of vessels around FAZ
Area and variance
Linear regression
Accuracy is not mentioned.
Speciicity of 86% for
distinguishing normal and abnormal
(Ballerini,
1999a
;
1999b)
SLO (25 fps), injection
of a bolus of luorescein, 512x512, 14 non-diabetics and 12 diabetics with DR
Center is chosen to crop the FAZ, active contours, genetic optimization
Central moments (Equation 2)
Back-propagation neural networks
Accuracy of 84.6% (region moments), and 92.3% (boundary moments) using leave-one-out for distinguishing diabetic and non-diabetic
Proposed
HFI (no need for contrast injection), 1024x1024, 10 non-diabetics (20 images) and 10 diabetics (18 images) without DR
Fully automatic FAZ segmentation, morphology iltering,
watershed
Hu’s moment invariants (Equations 4 to 10)
Extra-trees (and others)
Accuracy of 81,6% (leave-one-out) and 81,4% (5-fold-cross), and AUC of 88,7% for distinguish diabetic and non-diabetic
Figure 3. Receiver operating characteristic with area under the curve
(AUC) of 0.89±0.11 from extra-trees classiier for 5-fold-cross-validation,
algorithm can also be applied to track the progression of retinopathy in diabetic patients.
Acknowledgements
This work had the support of the Fundação de Amparo à Pesquisa do Estado de São Paulo (FAPESP, Grant 2009/52890-4; 2014/22687-0).
References
Alipour S, Rabbani H, Akhlaghi M, Dehnavi A, Javanmard S. Analysis of foveal avascular zone for grading of diabetic retinopathy severity based on curvelet transform. Graefes Arch Clin Exp Ophthalmol. 2012; 250(11):1607-14. PMid:22760960. http://dx.doi.org/10.1007/s00417-012-2093-6.
Arend O, Wolf S, Harris A, Reim M. The relationship of macular microcirculation to visual acuity in diabetic patients. Arch Ophthalmol. 1995; 113(5):610-4. PMid:7748131. http:// dx.doi.org/10.1001/archopht.1995.01100050078034.
Ballerini L. Moment theory for FAZ shape description in diabetic retinopathy. In: EMBEC’99 European Medical and Biological Engineering Conference; 1999; Vienna, Austria. Vienna: Organizing Committee of the EMBEC ‘99; 1999a. p. 1002-3.
Ballerini L. An automatic system for the analysis of vascular lesions in retinal images. In: Nuclear Science Symposium and Medical Imaging Conference; 1999; Seattle, WA, USA. Piscataway, NJ: IEEE; 1999b. p. 1598-602.
Blonde L. Benefits and risks for intensive glycemic control in patients with diabetes mellitus. Am J Med Sci. 2012; 343(1):17-20. PMid:22205061. http://dx.doi.org/10.1097/ MAJ.0b013e31823ea23e.
Breiman L. Random forests. Mach Learn. 2001; 45(1):5-32. http://dx.doi.org/10.1023/A:1010933404324.
Bresnick G, De Venecia G, Myers F, Harris J, Davis M. Retinal ischemia in diabetic retinopathy. Arch Ophthalmol. 1975; 93(12):1300-10. PMid:1200895. http://dx.doi.org/10.1001/ archopht.1975.01010020934002.
Bresnick G, Engerman R, Davis M, De Venecia G, Myers F. Patterns of ischemia in diabetic retinopathy. Trans Sect Ophthalmol Am Acad Ophthalmol Otolaryngol. 1976; 81(4 Pt 1):OP694-709. PMid:822560.
Conrath J, Giorgi R, Raccah D, Ridings B. Foveal avascular zone in diabetic retinopathy: quantitative vs qualitative assessment. Eye. 2005; 19(3):322-6. PMid:15258601. http:// dx.doi.org/10.1038/sj.eye.6701456.
Dougherty ER, Lotufo RA. Hands-on morphological image processing. Vol. TT59. Bellingham-WA, USA: SPIE Press; 2003.
Faria JML, Duarte DA, Chavez RFL, Arthur AM, Arthur R, Iano Y. Reliability and validity of digital assessment of perifoveal capillary network measurement using high-resolution imaging. Br J Ophthalmol. 2014; 98(6):726-9. PMid:24511082. http:// dx.doi.org/10.1136/bjophthalmol-2013-304100.
Flammer J, Konieczka K, Bruno RM, Virdis A, Flammer AJ, Taddei S. The eye and the heart. Eur Heart J. 2013; 34(17):1270-8. PMid:23401492. http://dx.doi.org/10.1093/eurheartj/eht023.
Geurts P, Ernst D, Wehenkel L. Extremely randomized trees. Mach Learn. 2006; 63(1):3-42. http://dx.doi.org/10.1007/ s10994-006-6226-1.
Grinvald A, Bonhoeffer T, Vanzetta I, Pollack A, Aloni E, Ofri R, Nelson D. High-resolution functional optical imaging: from the neocortex to the eye. Ophthalmol Clin North Am. 2004; 17(1):53-67. PMid:15102513. http://dx.doi.org/10.1016/j. ohc.2003.12.003.
Hani A, Nugroho H, Nugroho H. Gaussian Bayes classifier for medical diagnosis and grading: application to diabetic retinopathy. In: IEEE EMBS Conference on Biomedical Engineering and Sciences; 2010; Kuala Lumpur, Malaysia. Piscataway, NJ: IEEE; 2010. p. 5632-5.
Hu M-K. Visual pattern recognition by moment invariants. IRE Trans Inf Theory. 1962; 8(2):179-87. http://dx.doi.org/10.1109/ TIT.1962.1057692.
Izhaky D, Nelson DA, Burgansky-Eliash Z, Grinvald A. Functional imaging using the retinal function imager: direct imaging of blood velocity, achieving fluorescein angiography-like images without any contrast agent, qualitative oximetry, and functional metabolic signals. Jpn J Ophthalmol. 2009; 53(4):345-51. PMid:19763751. http://dx.doi.org/10.1007/ s10384-009-0689-0.
Kingma D, Ba J. Adam: a method for stochastic optimization. In: Proceedings of the 3rd International Conference on Learning Representations (ICLR); 2015; San Diego, CA, USA. San Diego: Hilton San Diego Resort & Spa; 2015. p. 1-15.
Klein R, Klein B, Moss S, Davis M, DeMets D. The Wisconsin epidemiologic study of diabetic retinopathy - II. Prevalence and risk of diabetic retinopathy when age at diagnosis is less than 30 years. Arch Ophthalmol. 1984; 102(4):520-6. PMid:6367724. http://dx.doi.org/10.1001/ archopht.1984.01040030398010.
Klein R, Klein BE, Moss SE, Wong TY, Sharrett AR. Retinal vascular caliber in persons with type 2 diabetes: the Wisconsin epidemiological study of diabetic retinopathy: XX. Ophthalmology. 2006; 113(9):1488-98. PMid:16828517. http:// dx.doi.org/10.1016/j.ophtha.2006.03.028.
Kohavi R. A study of cross-validation and bootstrap for accuracy estimation and model selection. In: Proceedings of the 14th International Joint Conference on Artificial Intelligence; 1995; Montreal, Quebec, Canada. San Francisco, CA, USA: Morgan Kaufmann Publishers Inc.; 1995. p. 1137-43.
Kohner EM, Henkind P. Correlation of fluorescein angiogram and retinal digest in diabetic retinopathy. Am J Ophthalmol. 1970; 69(3):403-14. PMid:4907465. http://dx.doi.org/10.1016/0002-9394(70)92273-7.
Am J Epidemiol. 2009; 170(11):1323-32. PMid:19884126. http://dx.doi.org/10.1093/aje/kwp306.
Samara W, Shahlaee A, Adam M, Khan M, Chiang A, Maguire J, Hsu J, Ho A. Quantification of diabetic macular ischemia using optical coherence tomography angiography and its relationship with visual acuity. Ophthalmology. 2017; 124(2):235-44. PMid:27887743. http://dx.doi.org/10.1016/j. ophtha.2016.10.008.
Shakhnarovich G, Darrell T, Indyk P. Nearest-neighbor methods in learning and vision: theory and practice (neural information processing). Cambridge: The MIT Press; 2006.
Silva AG, Fouto MS, Silva AT, Arthur R, Arthur AM, Iano Y, De Faria JML. Segmentation of foveal avascular zone of the retina based on morphological alternating sequential filtering. In: IEEE 28th International Symposium on Computer-Based Medical Systems (CBMS); 2015; Ribeirão Preto, Brazil. Piscataway, NJ: IEEE; 2015. p. 38-43.
Sim DA, Keane PA, Fung S, Karampelas M, Sadda SR, Fruttiger M, Patel PJ, Tufail A, Egan CA. Quantitative analysis of diabetic macular ischemia using optical coherence tomography. Invest
Ophthalmol Vis Sci. 2014; 55(1):417-23. PMid:24398090. http://dx.doi.org/10.1167/iovs.13-12677.
Sim DA, Keane PA, Zarranz-Ventura J, Fung S, Powner MB, Platteau E, Bunce CV, Fruttiger M, Patel PJ, Tufail A, Egan CA. The effects of macular ischemia on visual acuity in diabetic retinopathy. Invest Ophthalmol Vis Sci. 2013; 54(3):2353-60. PMid:23449720. http://dx.doi.org/10.1167/ iovs.12-11103.
Sun C, Wang JJ, Mackey DA, Wong TY. Retinal vascular caliber: systemic, environmental, and genetic associations. Surv Ophthalmol. 2009; 54(1):74-95. PMid:19171211. http:// dx.doi.org/10.1016/j.survophthal.2008.10.003.
Taylor B, Rochtchina E, Wang JJ, Wong TY, Heikal S, Saw SM, Mitchell P. Body mass index and its effects on retinal vessel diameter in 6-year-old children. Int J Obes. 2007; 31(10):1527-33. PMid:17607323. http://dx.doi.org/10.1038/ sj.ijo.0803674.