Printed version ISSN 0001-3765 / Online version ISSN 1678-2690 http://dx.doi.org/10.1590/0001-3765201620150755
www.scielo.br/aabc
Dating stalagmite from Caverna do Diabo (Devil´S Cave) by TL and EPR techniques
SHIGUEO WATANABE1
, NILO F. CANO2
, T.K. GUNDU RAO1
, BETZABEL N. SILVA-CARRERA1
, LUCAS S. CARMO3
, ANTONIO J.A. QUINA3
, ROSELI F. GENNARI1 , CASIMIRO S. MUNITA3
, JORGE S. AYALA-ARENAS4
and BRUNO G. FERNANDES5
1
Instituto de Física, Universidade de São Paulo, Rua do Matão, Travessa R, 187, Cidade Universitária, 05508-090 São Paulo, SP, Brazil 2
Departamento de Ciências do Mar, Universidade Federal de São Paulo, Rua Doutor Carvalho de Mendonça, 144, 11070-100 Santos, SP, Brazil
3
Instituto de Pesquisas Energéticas e Nucleares, IPEN-CNEN/SP, Av. Prof. Lineu Prestes, 2242, Cidade Universitária, 05508-000 São Paulo, SP, Brazil 4
Escuela Profesional de Física, Facultad de Ciencias Naturales y Formales, Universidad Nacional de San Agustín/UNSA, Av. Independencia, s/n, Arequipa, Peru 5
Departamento de Engenharia Metalúrgica e Materiais, Escola Politécnica, Universidade de São Paulo, Av. Prof. Mello Moraes, 2463, 05508-030 São Paulo, SP, Brazil
Manuscript received on October 19, 2015; accepted for publication on June 18, 2016
ABSTRACT
A cylindrical fragment of stalagmite from Caverna do Diabo, State of São Paulo, Brazil, has been studied and dated by thermoluminescence and electron paramagnetic resonance techniques. The thermoluminescence glow curves of stalagmite samples and subsequently gamma irradiated, have shown rise of three peaks at 135, 180 and 265 °C. From electron paramagnetic resonance spectra of stalagmite was possible to clearly identify three paramagnetic centers in the g = 2.0 region: Centers I, II and III are due to , and , respectively. The additive method was applied to calculate the accumulated dose using thermoluminescence peak at 265 °C and the electron paramagnetic resonance signal at g = 1.9973 of CO
-2
radical. The ages of the different slices of stalagmite were determined from the Dac- values and Dan- value,
obtaining an average of 86410 for central slice, 53421 for second slice, 31490 for third slice and 46390 years B.P. for the central region of upper end.
Key words: stalagmite, Caverna do Diabo, dating, TL, EPR.
Correspondence to: Nilo Francisco Cano E-mail: [email protected]
INTRODUCTION
Many caves in nature are characterized by
speleo-therms such as stalagmite, stalactite, dolomite, etc.
Some of them may have originated more than
mil-lions years ago.
flooding or to an extraordinarily high precipitation
that brought a large amount of small clay particles as inclusions into the stalagmite (Ikeya 1980, Arakawa and Hori 1989). Brown rings can be used as an indicator of the paleoclimate, like an age indicator in dendrochronology (tree ring counting), at the local level. These brown rings or clay sediments might have occurred at the time of a global change in the climate, or due to changes in the groundwater level related to sea-level changes (Ikeya 1993). The study of stalagmite is thus a powerful tool for the high-resolution reconstruction of past climate changes and the period of each change. Through the dating of stalagmite it is possible to support the paleoenvironmental studies based on the stalagmite growth with the time. Therefore, the study of
stalagmites is a powerful tool for reconstruction and determination of the period of the past climate changes.
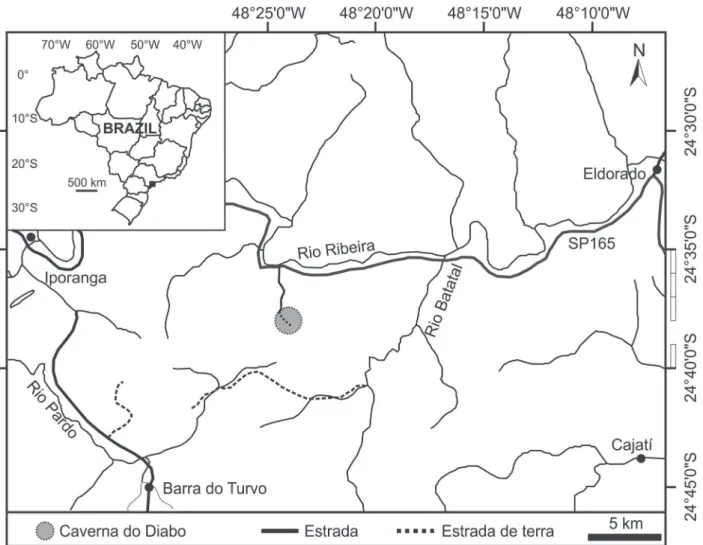
Caverna do Diabo (Devil´s Cave) is an ex-tensive cave located in southeast of the São Paulo State, Brazil (24°38’0”S and 48°24’0”W) (see Fig.
1), with 6340 m of galleries already identified and
unevenness of the order 175 m. It is well known due to a large number of huge stalagmites and sta-lactites. The wall of the cave is mainly composed of dolomite, but, calcite is also part of the wall in many parts.
Dating by TL and/or EPR techniques is a par-ticular application of dosimetry using natural min-erals such as carbonates (in this work stalagmite), as dosimeters of environmental radiation arising
from the decay of naturally occurring U, Th and K. The TL or EPR intensity of natural samples is pro-portional to the absorbed dose up to dating. Both dating techniques are radiogenic methods that can be used to determine the amount of radiation dam-age stored in a solid material. These techniques are based on the measurement of radiation-sensitive TL or EPR signals which begin to form after crys-tallization or can grow after being reset to zero or reduced to a residual level by exposure during dep-ositional processes (McKeever 1985, Wintle 1997, Ikeya 1993, Bartoll and Ikeya 1997, Aitken 1985, Grün 1989).
A study of the thermoluminescent and EPR response of the stalagmite sample from Devil´s Cave with gamma irradiation is reported in this
work in order to find an alternative material for
dating by TL and EPR techniques. Furthermore,
we present the first results of dating of a stalagmite
from the Devil´s Cave, São Paulo State, Brazil. There is no evidence in the literature about dating of stalagmite using both techniques for this cave.
MATERIALS AND METHODS
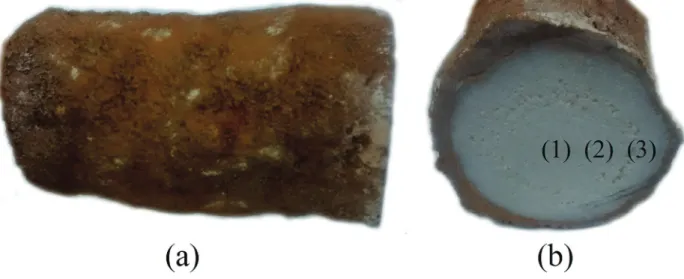
A cylindrical fragment of stalagmite was collected from Devil’s Cave, State of São Paulo, Brazil (see Fig. 1). Fig. 2a shows a picture of a piece of
stalagmite that has a diameter of about 15 cm and 37 cm length. From lower end of the stalagmite cylinder, about five grams around central axis,
another five grams from 2 cm to 4 cm cylindrical layer from the central axis and another five grams
from 4 cm to 6 cm cylindrical layer from the central axis were extracted, which were labeled as 1, 2 and 3 (See Fig. 2b).
The samples labeled as 1, 2 and 3 were first
crushed and then sieved, retaining grains between 0.080 and 0.180 mm in size. These powders were irradiated with gamma-rays at doses in the range of tens of Gy up to 600 Gy. The additive dose method was used to determine the accumulated dose (Dac) in TL as well as in EPR measurements.
The crystal structure of stalagmite sample was examined by X-ray diffraction (XRD) analysis; utilizing a Rigaku diffractometer with Cu-kα radiation and using a 10 - 70° scan range.
Concentrations of U, Th and K in the stalagmite samples were determined by means of Instrumental Neutron Activation Analysis (INAA) analysis.
The TL measurements were performed in a nitrogen atmosphere using a model 4500 Harshaw TL reader equipped with two photomultiplier tubes, which could record luminescence signals independently. The reader was controlled by WinREMS Software, which was supplied with the
spectrometer and was run on a Windows computer. The heating rate used in the TL measurements was 4 °C/s. Each point in the glow curve represents an average of six readings.
EPR measurements were carried out with a Bruker EMX EPR spectrometer operating at X-band frequency with 100 kHz modulation frequency. One hundred milligrams of powdered sample were used for each measurement.
RESULTS AND DISCUSSION
Fig. 3 shows the XRD pattern of the stalagmite sample of this work and the pure standard calcite. The result of XRD was analyzed using computer software and compared with the standard spectrum of calcite cataloged by JCPDS (Joint Committee
Powder Diffraction Standards). The XRD spectra
show that all the peaks are of calcite.
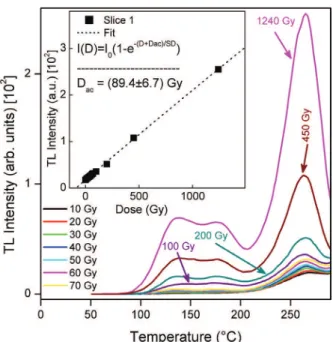
Fig. 4 shows the glow curves corresponding to
the TL from a natural sample and the artificial TL
following gamma irradiation with dose from 10 Gy up to 1240 Gy for the slice 1. The sample exhibits three TL peaks, one around 125 °C, other at 180 °C and another broad peak centered at 265 °C. This last peak has been used to obtain Dac-values
by additive method. The inset of Fig. 4 shows the increase in the intensity of the 265 °C TL peak with
γ dose for the slice 1.
For the determination of the accumulated dose by additive method, the dose-response curves of the TL peak and the EPR signal of the samples were fitted using an exponential function. This
fitting function is:
(1)
where I is the measured TL or EPR intensity, D is the gamma dose, I0 is the saturation intensity, SD is the saturation dose and Dac is the accumulated dose. An accumulated dose of 89.4 ± 6.7 Gy has been obtained from the TL dose response curve (inset of Fig. 4). Similar measurements yield Dac -values for slice 2 and 3, as well as for the central part of the stalagmite from the other end.
The room temperature EPR signal of irradiated stalagmite (Dose: 600 Gy) is shown in Fig. 5.
Figure 3 - The powder X-ray diffraction of stalagmite sample.
Figure 4 - TL glow curves of stalagmite samples plus additional
gamma-doses up to 1420 Gy. Inset of the figure shows the TL
Three distinct centers could be identified which are
labeled as center I, center II and center III. Center I is the CO-2 ion with principal g-values: g1 = 2.0028,
g2 = 2.0020 and g3 = 1.9973. The natural and irradiated EPR spectra of the samples labeled as 1, 2 and 3 were found to be similar. The EPR signal of the calcite crystal at g = 1.9973 is most suitable signal for dating due to radiation-sensitive, stable over geological times and gives more realistic age estimates (Ikeya 1993, Barabas et al. 1992, Engin et al. 1999, Smith et al. 1985). The EPR signal of CO
-2
ion was used in the present dating experiments. Fig. 6 shows the behavior of the intensity of the EPR signal at g =1.9973 as a function of gamma dose. Applying the additive method, the accumulated dose Dac was estimated to be about
95±9 Gy for slice 1, comparable to the value obtained by TL measurements. The determined Dac for another two samples are given in Table I.
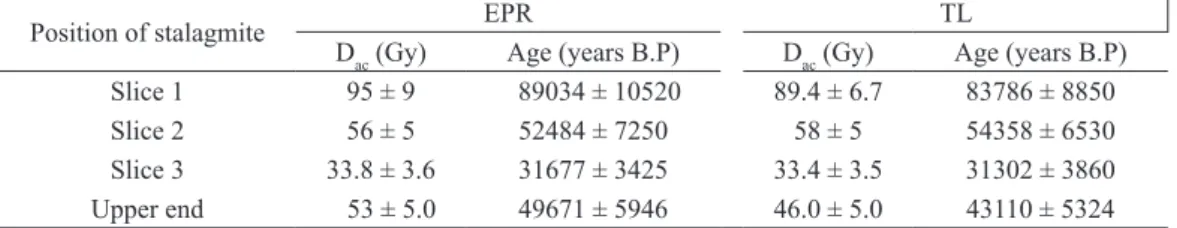
Table I shows the Dan and the age of the stalag-mite sample obtained by TL and EPR techniques respectively. The annual dose rate determination
was carried out by measuring the concentrations of
238U, 232Th and 40K in the stalagmite using the INAA
method. The concentration of the uranium, thorium
and potassium did not significantly change from
center and the external layer of the studied
stalag-mite materials. The calculated annual dose rate Dan = 1.067 ± 0.107 mGy. The dose of cosmic rays can
also be assumed to be negligible in underground environments like caves.
Figure 6 - EPR intensity versus gamma dose of the EPR signal at g = 1.9973 due to CO-2.
Figure 5 - Room temperature EPR spectrum of irradiated stalagmite (Dose: 600 Gy).
TABLE I
The accumulated dose (Dac) and ages (by EPR and TL dating) of four position of the stalagmite.
Position of stalagmite EPR TL
Dac (Gy) Age (years B.P) Dac (Gy) Age (years B.P)
Slice 1 95 ± 9 89034 ± 10520 89.4 ± 6.7 83786 ± 8850
Slice 2 56 ± 5 52484 ± 7250 58 ± 5 54358 ± 6530
Slice 3 33.8 ± 3.6 31677 ± 3425 33.4 ± 3.5 31302 ± 3860
The age of the samples (labeled as slices 1, 2 and 3) obtained by EPR method are comparable to the value obtained by TL measurements. These
results confirm the geological interpretation on the
formation of Devil´s Cave.
CONCLUSIONS
Ages of different positions of stalagmite by EPR
and TL are close to each other within experimental error. The average age of the central part of stalagmite is in the order of 86410 years. The coherence of the dating by TL and EPR techniques and the presence of rings show that this stalagmite can be used as a high-resolution climatic record. The growth rate from lower and to upper end along the axis is about 0.82 cm per 1000 years, a slow process. Horizontally the growth rate is much slower; 0.09 cm per year.
ACKNOWLEDGMENTS
The authors wish to thank Ms. E. Somessari and Mr. C. Gaia, Instituto de Pesquisas Energeticas e Nucleares (IPEN), Brazil, for kindly carrying out the irradiation of the samples. To Fundação de Amparo à Pesquisa do Estado de São Paulo (FAPESP, Process number 2014/03085-0) for
partial financial support and to Coordenação de
Aperfeiçoamento de Pessoal de Nível Superior (CAPES, Process number BEX-9612130) for fellowship to T.K. Gundu Rao.
REFERENCES
AITKEN MJ. 1985. Thermoluminescence Dating. Academic Press, London.
ARAKAWA T AND HORI N. 1989. ESR dating of carbonate speleothem rings and late quaternary climatic changes in the Ryukyu Islands, Japan. Appl Radiat Isotopes 40: 1143-1146.
BARABAS M, BACH A, MUDELSEE M AND MANGINI A. 1992. General properties of the paramagnetic centre at g=2.0006 in carbonates. Quaternary Sci Rev 11: 165-171. BARTOLL J AND IKEYA M. 1997. Dating of Pottery: a Trial.
Appl Radiat Isotopes 48: 981-984.
CORDEIRO BM. 2013. Planalto Carbonático do André Lopes (SP): Geomorfologia Cárstica e Geoespeleologia da Gruta da Tapagem (Caverna do Diabo), Instituto de Geociências, Universidade de São Paulo, Brazil, p. 4.
ENGIN B, GÜVEN O AND KÖKSAL F. 1999. Electron spin resonance age determination of a travertine sample from the southwestern part of Turkey. Appl Radiat Isotopes 51: 689-699.
GASCOYNE M. 1992. Paleoclimate determination from cave calcite deposits. Quaternary Sci Rev 11: 609-632.
GRÜN R. 1989. Electron spin resonance (ESR) dating. Quatern Int 1: 65-109.
IKEYA M. 1980. ESR dating of carbonates at Petralona Cave. Anthropos 7: 143-50.
IKEYA M. 1993. New Applications of Electron Spin Resonance: Dating, Dosimetry and Microscopy. World Scientific, Singapore.
LAURITZEN SE AND LUNDBERG J. 1999. Speleothems and climate: a special issues of the Holocene. Holocene 9: 643-647.
MCKEEVER SWS. 1985. Thermoluminescence of Solids. Cambridge University Press, Cambridge, UK.
SMITH BW, SMART PL AND SYMONS MCR. 1985. ESR signals in a variety of speleothem calcites and their suitability for dating. Nucl Tracks 10: 837-844.