0103 - 5053 $6.00+0.00
Review
*e-mail: [email protected]
A Perspective on Applications of Ligand-Field Analysis: Inspiration from
Electron Paramagnetic Resonance Spectroscopy of Coordination Complexes
of Transition Metal Ions
Joshua Telser
Department of Biological, Chemical and Physical Sciences, Roosevelt University, 430, South Michigan Avenue Chicago, IL 60605-1394, USA
Este artigo descreve de maneira um tanto pessoal, o uso da espectroscopia de ressonância paramagnética eletrônica (EPR), incluindo EPR de alta freqüência e alto campo (HFEPR) para investigar a estrutura eletrônica de complexos de íons de metal de transição. Os parâmetros Hamiltonianos de spin, obtidos a partir de experimentos EPR, matriz g para sistemas com S =1/2 e matrizes g e D (zero-field splitting) para sistemas com S > 1/2 fornecem informações sobre os níveis de energia dos orbitais d. Esta informação pode ser combinada com a teoria do campo ligante (TCL) para fornecer informações a respeito da estrutura eletrônica global de complexos paramagnéticos de metal de transição. Como tem sido discutido por outros autores a TCL ainda se mostra útil para o entendimento quantitativo destes complexos, mesmo com a atual disponibilidade de métodos computacionais avançados, como a teoria do funcional de densidade (DFT). A discussão é ilustrada por exemplos ao longo da série de transição, com configurações dn.
This paper describes in a somewhat personal way an overview of the use of electron paramagnetic resonance (EPR) spectroscopy, including high-frequency and -field EPR (HFEPR) to unravel the electronic structure of transition metal ion complexes. The spin Hamiltonian parameters obtained from EPR experiments, namely the g matrix for systems with S =1/2 and the g and D (zero-field splitting) matrices for systems with S > 1/2 provide information on d orbital energy levels. This information can be combined with ligand-field theory (LFT) to provide information on the overall electronic structure of the paramagnetic transition metal complex. As has been discussed by others, LFT is still useful in providing such a quantitative understanding of these complexes, even in the day of advanced computational methods, such as density functional theory (DFT). The discussion is illustrated by examples across the dn configuration.
Keywords: coordination chemistry, EPR, ligand-field theory, spectroscopy
1. Introduction
Crystal-field theory has its origins in the work of Hans Bethe in the 1920’s.1 This work, along with significant advances by Friedrich Hund and Edward Teller,2 laid the foundation for the understanding of the electronic structure of transition metal ions and molecules. This monumental achievement was never recognized by the Nobel Prize, neither in Chemistry nor in Physics, and with the recent deaths of Hund (in 1997, at age 101), Bethe (in 2005, at age 98) and Teller (in 2003 at age 95), it never will be. Ironically, the impetus for CFT and LFT began with systems lacking any ligands whatsoever, namely gas phase atoms and ions.3 The classic text by Condon and Shortley
summarizes this work. It never fails to astound the author that this text was written in 1935, a time when the theories and experiments so thoroughly analyzed therein were so recent (the 1963 edition is now recommended).4
The author of this perspective came of age circa 1980, at which time crystal-field theory (CFT) and ligand-field theory (LFT) were well established, but not emphasized in graduate education in the USA as strongly as in previous decades. For example, the angular overlap
model (AOM), developed by Schäffer,5 was never
addition, particularly for formal instructional purposes, there was the classic text on “Chemical Applications of
Group Theory” by Cotton10 and the very valuable
reference on all types of spectroscopy related to inorganic chemistry by Drago.11 In the area of electron para-magnetic resonance (EPR), the monumental text, indeed “Bible”, by Abragam and Bleaney provides extensive treatments of these theories and their application to transition metal ion EPR. The reprinting of this text by Dover Publications12 was a spectacular service to the EPR community. Also very useful for EPR of high-spin inorganic systems, albeit mainly of rather exotic molecules (i.e, matrix isolated metal clusters) is the text by Weltner;13 another Dover publication. More recently available is the text by Pilbrow, also on transition metal ion EPR.14 Numerous texts are available on the EPR techniques, as opposed to inorganic aspects of EPR, and among these the more recent text by Weil et al.,15 and the older text by Gordy,16 are most useful, particularly for understanding hyperfine interactions. This list is by no means comprehensive, it merely indicates those texts that the author has used over the years.
What then is the situation now, more than 25 years after the author began his modest involvement in this area? There has been an explosion in the availability of computing power, in terms of ready access, high speed, enormous memory, and low cost. This hardware advance would be of little significance were it not for the brilliant insight and hard programming work of theoreticians, such as the late Sir John A. Pople and Walter Kohn, whose work was indeed recognized by the Nobel Prize (Chemistry 1998). As a result of the pioneering efforts by Pople and many others, it is now possible to perform high-level molecular orbital calculations on reasonably large molecules in a very short time. Kohn and many others developed density functional theory (DFT), which is now the method of choice for computations involving transition metal complexes. Among younger chemists today, Frank Neese in Germany is the leading exemplar of the applications of DFT to understanding such systems,17,18 and is the author of his own highly developed DFT
program, ORCA.19 Michael T. Green and Thomas C.
Brunold in the USA, and Abhik Ghosh in Norway have also made significant advances in bioinorganic and
inorganic chemistry with use of DFT studies,20-22
particularly in combination with optical spectroscopy as practiced in the Brunold laboratory.21 As with the books listed above, the mention of these workers is not meant in any way to be comprehensive, but merely to provide examples of those whose work is directly relevant to the author’s interests, as well as being of the highest quality.
What then has happened to CFT and LFT is this era of DFT (and MO) software that can be run in a matter of minutes on a workstation or even microcomputer (PC)? Is there any need for theory that saw its apex in the 1960’s? As already pointed out in a recent article by Gatteschi and co-workers in Florence, Italy,23 there is a place for LFT today. Their basis for this opinion is high-field and frequency EPR (HFEPR) studies done by them in collaboration with Anne-Laure Barra and others in Grenoble, France.24 Another locus of these older theories is the place where they were brought into full flower, Copenhagen, Denmark. The work by Jesper Bendix25-27 and Høgni Weihe28 and their co-workers in Copenhagen, together with Philip L. W. Tregenna-Piggott in Switzerland,29-37 represent superb examples of state-of-the-art experimental (not only HFEPR, but also optical and vibrational spectroscopy, and most significantly, inelastic neutron scattering (INS)31) and computational studies. In particular, Bendix has directly compared LFT to the current luminary, DFT.26,27 The author fully concurs with that opinion that the older theories, CFT and LFT, still have their place in understanding the electronic structure of transition metal complexes, in particular in rationalizing electronic absorption/emission spectra. The use of LFT for rationalizing EPR spectra will be described in the perspective. Concerning the modern, as opposed to classical approach, the reader is enthusiastically referred to the recent (partially) thematic issue of the Journal of Biological Inorganic Chemistry (JBIC) on the application of DFT to bioinorganic chemistry, which includes insightful articles by Neese38 and by Ghosh,39 among others (Siegbahn40 and Noodleman41). These articles highlight the fact that DFT is not the “be all and end all” in understanding transition metal systems, but that DFT is best primarily for rationalizing molecular geometry (i.e, a ground state property) and not as successful with phenomena involving excited states.
2. Experimental Sets
The complexes used to illustrate EPR spectra were all either obtained from commercial sources or synthesized by literature procedures. Experimental conditions are given in the figure captions. EPR spectra at 9.0 – 9.7 GHz
(X-band) and at 34 – 36 GHz (Ka-band, often, but
erroneously, referred to as Q-band) were recorded on modified Varian spectrometers at Northwestern University, Evanston, IL, USA. HFEPR spectra were recorded on locally-constructed spectrometers at the NHMFL, Tallahassee, FL, USA.
All computer programs for EPR simulation (DDPOWH) and ligand field analysis (DSOXF, DDN package) are written in FORTRAN (g77) and are available from the author.
3. Results and Discussion
Optical spectroscopy, both absorption and emission, provided the original basis for CFT and LFT. The text by Lever is strongly recommended for this area.44 However, EPR soon came on the scene (in full flower by the early 1950’s)45 and by the 1960’s was a well established technique in terms of applicability towards understanding the electronic structure of transition metal ions and their complexes. In this regard, the texts by Abragam and Bleaney12 and by Griffith,8 both mentioned above, are most relevant, as is a classic review by McGarvey.46 The greatest applicability of EPR to transition metal systems is to those with only one unpaired electron, S = 1/2, namely, d1,9. The hole formalism allows concurrent treatment of d10–n configurations with dn. These systems have only one free-ion term: 2D, with only 10 microstates: in a weak-field representation these are: |ml, ms〉 = |±2, ±1/2〉, |±1, ±1/2〉, |0, ±1/2〉; in a strong-field representation, these are dxz±, d
yz ±, d
xy ±, d
x2-y2 ±, d
z2
±. Each of these formalisms will
be used here interchangeably, along with the strong-field formalisms, t2nem (for octahedral, point group O) or emt
2 n (for
tetrahedral, point group T), both with 1 ≤m≤ 4, 1 ≤n≤ 6. In the case of d1,9, there is no fine structure (zero-field splitting (ZFS), see below) so the main parameters obtainable from the spin Hamiltonian are the principal values of the g matrix, directly obtained from an EPR spectrum, with spin Hamiltonian, H = βe B.g.S, where the external magnetic field (vector) is B (to conform with SI units, tesla (T); alternatively (formerly) H, to conform with cgs units, gauss (G)).47 These components of g contain information on the ligand-field of the metal ion. The contribution of orbital angular momentum to spin angular momentum shifts the g values away from the free electron value, ge = 2.00. The extent of the shift from ge (negative for dn, n < 5 and positive for dn, n > 5) is directly
proportional to the spin-orbit coupling constant. This constant is given by ζ (often as ξ), which is the single electron spin-orbit coupling constant, with Hamiltonian, HSO = Σiζi(li⋅si), or is given as λ, which is the multi-electron analog, with Hamiltonian, HSO = λ(L⋅S). For d
1,9, the
relation between the two is given by λ = ζ/2S, so λ = ζ, but for other dn systems, the scaling by 2S between the two constants is valid only for terms with the same spin multiplicity as the free-ion ground state. The effect of the external magnetic field is given by the electronic Zeeman Hamiltonian, Hz = βeΣiB⋅(kli + gesi), or in a multi-electron basis set, βeB⋅(kL + g
eS), where k is the Stevens orbital reduction parameter (which can be anisotropic). The shift in g values also is inversely proportional to the energy separation among the various d orbitals, connected via the spin-orbit coupling operator. The relevant perturbation theory equations are found in many sources,8,11,12 but for completeness are given below for both d1 (e.g., VO2+, tetragonally compressed, dxy1,) and d9 (e.g., CuII, tetragonally elongated, dxz,yz4d
xy 2d
z2 2d
x2-y2
1), respectively:
gz = ge – 8ζ/(Ex2-y2 – Exy); ge + 8ζ/(Exy – Ex2-y2) (1a, a’)
g
x = ge – 2ζ/(Exz – Exy); ge + 2ζ/(Exz – Ex2-y2) (1b, b’)
gy = ge – 2ζ/(Eyz – Exy); ge + 2ζ/(Eyz – Ex2-y2) (1c, c’)
The classic example for CuII (3d9) is this ion in a tetrapyrrole, where g|| (gz) ≈2.20(5) and g (gxy) ≈2.05(5). In such a case, the parallel (z) direction is normal to the tetrapyrrole plane (i.e., along the C4 axis of a porphyrin with D4h point group symmetry) and the perpendicular direction (x, y) is in the tetrapyrrole plane. The orientation within the tetrapyrrole plane of gx,y is not at all obvious due to in-plane
π-bonding effects. The g matrix orientation in d1,9 systems has been studied by Hitchman and co-workers.48,49
In the case of CuII, hyperfine coupling at g
|| (A||) is also often observed and the correlation of g|| and A|| can provide qualitative information on the donor atoms in the inner coordination sphere of CuII, as shown by Blumberg and Peisach,50 as well as quantitative information on spin distribution, as shown e.g., by Brown and Hoffman for CuTPP (TPP = dianion of 5,10,15,20-tetraphenyl-porphine), which also involved the precise measurement of porphryin 1H and 14N hyperfine coupling by ENDOR.51,52 For illustration, we show in Figure 1 the EPR spectrum recorded at 35 GHz and 2 K of the complex Cu(OEP) (OEP = dianion of 2,3,7,8,12,13,17,18-octaethylporphine) in 2-methyltetrahydrofuran (2-Me-THF) solution. The spectrum yields g|| = 2.182, g⊥ = 2.0378, representative of the unpaired electron in the dx2-y2 orbital (2B
group symmetry). Hyperfine coupling from both 63,65Cu (I = 3/2, 96.2%, 30.8%, respectively) and the four equivalent tetrapyrrole 14N ligands (“superhyperfine coupling” – a distasteful term to be avoided) is also observable. These equatorial ligands are relatively strongly coupled (A(14N) ≈40 MHz, by EPR simulation; see also Brown and Hoffman51) to the equatorial d
x2-y2 1 spin.
Equations 1 are quite useful for the commonly found tetragonal geometry, but for other coordination environ-ments, it is useful to employ a full matrix treatment with a strong-field representation and specific orbital energy levels or with a weak-field basis set and the AOM. The latter method is achieved with use of the superb program Ligfield, written by Jesper Bendix,53 or the less sophisticated program DDN, by the author. Other highly regarded and widely programs are AOMX,54 by Heribert
Adamsky and CAMMAG,55 by Malcolm Gerloch. The
author has never made use of these himself, however, collaborators Stratemeier and Hitchman have.56 As an example of this type of calculation for a d9 system, use of the program DDN with the following crystal-field parameters (in cm–1): Dq = 2500, Ds = 2500, Dt = 2000, which crudely represent porphyrin coordination,57 with spin-orbit coupling constant ζ = -600 cm–1, yields (with an external magnetic field typical for X-band EPR) g|| = 2.19, g⊥ = 2.05; values in good agreement with those observed for CuII porphyrins.58
Transition metal ions that have other than d1,9 electronic configurations represent more complex situations due to the large number of possible electronic configurations (microstates). In many cases, however, the electronic ground state is a spin doublet, so that the same spin Hamiltonian applicable to true S = 1/2 systems can also be employed. The most relevant cases are low-spin (LS) d7 and LS d5. For LS d7, the quartet terms that are lower energy in the free-ion or high-spin (HS) state are now higher in energy and the doublet terms are lower in energy. As described elsewhere,14 the g values observed for LS d7 can also provide information on the d orbital energies. The relevant equations for tetragonally elongated LS d7 (d
xz,yz 4d
xy 2d
z2
1; a strong field
representation) are given below:
gz = ge (2a)
gx = ge + 6ζ/(Eyz – Ez2) (2b)
g
y = ge + 6ζ/(Exz – Ez2) (2c)
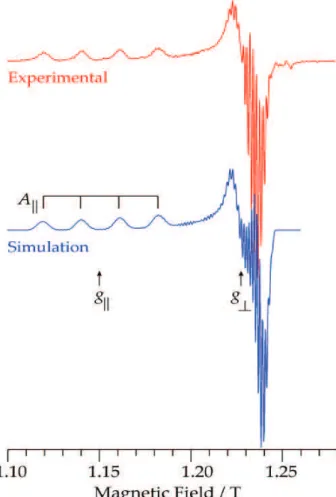
The best examples of LS d7 are complexes of CoII with strong-field ligands (e.g., tetrapyrroles, as always) and of NiIII. The detailed EPR and ENDOR studies by the late Arthur Schweiger and co-workers on CoII tetrapyrroles and corrins are especially instructive.59,60 Rather than displaying a LS CoII EPR spectrum here (e.g., tetrapyrrole), which is complicated by cobalt hyperfine splitting (59Co, I = 7/2, 100%), we illustrate the analogous EPR spectrum for LS NiIII. Figure 2 presents the EPR spectrum recorded at 35 GHz and 2 K of the complex [Ni(cyclam)]3+ (cyclam = 1,4,8,11-tetraazacyclotetradecane) prepared from the NiII analogue, [Ni(cyclam)]Cl2, in aqueous solution by oxidation with potassium peroxidisulfate.61 The spectrum yields g
|| = 2.0218, g⊥ = 2.220, representative of the unpaired electron in the dz2 orbital (2A
1g in D4h point group symmetry; dx2-y2 orbital unoccupied, LUMO). In contrast to Figure 1, no hyperfine splitting is apparent. Natural abundance nickel comprises predominantly zero-spin nuclei (the exception is 61Ni, I = 3/2, 1.13%), in contrast to both copper and cobalt. In further contrast to Cu(OEP) (Figure 1), the equatorial
Figure 1. EPR spectrum of Cu(OEP) in frozen 2-Me-THF solution (~1 mmol L-1): experimental numerical derivative (red, upper trace) and its
simulation (blue, lower trace). Experimental parameters: temperature, 2 K; microwave frequency, 35.145 GHz; microwave power, 20 µW; 100 kHz modulation amplitude, 0.2 mT; time constant, 128 ms; scan time, 4 min. Simulation parameters: S = 1/2; g = [2.0378, 2.0378, 2.182]; A(63Cu)
= [114, 114, 630] MHz, A(14N) = [42, 42, 50] MHz; Gaussian
nitrogen ligands are only very weakly coupled (A(14N) < 5 MHz, estimated by ENDOR; see also van Doorslaer and co-workers59,60 for CoII) to the axial d
z2 1 spin.
LS d5 is best exemplified by FeIII with strong-field ligands (e.g., tetrapyrroles yet again, but also with strong axial ligands), and also by complexes of the other Group 8 ions, RuIII 25,62 and OsIII.63 The electronic configuration d5 has the largest number of microstates (252) and the most complicated electronic energy levels for the free-ion.
The LS d5 state (t 2
5 configuration) might seem to elude
this complication and be as easily understood as d9 is. This is not so. As recently discussed by Slep and co-workers,63 the best approach for analyzing magnetic or EPR data even for such an S = 1/2 system is by a complete ligand-field analysis using the entire d5 basis set.
Nevertheless, it is possible to analyze LS d5 with use of methods analogous to those for simpler S =1/2 systems. Griffith8 describes EPR spectroscopy of LS d5 (p363-366,
12.4.10) and his work is commonly referred to. A more recent, and in the opinion of this author, the most definitive description of the EPR situation that obtains for LS d5 is given by McGarvey in two highly readable reviews.64,65 The many pitfalls of extracting electronic configuration from the observed g values, such as their assignment to gx, gy, gz, are clearly explained in these papers. We will reproduce one such set of equations from one of McGarvey’s papers, namely for tetragonally distorted LS d5, with the real d orbital basis set. This example corresponds most closely to those given above for d1,9 and other cases described below. The g values are as follows:65
gz = 2[A2 – C2 – B2 – 2kBC] (3a)
gx = 2[B2 – A2 – C2 – 2kAC] (3b)
g y = 2[C
2 – B2 – A2 – 2kAB] (3c)
where k is the Stevens orbital reduction factor (assumed equal to 1 for the examples below; this factor can effect shifts of observed g from 2.0, even in cubic symmetry), and A, B, C, are the wavefunction coefficients (A2 + B2 + C2≡ 1) of the ground state Kramers doublet, ψ
±, as follows:
ψ± = A|dxz+d xz
–d yz
+d yz
–d xy
±〉 +
B|dxz+d xz
–d xy
+d xy
–d yz
−+ 〉 ±
iC|dyz+d yz
–d xy
+d xy
–d xz
−+ 〉 (4)
For an octahedral system, A = B = C = , so all of the calculated g values equal –2 (note that (g2)1/2 is usually what is experimentally determined, so this negative sign is not apparent).
Any distortion from this idealized symmetry, and the EPR situation can rapidly change. The consequences of equations 3 and 4 are shown graphically in Figure 3, which displays the observed g values (i.e., (g2)1/2) as a function of the wavefunction coefficient A2 for varying degrees of rhombic distortion. For a large tetragonal distortion (elongation), the orbital singlet dxy is highest in energy and contains the electron “hole”. Thus, A2≈ 1, B = C≈ 0, and the (observed) g values are again equal to 2 (although the actual signs of g|| and g⊥ are opposite). This situation corresponds to the rightmost side of Figure 3. For a large compression, with no rhombic distortion, then the orbital doublet dxzdyz is highest in energy and contains the hole, so that: A≈ 0, B2 = C2≈ 1/2, so the calculated g values are g
z = –4, gx = gy = 0. This situation corresponds to the leftmost side of Figure 3. Rhombic splitting (i.e., B2≠C2) can lead to widely divergent g values, as shown in Figure 3 for several levels of this effect.
Figure 2. EPR spectrum of [Ni(cyclam)]3+ (chloride anion) in frozen
aque-ous solution (~0.5 mmol L-1): experimental numerical derivative (red,
For an experimental illustration of an approximation of this system, we show in Figure 4 the EPR spectrum recorded at 35 GHz and 2 K of the complex [Fe(CN)6]3– as its tetraphenylphosphonium salt in acetonitrile/toluene (2:1 v/v) solution (compound kindly provided by Prof. Leo Slep, University of Buenos Aires, Argentina). The spectrum is not easily interpretable as the lines are very broad and featureless and the lowest g value lies well beyond the magnetic field maximum. This is the result of A2 → 0, which leads to g
x,y → 0, as mentioned above. EPR at conventional frequencies (X-band (~9 GHz) and Ka-band (35 GHz, commonly, but incorrectly referred to as Q-band), but at high magnetic fields (as much as 25 T, see below) is potentially very applicable to such systems. For a quantitative example, Griffith gives for [Fe(CN)6]3– doped into diamagnetic [Co(CN)6]3–, g
x = 2.35, gy = 2.10, gz = 0.915.8 Comparison with Figure 3 shows that this case roughly corresponds to A2 ≈ 0.52, which gives g
z≈ 0.9, with 2.1 < gy < 2.4 and 2.4 < gx < 2.7 (a better match could obtain with k < 1, appropriate for the highly covalent Fe-CN bonds). The electron hole is thus delocalized among the three t2 orbitals, but primarily in d
xy. This indicates that the complex is significantly distorted from octahedral geometry, which might be the result both of crystal packing effects involving the cations (particularly relevant for a highly charged complex such as hexacyano-ferrate/cobaltate) and Jahn-Teller distortion of the t25
manifold. It must be emphasized that the g matrix principal component designations x, y, z are not meant to imply a particular geometry. Indeed, in a homoleptic complex such as [Fe(CN)6]3–, it is not possible to relate these easily to molecular structure. Even in a heteroleptic LS d5 complex (e.g., [Ru(NH3)5L]3+, where L is a variety of imino ligands), the directions of the g matrix components can be very different from what might be expected based on the molecular structure, as a consequence of π-bonding and other complicated effects.62,64,65
We next turn to transition metal systems that have more than one unpaired electron and are in HS ground states, in contrast to the LS d7 and d5 cases mentioned above. The first of these is “HS” d8 (the quotation marks because the “LS” form is not really appropriate for octahedral symmetry, but for square planar). In such a system, the contribution of orbital angular momentum not only shifts the g values, but can also remove the zero-field degeneracy of the MS levels: zero-field splitting (ZFS).66 In its simplest form, this effect is represented in the spin Hamiltonian by S·D·S (Dy + Dx + Dz≡ 0), which for S = 1 and D > 0 and axial (Dy≡Dx≠ Dz; E = 0), gives |S, MS〉 = |1, ±1〉 at D above |1, 0〉.12 The application of a magnetic field leads to
Figure 3. Graphical representation of EPR results for a tetragonally dis-torted LS d5 complex. The abscissa gives the wavefunction coefficient
for the electron “hole” in the dxy orbital (0 ≤A
2≤ 1; see equation 6). The
ordinate gives observed g values: gx (blue lines), gy (red lines), gz (black lines), calculated from equations 5. Three different cases of rhombic dis-tortion are given (all subject to A2 + B2 + C2 = 1): B2/C2 = 1.05, 1.40 (both
as solid lines; representing modest rhombic distortion: respectively cor-responding to ~51% and ~58% hole in dyz when A
2 = 0), and 3.0 (dashed
line; representing large rhombic distortion: corresponding to 75% hole in dyz when A
2 = 0). The vertical dotted line corresponds approximately to
the wavefunction that yields the g values reported8 for [Fe(CN) 6]
3– doped
into [Co(CN)6]3–.
Figure 4. EPR spectrum of [Fe(CN)6]
3– (tetraphenylphosphonium
cation) in frozen acetonitrile/toluene (2:1 v/v) solution (~1 mmol L-1):
the combination of ZFS with the electronic Zeeman (βeS·g·B) effect to give an energy level diagram as shown in Figure 5. The situation in Figure 5 is appropriate where the orbital angular momentum contribution is different along one molecular principal direction from the other two. It is also possible, and indeed quite common, that all three canonical directions are inequivalent (Dy≠Dx≠Dz; E≠0) and in that case, there are three zero-field energy levels. Application of a magnetic field gives the energy level diagram as shown in Figure 6.
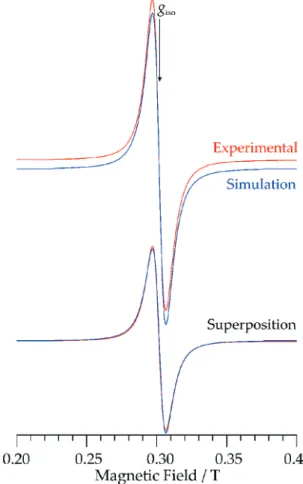
It is still possible, however, to have a transition metal S = 1 system in which the effects of orbital angular momentum are isotropic, so that D = 0 (Dy≡ Dx≡Dz). Figure 7 presents such a case, namely the X-band EPR spectrum at 77 K for [Ni(NH3)6]2+ (here as the chloride salt in frozen ammonia solution). In this complex, the
ammine ligands are pure σ-donors, in contrast to the complicated, anisotropic π-bonding that is found for aqua ligands, which leads to extensive ZFS for nominally octahedral, HS hexaaqua complexes.32-34 In addition, the octahedral d8 electronic configuration (3T
1g ground state, t2
6e2) has no proclivity towards
Jahn-Teller distortion, in contrast particularly to e.g., d9 (t 2
6e3)
or LS d7 (t 2
6e1) (or even four-coordinate d8: e4t 2
4). Thus,
hexaamminenickelII has a truly octahedral (cubic) environment about the metal ion and a resulting absence of ZFS. Orbital effects are not wholly absent, as the observed g value is uniformly shifted to giso = 2.126 (> 2.00, for this > half-filled, “hole”, configuration). Use of the program DDN with the appropriate bonding parameter (εσ = 3600 cm–1 for NH
3 in [Ni(NH3)6] 2+),6
free-ion values for single-electron spin-orbit coupling and Racah interelectronic parameters (respectively,
Figure 5. Energy level diagram for S = 1 system with axial ZFS, D = 10 cm–1, as a function of external magnetic field applied along the
perpen-dicular (green traces, ⊥ ≡x, y) and parallel (black traces, || ≡z) directions. The |S, MS〉 states are indicated in the zero-field and high-field cases (left and right edges, respectively). Arrows indicate the microwave quantum for X-band (~0.3 cm–1), W-band (~1 cm–1) and 330 GHz (11 cm–1),
typi-cal for HFEPR. Only with the last of these is a magnetic dipole allowed transition possible at an accessible magnetic field.
Figure 6. Energy level diagram for S = 1 system with rhombic ZFS, D = 10 cm–1, E = 2 cm–1, as a function of external magnetic field applied along
the x (blue traces), y (red traces), and z (black traces) directions. The |S, MS〉 states are indicated in both the zero-field and high-field cases (left
and right edges, respectively). Arrows indicate the microwave quantum for X-band (~0.3 cm–1), W-band (~1 cm–1) and 330 GHz (11 cm–1),
typi-cal for HFEPR. As in the axial case (Figure 5), only with the last of these is a magnetic dipole allowed transition possible at an accessible mag-netic field.
Figure 7. EPR spectrum of [Ni(NH3)6]2+ (chloride anion) in frozen
ζ = -630 cm–1; B = 810 cm–1 (C = 4.7B)6), and an external field typical of X-band EPR, yields isotropic g = 2.223. This discrepancy of < 5% could be improved upon if an orbital reduction factor (k < 1) and/or reduction in ζ, both due to covalency, were introduced. The calculation of g values in the above case is simple because of cubic symmetry that leads to linear field dependence. When ZFS occurs as a result of lower symmetry, then the intrinsic g values can be calculated by combining the spin Hamiltonian matrix with the results of a ligand-field analysis, as follows:
gz = [(E3z – E2z)2 – (2E)2]1/2/(2βB
z) (5a)
gx = [(E3x – E1x)2 – (D + E)2]1/2/(2βB
x) (5b)
gy = [(E3y – E1y)2 – (D – E)2]1/2/(2βB
y) (5c)
where the energy levels (eigenvalues) of the lowest spin (spin-orbital, spinor) triplet are designated E1, E2, E3 (in ascending value; these values in zero field are: E1≡ 0, E2 = D – |E| , E3 = D + |E|, for D > 0), with the letter subscript indicating a calculation with the external magnetic field aligned along the molecular, z, x, or y axes, respectively. Generally, the calculation is done over a range of magnetic field values to find the consensus g values that obtain under high field conditions.
NickelII complexes without this especially symmetrical coordination sphere often exhibit ZFS. If the microwave quantum is too small to resonate with magnetic-dipole allowed transitions (see Figures 5 and 6), then the complex is “EPR-silent” (at conventional frequencies (ν≤ 35 GHz) and magnetic fields (B≤ 1.5 T). However, as seen in Figure 7, “HS” NiII is not necessarily “EPR-silent”. Nevertheless,
most “HS” NiII complexes have lower than cubic
symmetry, by virtue of heteroleptic ligation and/or anisotropic ligand bonding, and are “EPR-silent” (“EPR-invisible” is perhaps more realistic). The use of high frequencies (up to 900 GHz, ~30 cm–1), in conjunction with resonant high magnetic fields (up to 25 T) allows observation of EPR spectra from such “EPR-silent” systems. This technique, HFEPR,23,24 has been applied to a variety of NiII complexes, as recently reviewed elsewhere.42
A quantitative analysis of the spin Hamiltonian (D and g matrices) parameters for a lower symmetry S = 1 system, such as found in “EPR-silent” 6-coordinate complexes of VIII (3d2, t
2
2) requires a complete
ligand-field treatment with use of the AOM and a d2,8 electronic
basis set.67 Tregenna-Piggot and co-workers have
beautifully demonstrated the application of HFEPR
(and other experimental techniques) in conjunction with ligand-field theory (AOM) to [V(H2O)6]3+,29,30,33,34 and to another homoleptic VIII complex, [V(urea)
6] 3+.37 In
these systems, there are only oxygen donor atoms, and the spin-orbit contribution from these ligands is negligible.
An analog to a six-coordinate (idealized Oh symmetry) VIII complex is a four-coordinate NiII complex (idealized Td symmetry). Complexes of general formula Ni(PPh3)2X2 (X = Cl, Br, I) have been studied experimentally by HFEPR and magnetic measurements, as well as earlier electronic absorption studies, and analyzed by the AOM and a d8 electronic basis set.56 However, this method is effective only when the ligands are relatively light donor atoms (n ≤ 3, e.g., N, O, F-donors, P, S, Cl-donors). Thus, the AOM analysis was truly successful only in charac-terizing the electronic structure of Ni(PPh3)2Cl2.56, 68 If the same bonding parameters for the PPh3 ligand derived for the chloride complex is used in the bromide and iodide complexes, along with appropriately scaled parameters for the halo ligands, then the calculated magnitude of D for the bromide complex is too large and for the iodide complex is too small.58 More important, the sign of D in the Br and I complexes is opposite that that for Cl, despite the close similarity in structural and coordination chemistry among this series. The discrepancy in ZFS is the consequence of effects of spin-orbit coupling from the ligands, which can be dominant for n ≥ 4 donor atoms (As, Se, Br; Te, I-donors). This effect can counteract that from the metal ion, even to point of reversing the sign of D, as shown for an MnIII complex with iodo ligands,28 Thus for Ni(PPh3)2Br2, spin-orbit coupling from Br is roughly equivalent to that from Ni so that the effectiveζ
for Ni (which is not physically meaningful) must be very small (and the opposite sign) and for Ni(PPh3)2I2, spin-orbit coupling from I is dominant over that from Ni so that the effective ζ for Ni must be very large (and also the opposite sign). A more quantitative model for this effect is in progress.69 Lest the reader be dismayed, we note that most paramagnetic ions amenable to study by EPR and analysis by LFT are first row transition ions that have only light donor atoms (2s22pn: N, O, F), where the 3dn basis set is generally sufficient (except for potentially radical ligands such as NO). For donor atoms of the next period (3s2 3pn: P, S, Cl), the 3dn basis set is usually adequate, but caution is advised. In such systems, the use of DFT at determining spin distribution is admittedly an important companion to LFT.
(3d3, t 2
3) (rather than the better known ion, CrIII) and
4-coordinate (idealized Td symmetry) CoII (HS 3d7, e4t 2
3),
each of which has a 4A
2 ground state. The complex [V(H2O)6]2+ has a small ZFS, presumably arising from anisotropy in the aqua ligands, as described for other high-spin ions by Tregenna-Piggott.30,32-34 In these cases, a trigonal splitting results, which for VII as a dopant in corundum (Al2O3) gives D = –0.16 cm–1.70 Figure 8 displays EPR spectra for [V(H2O)6]2+ at multiple frequencies. It is possible, even at X-band, to observe the outer, broader, fine structure transitions (〈±3/2| ↔〈±1/2|), in addition to the sharp, central transition (〈±1/2| ↔ 〈+– 1/2|). Assuming that only the
perpendicular transitions are observed, the separation of the outer peaks (~0.5 T ) gives 2|D| ≈ 0.20 cm-1 spectra for frozen solution [V(H2O)6]2+ as in the oxide lattice.
These spin Hamiltonian parameters can be analyzed by second-order perturbation theory to provide infor-mation on the electronic energy levels as follows:12
g
z (g||) = ge – 8λ/Δ0 (6a)
gx,y (g⊥) = ge – 8λ/Δ1 (6b)
D = 4λ2(1/Δ
1 – 1/Δ0) (6c)
where λ= ζ/3 (ζ is the single-electron spin-orbit coupling constant) and Δ0,1 are the energy separations between the orbital singlet ground state (4A
2g(
4F) in O
h) and the first excited state orbital triplet (4T
2g( 4F) in O
h).
71 These equations
give the result that in octahedral symmetry, Δ1 = Δ0, and the g value is isotropic, albeit shifted below ge, and there is no ZFS (D = 0). However, with tetragonal distortion, Δ1≠ Δ0, where Δ0 is the energy separation between the ground state (4B
1g in D4h) and the orbital singlet excited state ( 4B
2g in D4h) and Δ1 is the energy separation between this ground state and the orbital doublet excited state (4E
g in D4h), both of which originating in the lowest excited orbital triplet state (4T
2g). This method does not include coupling to the next highest orbital triplet excited state (4T
1g(
4F) in O h), which splits into 4A
2g and 4E
g in D4h. Nor is coupling to states arising from free-ion 4P and from spin doublets included. With trigonal distortion, coupling from states derived from 4T
1g(
4F) can be significant and an exact
calculation involving all of the states derived from 4F is minimally necessary. Analysis with use of the complete d3 basis set is better still, as is possible with Ligfield or DDN, which also can be used to provide g values (analogous to equations 5, except here there are four energy levels, labeled in ascending order; in zero field, these eigenvalues are E1,2 = -[D2 + 3E2]1/2, E
3,4 = [D
2 + 3E2]1/2):
gz = –(E2z + E3z)/(βHz); gz = (E1z + E4z)/(βHz) (7a, a’)
gx = −(E1x + E3x)/(βHx); gx = (E2x + E4x)/(βHx) (7b, b’)
gy = –(E1y + E3y)/(βHy); gy = (E2y + E4y)/(βHy) (7c, c’)
Note that for the Kramers S = 3/2 system, as opposed to non-Kramers S = 1, there are two equivalent equations by which each g value component can be calculated. A plot of Ei versus field dependence is helpful in assigning eigenvalues, especially when very high fields are employed and there can be levels crossings.
Tetrahedral CoII presents a related situation and has been much more extensively studied by EPR due to its relevance to biological systems.72,73 Conventional EPR spectra of tetrahedral CoII often exhibit very broad lines, as shown in Figure 9, which is of Co(PPh3)2Cl2 in 2-Me-THF frozen solution at 35 GHz. These systems often have very large ZFS, so that they are treated as effective (or ficticious) S’ = 1/2 systems. From the resulting effective g’ values, it is possible to extract the rhombicity (E/D)74 is often indicated and the intrinsic g values, with use of the following equations (here defined so that gx’ < gy’):
gx’ = gx [1 + (1 – 3|E/D|)/(1 + 3(E/D)2)1/2] (8a)
gy’ = gy [1 + (1 + 3|E/D|)/(1 + 3(E/D)2)1/2] (8b)
gz’ = gz [–1 + (2)/(1 + 3(E/D)2)1/2] (8c)
Figure 8. Multi-frequency EPR spectra of [V(H2O)6]2+ (sulfate anion) in
For a perfectly axial system, g⊥’ = 2gx,y ≈ 4.0 and g||’ = 2gz≈ 2.0 results, as expected. Although equations 6 comprise three equations and four unknowns (E/D and the g components), initial use of giso = 2.00 – 2.10 allows rapid convergence on the appropriate estimate for E/D. This method, however, gives no hint as to the magnitude of D. If magnetically active nuclei are suitably hyperfine coupled to the paramagnetic center, then the magnitude of D can be accurately calculated from the pseudonuclear Zeeman effect,12 as determined by ENDOR spectroscopy. An example is the beautiful study by Hoffman and co-workers on fluorometmyoglobin,75 in which the Larmor (nuclear Zeeman) frequency precisely measured for 19F yielded the ZFS of the FeIII ion.76 Absent suitable nuclei, the magnitude of D can be determined by HFEPR or by variable temperature-variable field magnetic circular dichroism VTVH-MCD.77 In the case of HFEPR, fine structure transitions between the two Kramers doublets (〈±3/2| ↔〈±1/2|) can be directly observed,77 which are at energies much too high for observation by conventional EPR (often > 10 cm–1).
The author in collaboration with his superb co-workers in Tallahassee and the noted synthetic chemist Swiatoslaw Trofimenko, have performed HFEPR studies on a wide series of trispyrazolylborate complexes of CoII, with general formula TpCoX, where Tp is the monoanionic, N3 donor “scorpionate” ligand.78 The complexes exhibit rich electronic absorption and MCD spectra and the combination of these data and spin Hamiltonian parameters from HFEPR with a ligand-field analysis will provide a detailed picture of their electronic structure. This analysis is sadly uncompleted at the time of writing. The next electronic configuration is d4,6, which includes systems studied in the pioneering days, a decade ago, of the application of HFEPR to “EPR-silent” systems. In particular, a MnIII tris(β-diketonate) complex was the subject of a complete ligand-field analysis by Barra et al.,79 providing AOM parameters. Many other MnIII complexes have been studied by HFEPR since then.80-83 The d4 configuration will be illustrated here by CrII.
By analogy with the above discussion for d3,
perturbation theory equations are available for d4 (second-order for ZFS parameters; first-(second-order for g values) to relate spin Hamiltonian to electronic energy levels, as follows:12
gz = ge – 8(λ/Δ)cos2δ (9a)
gx = ge – 2(λ/Δ)(cos δ – sin δ)2 (9b)
gy = ge – 2(λ/Δ)(cos δ + sin δ)2 (9c)
D = –3[(λ2/Δ) + ρ)] cos 2δ (9d)
E = – [(λ2/Δ) + ρ)] sin 2δ; E/D = tan 2δ(9e, e’)
where λ is the spin-orbit coupling parameter of the quintet ground term (λ = ζ/4), Δ is the energy separation of the orbital triplet excited state (5T
2g( 5D) in O
h) from the orbital doublet ground state (5E
g(
5D) in O
h). These equations do not explicitly include an axial distortion energy parameter, which removes the orbital degeneracy of 5E
g, to give an orbital singlet ground state. However, this effect is modeled by inclusion of the mixing parameter, δ, so that this ground state is defined by cos δ|2s〉 + sin δ|0〉. Thus, for δ = 0, the ground state is dxz,yz2d
xy 1d
z2 1 (5B
1g in D4h) and for δ = π/2, the ground state is dxz,yz2d
xy 1d
x2-y2 1 (5A
1g in D4h). Concerning the g values, equations 9a - c are similar to Equations 1a - c since for both d4 and d9, there is a hole in the e set of orbitals (t23e1 and t
2
6e1, respectively).
Equations 9 also do not include the effects of spin-orbit coupling to excited triplet states directly. Instead, Equations 9d - e include the effect of spin-spin coupling,
Figure 9. EPR spectrum of Co(PPh3)2Cl2 in frozen 2-Me-THF solution (~2 mmol L-1): experimental numerical derivative (red, upper trace) and
given by the parameter, ρ. Spin-spin coupling is a through-space magnetic interaction between electron spins and for a given 2S+1L term is expressed as:84
HSS = -ρ[(L · S)2 + ½(L · S) – (1/3)L(L + 1)S(S + 1)] (10)
This spin-spin coupling Hamiltonian, HSS, can be included when a single, multiple-electron, i.e., |L, ML, S, MS〉 basis set, as opposed to a multiple, single-electron, i.e., ∑|l, ml, s, ms〉, basis set is used, for which there is currently no method for including spin-spin coupling. The actual amount of true spin-spin coupling in transition metal ions is difficult to determine and is usually ignored. Indeed, dating from a statement on p. 330 in Griffith’s book,8 spin-spin coupling has been dismissed as being too small to be significant (ρ < 0.1 cm–1) and the author has not encountered it in any recent work involving LFT (except as mentioned below for CrII). However, the situation has now changed. Neese has very recently resurrected spin-spin coupling and modified DFT to include this effect and shown its importance in contributing to ZFS.85 Using as an example, Mn(acac)3, Neese showed a contribution to |D| of ~1 cm–1 from spin coupling and from spin-orbit coupling of ~2 cm–1 (it should be noted the experimental ZFS was much larger in magnitude, |D| = 4.5 cm–1, than any values calculated by DFT, regardless of effects included). Presumably, the case of HS d4,6 is the “worst” from the point of view of necessitating consideration of spin-spin coupling, while d2,8 is the “best” in that it is safest to ignore this aggravating complication. The |L, ML, S, MS〉 basis set was used to analyze HFEPR data for a classic d4 system, [Cr(H
2O)6]
2+, in this case in
frozen aqueous solution.86,87 This work employed the program DSOXF, which used only the 5D (L = 2, S = 2) free-ion ground term with multi-electron spin-orbit coupling and electronic Zeeman interaction and a crystal-field Hamiltonian (operators: O40, O
4
4 (tetragonal), O 4
3 (trigonal),
O20 (axial distortion); parameters: Dq, Ds, Dt7). Use of the crystal-field parameters determined by electronic absorption spectroscopy (in cm–1, Dq = 1390, Ds = 1740, Dt = 470) and the free-ion value for spin-orbit coupling (λ = 58 cm–1), yielded a magnitude for D significantly less than observed (–0.77 cm–1 versus –2.20 cm–1, respectively). This discrepancy results from the failure to include the effects of spin-orbit coupling to triplet excited states (t24, 3T
1g in Oh). These effects can be functionally accounted for inclusion of spin-spin coupling (Equation 10), with ρ= 0.42 cm–1, the value reported by Pryce for CrII,84 to yield D = –2.04 cm–1. These effects can also be accounted for by inclusion of an additional term, which depends on the energy separation between the ground state and the relevant spin
triplet (δ), the additional ZFS is parameterized as D’ = λ2 (–4/δ).57 Far better than this perturbation method is to employ the later program DDN, with the full, single-electron d4 basis set with free-ion values for single-electron spin-orbit coupling and Racah interelectronic parameters (respectively, ζ = 236 cm–1; B = 810, C = 3565 cm–16) along with the above crystal-field parameters to obtain D = -1.97 cm–1, a difference of ~10%, which is well within the error of the assumption involved in the choice of electronic parameters for CrII in this case. The g values can be calculated analogously to equations 5 and 7 as follows, with five energy levels in ascending order (in zero field, these energies are E1 = –2(D2 + 3E2)1/2, E
2 = –D – 3|E|, E3 = –D + 3|E|, E4 = 2D, E5 = 2(D2 + 3E2)1/2 (D > 0)):
gz = [(E3z – E2z)2 – (6E)2]1/2/(2βB
z) (11a)
g
x = [(E4x – E2x)
2 – 9(D + E)2]1/2/(2βB
x) (11b)
gy = [(E4y – E2y)2 – 9(D – E)2]1/2/(2βB
y) (11c)
Note that in this more complicated spin system, in contrast to S = 1 and 3/2 (equations 3 and 5, respectively), two of the energy levels (E1, 5) never give useful relationships in terms of determining g values. Even more so than for S = 3/2, for S = 2 it is helpful to plot the eigenvalues as a function of external magnetic field to ensure that the correct pairs of energy levels are selected. The configuration d6 is best represented by the important ion FeII and the reader is directed to the recent work by Tregenna-Piggott and co-workers on this system,88 (and also to their work on CrII 35,36 and MnIII 32) which make use of LFT as well a tour de force analysis of the Jahn-Teller effect in such complexes.
If high frequencies are employed, then there is a shift in gxy’ due to increased mixing in of excited state Kramers doublets. This was beautifully shown in a multi-frequency (1 – 285 GHz) EPR study of metmyoglobin (i.e., HS FeIII in protoporphyrin IX).93 Much more desirable, is the ability to observe directly transitions among the Kramers doublets, e.g., |5/2, -1/2〉→ |5/2, -3/2〉. Such an observation was recently made for β-hematin, which is also a HS FeIII porprhyinic species, by use of frequencies up to 500 GHz. An EPR transition near zero-field directly yielded 2|D| = 11.7 cm–1.92 Note also the use of ENDOR spectroscopy to determine ZFS in HS FeIII heme proteins,75 as mentioned above.
The application of LFT to HS d5 systems is relatively uncommon. Notable is the recent work on FeIII in the enzyme superoxide dismutase (SOD).94 Also of interest is work by Hempel on MnII complexes from thirty years ago, which employed crystal-field parameters,95,96 and the very
detailed and systematic computational study of FeIII (and also FeII and MnIII) which employed the more flexible AOM.97 The lack of spin-allowed optical transitions from the 6A
(1(g)) (i.e, the totally symmetric representation for the appropriate point group) ground state of HS d5 and the absence of first-order spin-orbit coupling in this term means that ZFS is often small and g values are close to ge. Thus these parameters are difficult to correlate with coordination environment.91 The situation today is conducive to more work of this nature given the number of interesting HS d5 metalloprotein systems (e.g., SOD, and the plethora of heme proteins), the availability of techniques such as HFEPR to provide accurate and precise spin Hamiltonian parameters, even for large ZFS,92 and software (e.g., Ligfield) for the necessary analysis.
As an sample calculation, we can employ the crystal-field parameters estimated for a porphyrin (Dq = 2500, Ds = 2500, Dt = 2000 cm–1) combined with Racah and spin-orbit coupling parameters similar to those given by Bencini et al.97 (B = 900, C = 3600, ζ = 350 cm–1, k = 1). The program DDN with the full d5 basis set gives the effective g values: g’⊥ = 5.98, g’|| = 2.00, which correspond quite well to those seen for Fe(TPP)Cl (see Figure 10). The calculated ZFS, D = +3.4 cm–1, is lower in magnitude than is likely the case for FeIII porphyrins (D≥ 5 cm–1),92 but the parameters used here are a very crude estimate. In contrast to the cases of rhombic S = 1, 3/2, 2 (equations 5, 7, 11, respectively), the intrinsic g values are not easily calculated for a rhombic S = 5/2 system, as the eigenvalues even of the zero-field spin Hamiltonian are the very unwieldy roots of cubic equations. However, for an axial system, the zero-field energies are simply: E1,2 ≡ 0, E3,4 = 2D, E5,6 = 6D (D > 0); alternatively (1/4)D, (9/4)D, (25/4)D, which is the case for equations 12 below. Thus for an axial or only slightly rhombic system, such as found for metalloporphyrins, it is possible to calculate the intrinsic g values from the field dependence as follows:
gz = (E2z – E1z)/(βHz); gz = (E4z – E3z)/(3βHx);
gz = (E6z – E5z)/(5βHx) (12a, a’, a”)
gx = -[2(E1x + E3x + E5x) – (35/2)D]/(3βHx); (12b, b’) g
x = [2(E2x + E4x + E6x) – (35/2)D]/(3βHx)
Usually for HS d5, the intrinsic g values are very close to 2.0 and are relatively inconsequential in providing electronic information.
4. Conclusions
Experimental information on the electronic structure of paramagnetic transition metal ions is readily available from
Figure 10. EPR spectrum of Fe(TPP)Cl in frozen toluene solution (~1 mmol L-1): experimental (blue traces) and its simulation (red traces). Both the
a wide variety of techniques: optical spectroscopy including electronic absorption and emission, magnetic resonance including MCD (a combination of optical and magnetic measurements), EPR (especially now at high fields and frequencies), paramagnetic NMR, and other, more specialized techniques such as INS (limited by access to neutron sources) and Mössbauer effect spectroscopy (limited by suitable nuclei, notably 57Fe). What can be done to analyze this potential wealth of information? The latest method is to use DFT, but the older model, LFT, is still useful and has many proponents, who are using LFT to make significant insights into coordination chemistry. DFT is well suited for describing the contributions of non-innocent ligands, but still has difficulties in quantitatively describing electronic spectra and ZFS. Clearly, one should not “throw out the baby with the bath water”, but should use both methods in conjunction. Indeed, as the number of unusual example of coordination chemistry continues to grow, thanks to the efforts of biochemists and bioinorganic chemists, as well as to synthetic chemists, the need for straightforward descriptions of structure and bonding in such systems that LFT can provide is more important than ever.
Acknowledgments
I would like to thank Prof. Brian M. Hoffman, Northwestern University, for allowing me to play a small role in the renaissance of EPR spectroscopy in transition metal chemistry that has to a great extent been the result of his efforts in the area of bioinorganic chemistry. I would also like to thank Dr. Peter E. Doan, Northwestern University, for his help over the years, in particular with the early stages of developing the program DSOXF. Prof. Bruce R. McGarvey, University of Windsor, Ontario, Canada, has been a constant help to me in areas in which my formal education is sorely lacking. Thank to him, I was able to make the first steps towards developing the program DDN. Dr. Jesper Bendix, Ørsted Institute, University of Copenhagen, Denmark, author of the remarkable program Ligfield, is the person without whose patient assistance the program DDN would never have been completed. Lastly, I would like to thank my many colleagues at the NHMFL, Tallahassee, Florida, in particular Drs. Jurek Krzystek and Andrew Ozarowski, who have allowed me to play a small role in the application of HFEPR to inorganic chemistry. I also wish to acknowledge Roosevelt University for financial support of this research over the years. Lastly, I thank the SBQ and the organizers of BMIC XIII for their superb hospitality and the opportunity to write this perspective.
Joshua Telser is a Professor at Roosevelt University (Chemistry Program) in Chicago, USA. His Chemistry background includes Northwestern University, Evanston-IL as USPHS/NIH Postdoctoral Fellow from 1984 to1986. He joint Prof. Brian M. Hoffman as postdoctoral advisor at University of Florida, Gainesville-FL. He received his Ph.D. in Inorganic Chemistry on December 1984 having as thesis advisor Prof. Russell S. Drago (Deceased) at Cornell University, Ithaca-NY. He had A.B. in Chemistry (with distinction) on May 1980. He began his career as Temporary Research Chemist at Photon Processes Group, Amoco Corporation, Naperville-IL from 9/86 to 4/88. From 4/88 to 9/90 he was a Research Investigator at Contrast Media Department, Squibb Institute for Medical Research, New Brunswick-NJ. Then, from 9/90 to 9/95 he became Assistant Professor of Chemistry at Roosevelt University, Chicago- IL and from 9/95 at the present is an Associate Professor of Chemistry in the same University. With a total of around 70 publications, his research interests, in a glance, are Inorganic and Physical Chemistry: Spectroscopic and magnetic properties of transition metal complexes; Bioinorganic chemistry and Magnetic Resonance. He has being invited to seminars and presentations at conferences and institutions in North America, South America, Europe, and Australia. He is a member of ACS and International EPR/ESR Society.
References
1. Bethe, H.; Ann. Phys.-Berlin 1929, 3, 133.
2. In Hungarian his name is Teller Ede; another Hungarian whose work is important in this area, and did receive the Nobel Prize (Physics 1963) is Eugene Wigner, Wigner Jenő in Hungarian. 3. Moore, C. E.; Atomic Energy Levels, National Bureau of
Standards: Washington, DC, 1958; vol. III.
4. Condon, E. U.; Shortley, G. H.; The Theory of Atomic Spectra, Cambridge University Press: Cambridge, UK, 1964. 5. Schäffer, C. E.; Struct. Bond.1968, 5, 68.
6. Figgis, B. N.; Hitchman, M. A.; Ligand Field Theory and its Applications, Wiley-VCH: New York, 2000.
7. Ballhausen, C. J.; Introduction to Ligand Field Theory, McGraw-Hill: New York, 1962.
8. Griffith, J. S.; The Theory of Transition-Metal Ions, Cambridge University Press: Cambridge, UK, 1964.
10. Cotton, F. A.; Chemical Applications of Group Theory, 3rd ed.,
Wiley-Interscience: New York, 1990.
11. Drago, R. S.; Physical Methods for Chemists, 2nd ed., Saunders
College Publishing: Ft. Worth, 1992.
12. Abragam, A.; Bleaney, B.; Electron Paramagnetic Resonance of Transition Ions, Dover Publications: New York, 1986. 13. Weltner Jr., W.; Magnetic Atoms and Molecules, Dover
Publications: New York, 1983.
14. Pilbrow, J. R.; Transition Ion Electron Paramagnetic Resonance, Clarendon Press: Oxford, 1990.
15. Weil, J. A.; Bolton, J. R.; Wertz, J. E.; Electron Paramagnetic Resonance: Elementary Theory and Practical Applications, Wiley: New York, 1994.
16. Gordy, W.; Theory and Applications of Electron Spin Resonance, Wiley: New York, 1980.
17. Sinnecker, S.; Slep, L. D.; Bill, E.; Neese, F.; Inorg. Chem.
2005, 44, 2245.
18. Sinnecker, S.; Rajendran, A.; Klamt, A.; Diedenhofen, M.; Neese, F.; J. Phys. Chem. A2006, 110, 2235.
19. Neese, F.; ORCA, version 2.4.41; MPI Mülheim, Germany, 2005. See the URL: http://ewww.mpi-muelheim.mpg.de/bac/ logins/downloads_en.php
20. Green, M. T.; J. Am. Chem. Soc.2006, 128, 1902.
21. Jackson, T. A.; Brunold, T. C.; Acc. Chem. Res.2004, 37, 461. 22. Ghosh, A.; Acc. Chem. Res.2005, 38, 943.
23. Gatteschi, D.; Sorace, L.; Sessoli, R.; Barra, A.-L.; Appl. Magn. Reson.2001, 21, 299.
24. Barra, A.-L.; Brunel, L.-C.; Gatteschi, D.; Pardi, L.; Sessoli, R.; Acc. Chem. Res.1998, 31, 460.
25. Bendix, J.; Steenberg, P.; Sotofte, I.; Inorg. Chem.2003, 42, 4510.
26. Anthon, C.; Bendix, J.; Schäffer, C. E.; Inorg. Chem.2003, 42, 4088.
27. Anthon, C.; Bendix, J.; Schäffer, C. E.; Inorg. Chem.2004, 43, 7882.
28. Mossin, S.; Weihe, H.; Barra, A.-L.; J. Am. Chem. Soc.2002, 124, 8764.
29. Tregenna-Piggott, P. L. W.; Weihe, H.; Bendix, J.; Barra, A.-L.; Güdel, H.-U.; Inorg. Chem.1999, 38, 5928.
30. Tregenna-Piggott, P. L. W.; Best, S. P.; Güdel, H.-U.; Weihe, H.; Wilson, C. C.; J. Solid State Chem.1999, 145, 460. 31. Basler, R.; Tregenna-Piggott, P. L. W.; Andres, H.; Dobe, C.;
Güdel, H.-U.; Janssen, S.; McIntyre, G. J.; J. Am. Chem. Soc.
2001, 123, 3377.
32. Tregenna-Piggott, P. L. W.; Weihe, H.; Barra, A.-L.; Inorg. Chem.2003, 42, 8504.
33. Tregenna-Piggott, P. L. W.; Carver, G.; Inorg. Chem.2004, 43, 8061.
34. Tregenna-Piggott, P. L. W.; Spichiger, D.; Carver, G.; Frey, B.; Meier, R.; Weihe, H.; Cowan, J. A.; McIntyre, G. J.; Zahn, G.; Barra, A.-L.; Inorg. Chem.2004, 43, 8049.
35. Dobe, C.; Noble, C.; Carver, G.; Tregenna-Piggott, P. L. W.; McIntyre, G. J.; Barra, A.-L.; Neels, A.; Janssen, S.; Juranyi, F.; J. Am. Chem. Soc.2004, 126, 16639.
36. Dobe, C.; Strassle, T.; Juranyi, F.; Tregenna-Piggott, P. L. W.; Inorg. Chem.2006, 45, 5066.
37. Beaulac, R.; Tregenna-Piggott, P. L. W.; Barra, A. L.; Weihe, H.; Luneau, D.; Reber, C.; Inorg. Chem.2006, 45, 3399. 38. Neese, F.; J. Biol. Inorg. Chem.2006, 11, 702.
39. Ghosh, A.; J. Biol. Inorg. Chem.2006, 11, 712. 40. Siegbahn, P. E. M.; J. Biol. Inorg. Chem.2006, 11, 695. 41. Noodleman, L.; Han, W.-G.; J. Biol. Inorg. Chem.2006, 11, 674. 42. Krzystek, J.; Ozarowski, A.; Telser, J.; Coord. Chem. Rev.2006,
250, 2308.
43. Hoffman, B. M.; Acc. Chem. Res.2003, 36, 522.
44. Lever, A. B. P.; Inorganic Electronic Spectroscopy, 2nd ed.;
Elsevier: Amsterdam, 1984.
45. The discovery of NMR by Felix Bloch and co-workers and Edward M. Purcell in 1946 was recognized by the Nobel Prize in Physics in 1952, however, no such recognition for the discovery of EPR in 1944 by E. Zavoisky in Kazan, USSR was ever made.
46. McGarvey, B. R.; Transition Metal Chem., Ser. Advan.1966, 3, 89.
47. The subscript “e” is added to the Bohr magneton, βe = 9.274 ×
10–24 J/T, to distinguish it clearly from the nuclear magneton,
βN = 5.051 × 10⁻²⁷ J/T.
48. Hitchman, M. A.; Olson, C. D.; Belford, R. L.; J. Chem. Phys.
1969, 50, 1195.
49. Hitchman, M. A.; J. Chem. Soc. (A)1970, 1970, 4.
50. Blumberg, W.; Peisach, J.; Arch. Biochem. Biophys.1974, 162, 502.
51. Brown, T. G.; Hoffman, B. M.; Mol. Phys.1980, 39, 1073. 52. See also Abragam and Bleaney,12 Table 7.22 for equations
analogous to 1, including those for hyperfine coupling. 53. Bendix, J.; Brorson, M.; Schäffer, C. E.; Inorg. Chem.1993,
32, 2838.
54. Adamsky, H.; AOMX, Heinrich-Heine-Universität: Düsseldorf, Germany, 1994. See the URL: http://www.aomx.de/docs/html/ aomxeh.html.
55. Gerloch, M.; CAMMAG; University of Cambridge: Cambridge, U.K., 1991.
56. Krzystek, J.; Park, J.-H.; Meisel, M. W.; Hitchman, M. A.; Stratemeier, H.; Brunel, L.-C.; Telser, J.; Inorg. Chem.2002, 41, 4478.
57. Krzystek, J.; Telser, J.; Pardi, L. A.; Goldberg, D. P.; Hoffman, B. M.; Brunel, L.-C.; Inorg. Chem.1999, 38, 6121.
58. This calculation employed k = 1, but ζ was reduced in magnitude from the free-ion value, -830 cm-1, due to the
strongly covalent tetrapyrrole ligand.
![Figure 2. EPR spectrum of [Ni(cyclam)] 3+ (chloride anion) in frozen aque- aque-ous solution (~0.5 mmol L -1 ): experimental numerical derivative (red, upper trace) and its simulation (blue, lower trace)](https://thumb-eu.123doks.com/thumbv2/123dok_br/18990783.460574/5.892.91.442.101.609/figure-spectrum-chloride-solution-experimental-numerical-derivative-simulation.webp)
![Figure 4. EPR spectrum of [Fe(CN) 6 ] 3– (tetraphenylphosphonium cation) in frozen acetonitrile/toluene (2:1 v/v) solution (~1 mmol L -1 ):](https://thumb-eu.123doks.com/thumbv2/123dok_br/18990783.460574/6.892.482.760.564.981/figure-spectrum-tetraphenylphosphonium-cation-frozen-acetonitrile-toluene-solution.webp)
![Figure 8. Multi-frequency EPR spectra of [V(H 2 O) 6 ] 2+ (sulfate anion) in frozen aqueous solution recorded at 9 GHz (at 77 K), 195, 280, 320 GHz (all at 5 K).](https://thumb-eu.123doks.com/thumbv2/123dok_br/18990783.460574/9.892.93.439.426.743/figure-multi-frequency-spectra-sulfate-aqueous-solution-recorded.webp)


