CPD
8, 1275–1300, 2012Isotopic and lithologic variations
of precisely dated stalagmite
Y. F. Cui et al.
Title Page
Abstract Introduction
Conclusions References
Tables Figures
◭ ◮
◭ ◮
Back Close
Full Screen / Esc
Printer-friendly Version Interactive Discussion
P
a
per
|
Dis
cussion
P
a
per
|
Discussion
P
a
per
|
Discussio
n
P
a
per
|
Clim. Past Discuss., 8, 1275–1300, 2012 www.clim-past-discuss.net/8/1275/2012/ doi:10.5194/cpd-8-1275-2012
© Author(s) 2012. CC Attribution 3.0 License.
Climate of the Past Discussions
This discussion paper is/has been under review for the journal Climate of the Past (CP). Please refer to the corresponding final paper in CP if available.
Isotopic and lithologic variations of one
precisely dated stalagmite across the
Medieval/LIA period from Heilong Cave,
Central China
Y. F. Cui1, Y. J. Wang1, H. Cheng2,3, K. Zhao1, and X. G. Kong1
1
College of Geography Science, Nanjing Normal University, Nanjing, 210097, China
2
Institute of Global Environmental Change, Xi’an Jiaotong University, Xi’an, 710049, China
3
Department of Geology and Geophysics, University of Minnesota, Minneapolis, Minnesota, 55455, USA
Received: 28 March 2012 – Accepted: 4 April 2012 – Published: 17 April 2012 Correspondence to: Y. J. Wang ([email protected])
CPD
8, 1275–1300, 2012Isotopic and lithologic variations
of precisely dated stalagmite
Y. F. Cui et al.
Title Page
Abstract Introduction
Conclusions References
Tables Figures
◭ ◮
◭ ◮
Back Close
Full Screen / Esc
Printer-friendly Version Interactive Discussion
Discussion
P
a
per
|
Dis
cussion
P
a
per
|
Discussion
P
a
per
|
Discussio
n
P
a
per
|
Abstract
Lithologic and isotopic changes of one stalagmite (224 mm in length) from Heilong Cave, Central China, are here investigated in order to explore multiple speleothem proxies of monsoon climate. High uranium concentrations (6–10 ppm) ensure Th-230 dates precisely and resultant chronology ranges from∼790 AD to 1780 across the
Me-5
dieval Warm Period (MWP) to Little Ice Age (LIA). Annually resolved oxygen and carbon isotopic data, gray level and elemental Sr are highly related to macroscopic lithologic changes. A lamination sequence is composed of alternations of white-porous and dark-compact calcite clearly discerned on the polished surface. The dark-dark-compact laminae have low values of gray level, high Sr andδ13C values, indicating periods of low growth 10
rate under dry climate conditions, and vise versa for the white-porous laminae. This suggests that changes in hydrology, matter input of drip water and crystallization pro-cess were controlled by cave environments and climates. The alternation of dry and wet periods with a significant periodicity of ∼90 yr, as indicated by spectral analysis
of the multiple proxies, is further supported by a reconstructed precipitation index by 15
historical documents and instrumental data extending back to 1470 AD. A strong co-herence between monsoon proxy of calciteδ18O and the other proxies was observed during the LIA but not during the MWP. This is likely due to changes in atmospheric circulation pattern at the boundary of MWP/LIA. When the Intertropical Convergence Zone shifted southward during the LIA, summer monsoon precipitation at the cave site 20
was probably dominated by the Mei-Yu, resulting in water vapor mainly originated from adjacent oceanic sources.
1 Introduction
The Medieval Warm Period (MWP) and Little Ice Age (LIA) are intensively concerned climate episodes during the last two millennia (Bradley and Jones, 1992; Esper et al., 25
CPD
8, 1275–1300, 2012Isotopic and lithologic variations
of precisely dated stalagmite
Y. F. Cui et al.
Title Page
Abstract Introduction
Conclusions References
Tables Figures
◭ ◮
◭ ◮
Back Close
Full Screen / Esc
Printer-friendly Version Interactive Discussion
P
a
per
|
Dis
cussion
P
a
per
|
Discussion
P
a
per
|
Discussio
n
P
a
per
|
and causal factors underlying them (Mann et al., 2009; Kaufman et al., 2009). The centennial-scale oscillation has involved a significant perturbation in tropical ocean temperatures as well as monsoon rainfall (Newton et al., 2006). The episodic and widespread Asian monsoon droughts during the LIA were thought to have played a ma-jor role in significantly changing regional society at that time (Cook et al., 2010; Buck-5
ley et al., 2010). However, it still remains unclear about the spatiotemporal pattern of the Asian monsoon rainfall and its forcing mechanism partly due to inadequate high-resolution and long-term climate observations.
Considerable progress in reconstructing Asian monsoon (AM) climate over the past millennia has been made in using climate “proxy” data, such as ice cores (Thompson 10
et al., 2000; Yang et al., 2007), tree rings (Cook et al., 2010; Buckley et al., 2010), lake sediments (Yancheva et al., 2007; Chu et al., 2009) and historical documents (Zheng et al., 2006; Tan et al., 2008). Speleothems are important terrestrial archives in record-ing AM climate for the past two millennia (Tan et al., 2003, 2006; Sinha et al., 2007, 2011; Zhang et al., 2008), as they have a great potential in dating, resolution and dis-15
tribution (McDermott et al., 2004; Fairchild et al., 2006). The stalagmite δ18O signal has been the extensively and successfully applied monsoon proxy, such as records from India and the Middle East (Sinha et al., 2011; Fleitmann et al., 2004, 2007) and data from China (Zhang et al., 2008; Wang et al., 2005; Hu et al., 2008). All of these δ18O records indicated an accordant monsoon evolution trend: an increase in MWP 20
and decrease in LIA. In East China, however, an integrated analysis of instrumental and historical records suggested a complex spatial rainfall pattern for the MWP and LIA, probably due to different responses of local rainfall to changes in regional mon-soon intensity (Zhang et al., 2010). It is therefore necessary to utilize multiple proxies in stalagmite to investigate cave temperature, rainfall and vegetation response, in order 25
CPD
8, 1275–1300, 2012Isotopic and lithologic variations
of precisely dated stalagmite
Y. F. Cui et al.
Title Page
Abstract Introduction
Conclusions References
Tables Figures
◭ ◮
◭ ◮
Back Close
Full Screen / Esc
Printer-friendly Version Interactive Discussion
Discussion
P
a
per
|
Dis
cussion
P
a
per
|
Discussion
P
a
per
|
Discussio
n
P
a
per
|
Here, we explore multiple parameters from one stalagmite from Heilong Cave, Cen-tral China to investigate the climatic and environmental changes during the MWP and LIA. The trace element and stable isotope variations have largely been accounted for progressive CO2degassing and calcite precipitation from an initially saturated solution (Johnson et al., 2006), and may be related to seasonal rainfall changes. Additionally, 5
the lithological changes, as alternations of annually deposited white-porous and dark-compact laminae, have been explained by the highly seasonal variations of the water excess (Genty and Quinif, 1996). Two issues are concerned: (1) climatic relationship between macroscopic lithologic changes and multi-proxy sequences; (2) shifts of mon-soon circulation mode across the Medieval/LIA period, inferred from multiple parame-10
ters.
2 Material and methods
Heilong Cave (31◦40′N, 110◦26′E, elevation 1220 m) is located on the north slope of Mountain Shennongjia, over the middle reaches of Yangtze River Valley, Central China. Densely forested vegetation at the cave and surrounding area consists primarily of tem-15
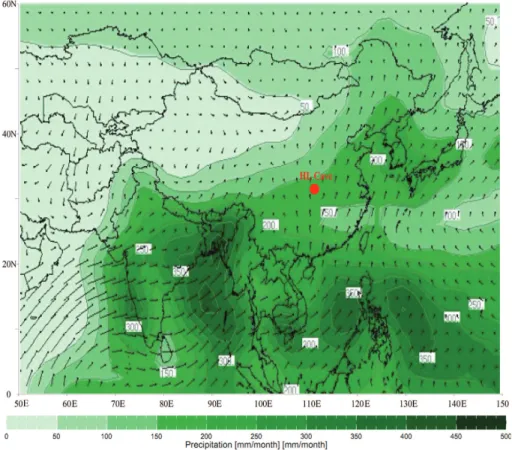
perate deciduous broad-leaved plants. The cave was formed in Permian limestone, and is approximately 600 m in length with a narrow entrance. The relative humidity inside is close to 100 %. Regional climate is dominated by the East Asian monsoons (EAM) (Fig. 1). Mean annual precipitation between 1000 mm and 1500 mm shows a significant seasonal variation. During boreal summer (June to August), the inflow of warm/humid 20
air from equatorial Pacific penetrates into the Mt. Shennongjia, delivering more than 50 % of total annual precipitation. Much less precipitation (∼5 %) occurs during the
win-ter monsoon months (December to February). Heilong Cave, together with previously reported Sanbao (close to Heilong) (Wang et al., 2008) and Hulu Cave (∼800 km E)
(Wang et al., 2001)are located within the Maiyu frontal zone of the EAM system, along 25
CPD
8, 1275–1300, 2012Isotopic and lithologic variations
of precisely dated stalagmite
Y. F. Cui et al.
Title Page
Abstract Introduction
Conclusions References
Tables Figures
◭ ◮
◭ ◮
Back Close
Full Screen / Esc
Printer-friendly Version Interactive Discussion
P
a
per
|
Dis
cussion
P
a
per
|
Discussion
P
a
per
|
Discussio
n
P
a
per
|
are mainly distributed over the mid-low Yangtze River Valley, with concentrated and in-tensive rainfall of 200–300 mm, accounting for about 45 % of total summer (June, July and August) rainfall amount (Ding and Chan, 2005; Ding et al.,2007). Mean annual surface temperature is about 8–13◦C, reaching a maximum in July (mean∼22◦C) and
a minimum in January (∼1◦C). Drip rate of seepage water inside the cave increases
5
during the rainy seasons, and decreases dramatically during the dry seasons, following the seasonal cycle of local precipitation.
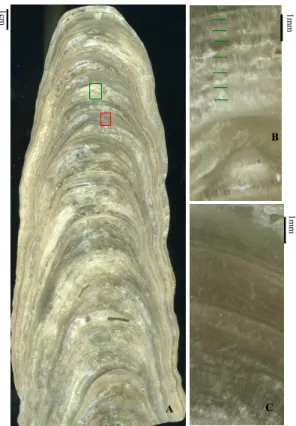
The columnar-shaped stalagmite BD is 224 mm in length, and its diameter ranges between 27 and 88 mm. The sample was halved along the growth axis and polished, showing alternations of white-porous and dark-compact laminations (Fig. 2a). Fairly 10
short sections present visible annual layers, identifiable with the naked eye (Fig. 2b,c), despite that the annual laminations do not persist throughout the whole sequence.
Eleven sub-samples were collected for U-Th dating. Approximately 100 mg samples of powder were extracted by milling along growth horizons with a hand-held carbide dental drill. Procedures for chemical separation and purification of uranium and thorium 15
are similar to those described in Edwards et al. (1987) and Cheng et al. (2000). Mea-surements were performed on a Finnigan Element inductively coupled plasma mass spectrometer (ICP-MS), equipped with a double-focusing sector magnet and energy fil-ter in reversed Nier-Johnson geometry and a MasCom multiplier, following procedures described in Shen et al. (2002). This work was performed at the Minnesota Isotope 20
Laboratory, University of Minnesota.
A total of 1103 sub-samples were collected on average of every 0.2 mm along the central growth axis for isotopic analysis by knife shaving. The measurement was per-formed on a Finnigan-MAT 253 mass spectrometer fitted with a Kiel Carbonate Device at the College of Geography Science, Nanjing Normal University. Stable isotope mea-25
CPD
8, 1275–1300, 2012Isotopic and lithologic variations
of precisely dated stalagmite
Y. F. Cui et al.
Title Page
Abstract Introduction
Conclusions References
Tables Figures
◭ ◮
◭ ◮
Back Close
Full Screen / Esc
Printer-friendly Version Interactive Discussion
Discussion
P
a
per
|
Dis
cussion
P
a
per
|
Discussion
P
a
per
|
Discussio
n
P
a
per
|
A proxy of gray level was measured on a scanned picture of the polished surface taken with a high-resolution scanner. The data were obtained using ENVI software with a 4 mm wide traverse along the central growth axis. Gray levels vary between 20 and 250 with a mean of 99. The trace element analyses were produced by the Avaatech XRF Core Scanner (X-ray fluorescence spectrometry), which is equipped with a vari-5
able optical system that enables any resolution between 10 and 0.1 mm (here, 0.5 mm resolution). This work was performed at the Surficial Geochemistry Laboratory, Nanjing University.
3 Results
3.1 Chronology
10
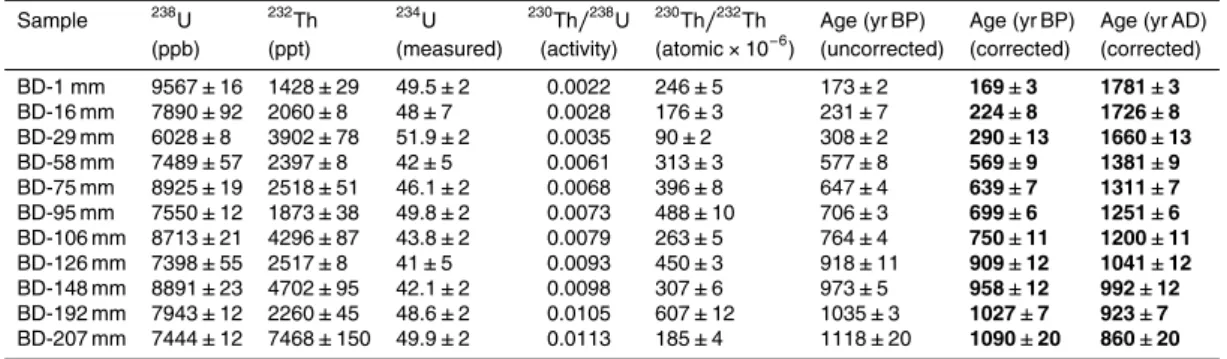
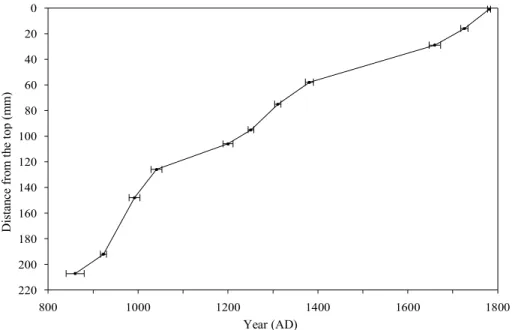
Eleven 230Th dates are used to develop chronology for stalagmite BD (Fig. 3), with typical errors (2σ) of about 0.5 % (Table 1). The resultant dates are in stratigraphic order and range from 860 AD to 1780 AD, with most of the deposition across the MWP and LIA. Errors are small, from±3 to±20 yr, due to high uranium concentrations (from
6 to 9.6 ppm). Over the dated interval, the average growth rate is 22.4 mm/100 yr. An 15
age model of stalagmite is based on linear interpolation between 230Th dates. The average sampling interval for the stable isotope analyses is∼0.8 yr.
3.2 Proxy sequences
Equilibrium calcite precipitation is important in order to interpret calciteδ18O in terms of climate. A “Hendy Test” (Hendy, 1971), performed on six individual growth laminae, 20
CPD
8, 1275–1300, 2012Isotopic and lithologic variations
of precisely dated stalagmite
Y. F. Cui et al.
Title Page
Abstract Introduction
Conclusions References
Tables Figures
◭ ◮
◭ ◮
Back Close
Full Screen / Esc
Printer-friendly Version Interactive Discussion
P
a
per
|
Dis
cussion
P
a
per
|
Discussion
P
a
per
|
Discussio
n
P
a
per
|
with an overall mean of−8.3 ‰ (Fig. 5). The δ18O profile exhibits significant
fluctua-tions, and no long-term trend is observed throughout the whole profile. The amplitude seems larger during the interval of 0∼73 mm (mainly covering the LIA, approximately
1.3 ‰) than the other part. Previous studies suggested that shifts in stalagmiteδ18O largely reflect changes inδ18O values of meteoric precipitation at Hulu and Sanbao 5
Caves. These shifts, in turn, likely relate to changes in summer monsoon intensity (Cheng et al., 2006, 2009; Wang et al., 2001, 2008). The isotopic composition of mod-ern precipitation from the nearest meteorological station (Wuhan, 30.62◦N, 114.13◦E) exhibits a distinct seasonal signal (Aragu ´as-Aragu ´as et al., 1998). Weighted mean an-nualδ18O value for the period from 1988–1996 was−7.0 ‰, with more negative values
10
in summer months (average−9.5‰, SMOW) and more positiveδ18O in winter months
(average−4.5 ‰, SMOW). More negative δ18O values are consistent with a greater
contribution of summer rainfall, associated with strong summer monsoon circulation. Therefore, we interpret theδ18O record from Heilong Cave in the same manner as the Sanbao and Hulu records.
15
δ13C values range from−14.9 ‰ to−10.5 ‰, with an average of −12.4 ‰ (Fig. 5).
Theδ13C curve shows a striking similarity to theδ18O during the interval of 0∼73 mm
(corresponding to the LIA) with five peaks and five troughs and notable differences in the rest (the MWP). The amplitude seems smaller in the LIA (∼2.5 ‰) in contrast to
the MWP (∼3.74 ‰, Fig. 6a). Variations ofδ13C depend upon type of vegetation (C3 or
20
C4), drip rate of water, bedrock dissolution rate and seasonal variations in the soil CO2 in a complex fashion (Genty et al., 2001; McDermott et al., 2004; Fairchild et al., 2006). Therefore, stalagmiteδ13C records can be used as an indicator of local environmental changes.
Elemental Sr profile is illustrated in Fig. 5. The variations in the bulk Sr content gen-25
CPD
8, 1275–1300, 2012Isotopic and lithologic variations
of precisely dated stalagmite
Y. F. Cui et al.
Title Page
Abstract Introduction
Conclusions References
Tables Figures
◭ ◮
◭ ◮
Back Close
Full Screen / Esc
Printer-friendly Version Interactive Discussion
Discussion
P
a
per
|
Dis
cussion
P
a
per
|
Discussion
P
a
per
|
Discussio
n
P
a
per
|
transported downward by the seepage water, the Sr in speleothems is expected to be derived mainly from the overlying limestone. Changes in the Sr content of a stalagmite can be controlled by dissolution-precipitation processes in the unsaturated zone, due to differences in water residence time (Roberts et al., 1998; Bar-Matthews et al., 1999; Fairchild et al., 2000). Thus, Sr content in stalagmite can be used as an indicator of 5
drip rate, and then likely reflects dry/wet conditions at the cave site.
4 Discussions
4.1 Link between climatic and lithological changes
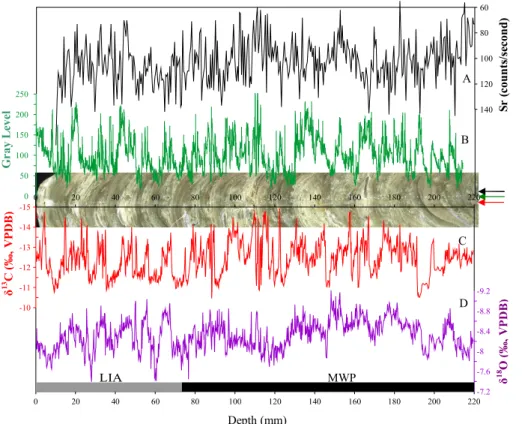
As mentioned before, sample BD exhibits alternations of white-porous and dark-compact calcite. In Fig. 5, gray level directly reflects the macroscopic lithological 10
changes, with high values of gray level, corresponding to white-porous phases, whereas low values to dark-compact phases. Comparison between δ13C and gray level shows a good relationship, with negative and positive excursions ofδ13C values, corresponding to high (white-porous laminae) and low (dark-compact laminae) values of gray level, respectively (Fig. 5). The Sr profile has a substantial similarity to gray 15
level andδ13C curves. High Sr intensities are closely associated with the dark-compact laminae, while low to white-porous laminae (Fig. 5). However, there are some discrep-ancies among them, likely due to analysis errors from pore spaces on the polished surface (Fig. 2a) and different analysis tracks among them (Fig. 5).
As shown in Fig. 3, changes in growth rate can be divided into two distinct inter-20
vals. The first phase (0∼75 mm from the top, spanning the LIA), containing more
dark-compact laminae, shows much lower growth rate (∼15 mm/100 yr) than that
(∼29 mm/100 yr) in the second phase (75∼220 mm, in MWP), encompassing more
white-porous laminae (Fig. 5). The lowest growth rate (∼10 mm/100 yr) of the sample
falls within the first part, from 29∼58 mm depth, signaling the summit of LIA. The
max-25
CPD
8, 1275–1300, 2012Isotopic and lithologic variations
of precisely dated stalagmite
Y. F. Cui et al.
Title Page
Abstract Introduction
Conclusions References
Tables Figures
◭ ◮
◭ ◮
Back Close
Full Screen / Esc
Printer-friendly Version Interactive Discussion
P
a
per
|
Dis
cussion
P
a
per
|
Discussion
P
a
per
|
Discussio
n
P
a
per
|
at the beginning of MWP. The changes in growth rate deduced from230Th dates can be further evaluated by the sparse and faint annual-bands. In the white-porous laminae, thickness of annual visible bands varies approximately from 300∼900 µm, averaging
at ∼570 µm (Fig. 2b). The white, dark paired laminae resemble the white-dark
cou-plets described in a stalagmite from Heshang Cave (close to Heilong Cave, Johnson 5
et al., 2006), probably due to a similar climate that has a strong seasonality. In the dark-compact laminae, annual bands vary approximately from 45∼120 µm, averaging
at∼85 µm (Fig. 2c), close to those of annual microbanding in stalagmites from North
China (Tan et al., 2006, Hou et al., 2002). These observations suggest that changes in growth rate are consistent with the macroscopic lithological changes, with high growth 10
rate corresponding to white-porous laminae and low to dark-compact laminae.
Genty and Quinif (1996) have proposed that the annual variations of drip rate and super-saturation, due to seasonality in the seepage water, may produce some de-gree of crystalline coalescence, thus forming compact versus porous layers. In the same manner, the seasonal variation of compact versus porous layers could occur 15
at a decadal-centennial timescale. In our study region where vegetation type is pre-dominantly C3 forest, the influence of vegetation on stalagmiteδ13C primarily reflects changes in the density of vegetative cover and biomass (Baldini et al., 2005). In dry years, limited vegetation growth and soil CO2production could lead to less contribution of biogenic CO2dissolving in the seepage water and high speleothemδ
13
C values, and 20
vice versa. Additionally, reduced/increased drip rates under dry/wet conditions could result in high/low speleothemδ13C values, owing to more/less time for CO2degassing (Bar-Matthews et al., 1996; M ¨uhlinghaus et al., 2007; Romanov et al., 2008). There-fore, a good relationship betweenδ13C, Sr and visible lithological changes in sample BD suggests that dark-compact structures were formed under dry conditions (low drip 25
CPD
8, 1275–1300, 2012Isotopic and lithologic variations
of precisely dated stalagmite
Y. F. Cui et al.
Title Page
Abstract Introduction
Conclusions References
Tables Figures
◭ ◮
◭ ◮
Back Close
Full Screen / Esc
Printer-friendly Version Interactive Discussion
Discussion
P
a
per
|
Dis
cussion
P
a
per
|
Discussion
P
a
per
|
Discussio
n
P
a
per
|
4.2 Monsoon changes across the MWP/LIA
The intra-seasonal monsoon variability is dominated by the “active” and “break” spells – two distinct oscillatory modes of monsoon that have radically different synoptic scale circulation and precipitation patterns (Annamalai and Slingo, 2001; Rajeevan et al., 2010). The seasonal cycle is a plausible analog for decadal-centennial scale 5
strong/weak monsoon alternations. Lines of evidence suggest that stronger monsoons, related to northward shifts of Intertropical Convergence Zone (ITCZ), may be associ-ated with a protracted phase of the “active-dominassoci-ated” mode during the MWP, and vice versa for the LIA (review in Sinha et al., 2011). As mentioned before, the relationship of theδ18O andδ13C series is strong during LIA, with a Pearson correlation coefficient 10
of 0.46 (n=407,p <0.001). The δ18O profile also bears a remarkable resemblance to gray level and Sr intensities during that period (Fig. 6b). In contrast, notable diff er-ences occur between theδ18O and the other proxies during MWP (790∼1320 AD),
with a low Pearson correlation coefficient of ∼0.18 (δ18O vs. δ13C) (Figs. 5 and 6a).
This suggests that changes in large-scale monsoon circulation may be responsible for 15
the coupling of the regionalδ18O signal and the local environmental proxies since the beginning of LIA.
The Asian summer monsoon system consists mainly of the ITCZ (tropical monsoon trough) and Subtropical Convergence Zone (Mei-Yu front) (Tao and Chen, 1987). Mete-orological studies have indicated an opposite relationship of intensities between ITCZ 20
and Subtropical Convergence Zone (Zhang, 1998, 2001; Zhang and Tao, 1998). Pre-vious studies from Asia (Yancheva et al., 2007; Sinha et al., 2011), Africa (Verschuren et al., 2000; Brown and Johnson, 2005), South America (Reuter et al., 2009; Bird et al., 2011) and Pacific Ocean (Oppo et al., 2009; Sachs et al., 2009) suggest that ITCZ has shifted substantially to its southernmost position during the LIA. Under the LIA 25
CPD
8, 1275–1300, 2012Isotopic and lithologic variations
of precisely dated stalagmite
Y. F. Cui et al.
Title Page
Abstract Introduction
Conclusions References
Tables Figures
◭ ◮
◭ ◮
Back Close
Full Screen / Esc
Printer-friendly Version Interactive Discussion
P
a
per
|
Dis
cussion
P
a
per
|
Discussion
P
a
per
|
Discussio
n
P
a
per
|
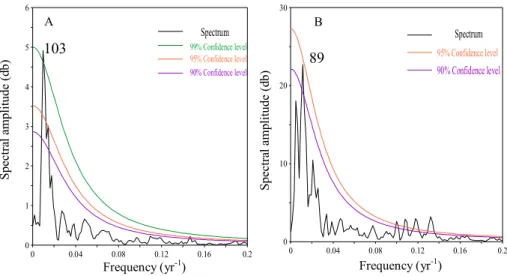
Therefore, the summer rainfall and itsδ18O at the cave site were probably controlled by a single moisture source linked to Mei-Yu, which originates from adjacent oceanic sources, with strong Mei-Yu intensity related to heavy rainfall and negativeδ18O val-ues, and vice versa. Spectral analyses on theδ18O andδ13C records of stalagmite BD over the LIA show a significant peak at∼100 yr and∼90 yr, respectively (Fig. 7). These
5
quasi-periodicities are consistent with the centennial cycle for the length of Mei-yu, re-constructed by historical documents and instrumental data extending back to 1736 AD (Ge et al., 2008) and the 90-yr oscillation exhibited in dry-wet indices of lower Yangtze River over the period 1470–1670 AD (Qian and Zhu, 2002). This suggests that the summer rainfall and itsδ18O at the cave site probably reflected the Mei-Yu intensity at 10
LIA.
The Mei-Yu control of the cave environment during the LIA is further supported by a comparison of reconstructed summer (JJA) precipitation index by tree-ring and histor-ical documents for North China (Yi et al., 2012) and our multi-proxy profiles. As shown in Fig. 6b, within dating uncertainties, each of the seven wet intervals at the cave site 15
has its corresponding dry episode over North China, supporting the idea that changes in spatial rainfall patterns in China were controlled by the interaction between the tropic monsoon trough and the Mei-Yu front (Zhang and Tao, 1998; Ge et al., 2008), with weak (intense) tropic monsoon intensity corresponding to an intense (weak) Mei-Yu front, high (low) rainfall over the mid-low Yangtze River Valley, and low (high) precipita-20
tion over North China (Zhang, 2001; Qian et al., 2007). When ITCZ shifted northward during the MWP (Sachs et al., 2009; Sinha et al., 2011), water vapor for the sum-mer rainfall over the mid-low Yangtze River Valley may come from a distant, tropical Indo-Pacific source and adjacent oceanic sources, leading to a complex relationship of rainfallδ18O and its amount.
CPD
8, 1275–1300, 2012Isotopic and lithologic variations
of precisely dated stalagmite
Y. F. Cui et al.
Title Page
Abstract Introduction
Conclusions References
Tables Figures
◭ ◮
◭ ◮
Back Close
Full Screen / Esc
Printer-friendly Version Interactive Discussion
Discussion
P
a
per
|
Dis
cussion
P
a
per
|
Discussion
P
a
per
|
Discussio
n
P
a
per
|
5 Conclusions
Based on 11 precise230Th dates and measurements of physical, elemental and iso-topic proxies of one stalagmite from Heilong Cave, Central China, we reconstructed annually-resolved monsoon climate changes from 790 to 1780 AD covering the MWP and LIA. Three conclusions can be drawn from multi-proxy investigations as follows: 5
1. Macroscopic lithologic changes, with alternations of white-porous and dark-compact laminae, are highly related to variations of multi-proxy profiles, which were mainly controlled by changes in cave environments and climates on decadal-centennial time scales. In general, dark-compact laminae have a low growth rate and gray level, high Sr intensities and δ13C values, indicating periods under dry 10
conditions, and vise versa for white-porous laminae. This suggests that macro-scopic lithologic changes, analogous to seasonal fabric variations in annual lami-nae, can serve as an indicator of climatic or environmental changes.
2. High-resolution δ18O, δ13C, gray level and Sr profiles exhibit significant fluctua-tions without a long-term trend throughout the whole profiles. All records show 15
low frequency oscillations in MWP and high frequency in LIA, with a significant periodicity of ∼90 yr in LIA. The amplitude of δ13C, gray level and Sr cycles is
larger in MWP than that in LIA, but in an opposite sense toδ18O. Contrasting with the MWP,δ18O andδ13C values are heavier and growth rate is lower during the LIA, indicating a relatively drier condition.
20
3. Relationship between the regionalδ18O signal and the local environmental prox-ies (δ13C, gray level and Sr) switched to a coupled mode since LIA, likely due to a shift in atmospheric circulation patterns across the MWP/LIA. When ITCZ shifted southward during the LIA, water vapor and itsδ18O at the cave site were probably dominated by a single moisture source linked to the Mei-Yu, resulting 25
CPD
8, 1275–1300, 2012Isotopic and lithologic variations
of precisely dated stalagmite
Y. F. Cui et al.
Title Page
Abstract Introduction
Conclusions References
Tables Figures
◭ ◮
◭ ◮
Back Close
Full Screen / Esc
Printer-friendly Version Interactive Discussion
P
a
per
|
Dis
cussion
P
a
per
|
Discussion
P
a
per
|
Discussio
n
P
a
per
|
moisture sources, leading to an ambiguous relationship between rainfall δ18O and its amount.
Acknowledgements. This work was supported by the National Nature Science Foundation of China (grant No. 2007105GZ10033), Basic Research Program of Jiangsu Province (grant No. BK2008025) and the CAS Strategic Priority Research Program (grant No. XDA05080503).
5
References
Annamalai, H. and Slingo, J. M.: Active/break cycles: Diagnosis of the intraseasonal variability of the Asian summer monsoon, Clim. Dynam., 18, 85–102, 2001.
Aragu ´as-Aragu ´as, L., Froehlich, K., and Rozanski, K.: Stable isotope composition of precipita-tion over Southeast Asia, J. Geophys Res., 103, 28721–28742, 1998.
10
Baldini, J., McDermott, F., Baker, A., Baldini, L., Mattey, D., and Railsback, B.: Biomass effects on stalagmite growth and isotope ratios: a 20th century analogue from Wiltshire, England, Earth Planet. Sc. Lett., 240, 486–494, 2005.
Bar-Matthews, M., Ayalon, A., Matthews, A., Sass, E., and Halicz, L.: Carbon and oxygen iso-tope study of the active water-carbonate system in a karstic Mediterranean Cave: implication
15
for palaeoclimate research in semiarid regions, Geochim. Cosmochim. Acta, 60, 337–347, 1996.
Bar-Matthews, M., Ayalon, A., Kaufman, A., and Wasserburg, G. J.: The Eastern Mediterranean paleoclimate as a reflection of regional events: Soreq Cave, Israel, Earth Planet. Sc. Lett., 166, 85–95, 1999.
20
Bird, B. W., Abbott, M. B., Vuille, M., Rodbell, D. T., Stansell, N. D., and Rosenmeier, M. F.: A 2,300-yr-long annually resolved record of the South American summer monsoon from the Peruvian Andes, P. Natl. Acad. Sci. USA, 108, 8583–8588, 2011
Bradley, R. S. and Jones, P. D.: When was the “Little Ice Age”?, in: Proceedings of the In-ternational Symposium on the Little Ice Age climate, edited by: Mikami, T., Department of
25
Geography, Tokyo Metropolitan University, 1–4, 1992.
CPD
8, 1275–1300, 2012Isotopic and lithologic variations
of precisely dated stalagmite
Y. F. Cui et al.
Title Page
Abstract Introduction
Conclusions References
Tables Figures
◭ ◮
◭ ◮
Back Close
Full Screen / Esc
Printer-friendly Version Interactive Discussion
Discussion
P
a
per
|
Dis
cussion
P
a
per
|
Discussion
P
a
per
|
Discussio
n
P
a
per
|
Brown, E. T. and Johnson, T. C.: Coherence between tropical East African and South American records of the Little Ice Age, Geochem. Geophy. Geosy., 6, Q12005, doi:10.1029/2005GC000959, 2005.
Buckley, B. M., Anchukaitis, K. J., Penny, D., Fletcher, R., Cook, E. R., Sano, M., Nam, L. C., Wichienkeeo, A., Minh, T. T., and Hong, T. M.: Climate as a contributing factor in the demise
5
of Angkor, Cambodia, P. Natl. Acad. Sci. USA, 107, 6748–6752, 2010.
Cheng, H., Edwards, R. L., Hoff, J., Gallup, C. D., Richards, D. A., and Asmerom, Y.: The half-lives of uranium-234 and thorium-230, Chem. Geol., 169, 17–33, 2000.
Cheng, H., Edwards, R. L., Wang, Y. J., Kong, X. G., Ming, Y. F., Gallup, C. D., Kelly, M. J., Wang, X. F., and Liu, W. G.: A penultimate glacial monsoon record from Hulu Cave and
10
two-phase glacial terminations, Geology, 34, 217–220, 2006.
Cheng, H., Edwards, R. L., Broecker, W. S., Denton, G. H., Kong, X. G., Wang, Y. J., Zhang, R., and Wang, X. F.: Ice age terminations, Science, 326, 248–251, 2009.
Chu, G. Q., Sun, Q., Wang, X. H., Li, D., Rioual, P., Qiang, L., Han, J. T., and Liu, J. Q.: A 1600 yr multi-proxy record of paleoclimatic change from varved sediments in Lake Xiaolongwan,
15
Northeastern China, J. Geophys Res., 114, D22108, doi:10.1029/2009JD012077, 2009. Cook, E. R., Anchukaitis, K. J., Buckley, B. M., D’Arrigo, R. D., Jacoby, G. C., and Wright, W. E.:
Asian monsoon failure and megadrought during the last millennium, Science, 328, 486–489, 2010.
Ding, Y. H. and Chan, J. C. L.: The East Asian summer monsoon: an overview, Meteorol. Atmos.
20
Phys., 89, 117–142, 2005.
Ding, Y. H., Liu, J. J., Sun, Y., Liu, Y. J., He, J. H., and Song, Y. F.: A study of the synoptic-climatology of the Meiyu system in East Asia, Chin. J. Atmos. Sci., 31, 1082–1101, 2007. Dykoski, C. A., Edwards, R. L., Cheng, H., Yuan, D. X., Cai, Y. J., Zhang, M. L., Lin, Y. S.,
Qing, J. M., An, Z. S., and Revenaugh, J.: A high-resolution, absolute-dated holocene and
25
deglacial Asian monsoon record from Dongge Cave, China, Earth Planet. Sc. Lett., 233, 71–86, 2005.
Edwards, R. L., Cheng, J. H., and Wasserburg, G. J.:238U-234U-230Th-232Th systematics and the precise measurement of time over the past 500 000 yr, Earth Planet. Sc. Lett., 81, 175– 192, 1986/87.
30
CPD
8, 1275–1300, 2012Isotopic and lithologic variations
of precisely dated stalagmite
Y. F. Cui et al.
Title Page
Abstract Introduction
Conclusions References
Tables Figures
◭ ◮
◭ ◮
Back Close
Full Screen / Esc
Printer-friendly Version Interactive Discussion
P
a
per
|
Dis
cussion
P
a
per
|
Discussion
P
a
per
|
Discussio
n
P
a
per
|
Fairchild, I. J., Borsato, A., Tooth, A. F., Frisia, S., Hawkesworth, C. J., Huang, Y., McDermott, F., and Spiro, B.: Controls on trace element (Sr-Mg) compositions of carbonate cave waters: implications for speleothem climatic records, Chem. Geol., 166, 255–269, 2000.
Fairchild, I. J., Smith, C. L., Baker, A., Fuller, L., Sp ¨otl, C., Mattey, D., McDermott, F., and E. I. M. F.: Modification and preservation of environmental signals in speleothems, Earth-Sci.
5
Rev., 75, 105–153, 2006.
Fleitmann, D., Burns, S. J., Neff, U., Mudelsee, M., Mangini, A., and Matter, A.: Palaeocli-matic interpretation of high-resolution oxygen isotope profiles derived from annually lami-nated speleothems from Southern Oman, Quaternary Sci. Rev., 23, 935–945, 2004. Fleitmann, D., Burns, S. J., Mangini, A., Mudelsee, M., Kramers, J., Villa, I., Neff, U.,
Sub-10
bary, A.-A., Buettner, A., Hippler, D., and Matter, A.: Holocene ITCZ and Indian monsoon dynamics recorded in stalagmites from Oman and Yemen (Socotra), Quaternary Sci. Rev., 26, 170–188, 2007.
Ge, Q. S., Guo, X. F., Zheng, J. Y., and Hao, Z. X.: Meiyu in the middle and lower reaches of the Yangtze River since 1736, Chinese Sci. Bull., 53, 107–114, 2008.
15
Genty, D. and Quinif, Y.: Annually laminated sequences in the internal structure of some Belgian stalagmites-importance for paleoclimatology, J. Sediment. Res., 66, 275–288, 1996.
Genty, D., Baker, A., Massault, M., Procter, C., Gilmour, M., Pons-Banchu, E., and Hamelin, B.: Dead carbon in stalagmites: carbonate bedrock paleodissolution vs. ageing of soil organic matter. Implications for 13C variations in speleothems, Geochim. Cosmochim. Acta, 65,
20
3443–3457, 2001.
Hendy, C. H.: The isotopic geochemistry of speleothems – I. The calculation of the effects of dif-ferent modes of formation on the isotopic composition of speleothems and their applicability as palaeoc limatic indicators, Geochim. Cosmochim. Acta, 35, 801–824, 1971.
Hou, J. Z., Tan, M., and Liu, D. S.: Counting chronology and climate records with about 1000
an-25
nual layers of a Holocene stalagmite from the Water Cave in Liaoning Province, China, Sci. China Ser. D, 54, 385–391, 2002.
Hu, C. Y., Henderson, G. M., Huang, J., Xie, S. C., Sun, Y., and Johnson, K. R.: Quantification of Holocene Asian monsoon rainfall from spatially separated cave records, Earth Planet. Sc. Lett., 266, 221–232, 2008.
30
CPD
8, 1275–1300, 2012Isotopic and lithologic variations
of precisely dated stalagmite
Y. F. Cui et al.
Title Page
Abstract Introduction
Conclusions References
Tables Figures
◭ ◮
◭ ◮
Back Close
Full Screen / Esc
Printer-friendly Version Interactive Discussion
Discussion
P
a
per
|
Dis
cussion
P
a
per
|
Discussion
P
a
per
|
Discussio
n
P
a
per
|
Kaufman, D. S., Schneider, D. P., McKay, N. P., Ammann, C. M., Bradley, R. S., Briffa, K. R., Miller, G. H., Otto-Bliesner, B. L., Overpeck, J. T., Vinther, B. M., and Arctic Lakes 2k Project Members: Recent warming reverses long-term arctic cooling, Science, 325, 1236–1239, 2009.
Mann, M. E., Zhang, Z., Rutherford, S., Bradley, R. S., Hughes, M. K., Shindell, D., Ammann, C.,
5
Falugevi, G., and Ni, F.: Global signatures and dynamical origins of the “Little Ice Age” and “Medieval Climate Anomaly”, Science, 326, 1256–1260, 2009.
McDermott, F.: Paleo-climate reconstruction from stable isotope variations in spleothems: a re-view, Quaternary Sci. Rev., 23, 901–918, 2004.
M ¨uhlinghaus, C., Scholz, D., and Mangini, A.: Modelling stalagmite growth andδ13C as a
func-10
tion of drip interval and temperature, Geochim. Cosmochim. Acta, 71, 2780–2790, 2007. Newton, A., Thunell, R., and Stott, L. D.: Climate and hydrographic variability in the
Indo-Pacific Warm Pool during the last millennium, Geophys. Res. Lett., 33, L19710, doi:10.1029/2006GL027234, 2006.
Oppo, D., Rosenthal, Y., and Linsley, B. K.: 2000-yr-long temperature and hydrology
reconstruc-15
tions from the Indo-Pacific warm pool, Nature, 460, 1113–1116, 2009.
Qian, W. H. and Zhu, Y. F.: Little ice age climate near Beijing, China, inferred from historical and stalagmite records, Quaternary Res., 57, 109–119, 2002.
Qian, W. H., Lin, X., Zhu, Y. F., Xu, Y., and Fu, J. L.: Climatic regime shift and decadal anomalous events in China, Climatic Change, 84, 167–189, 2007.
20
Rajeevan, M., Gadgil, S., and Bhate, J.: Active and break spells of the Indian summer mon-soon, J. Earth Syst. Sci., 119, 229–247, 2010.
Reuter, J., Stott, L., Khider, D., Sinha, A., Cheng, H., and Edwards, R. L.: A new perspective on the hydroclimate variability in Northern South America during the Little Ice Age, Geophys. Res. Lett., 36, L21706, doi:10.1029/2009GL041051, 2009.
25
Roberts, M. S., Smart, P., and Baker, A.: Annual trace element variations in a Holocene speleothem, Earth Planet. Sc. Lett., 154, 237–246, 1998.
Romanov, D., Kaufmann, G., and Dreybrodt, W.:δ13C profiles along growth layers of stalag-mites: comparing theoretical and experimental results, Geochim. Cosmochim. Acta, 72, 438– 448, 2008.
30
CPD
8, 1275–1300, 2012Isotopic and lithologic variations
of precisely dated stalagmite
Y. F. Cui et al.
Title Page
Abstract Introduction
Conclusions References
Tables Figures
◭ ◮
◭ ◮
Back Close
Full Screen / Esc
Printer-friendly Version Interactive Discussion
P
a
per
|
Dis
cussion
P
a
per
|
Discussion
P
a
per
|
Discussio
n
P
a
per
|
Schulz, M. and Mudelsee, M.: REDFIT: Estimating red-noise spectra directly from unevenly spaced paleoclimatic time series, Comput. Geosci., 28, 421–426, 2002.
Shen, C. C., Edwards, R. L., Cheng, H., Dorale, J. A., Thomas, R. B., Moran, S. B., Wein-stein, S. E., and Edmonds, H. N.: Uranium and thorium isotopic concentration measurements by magnetic sector inductively coupled plasma mass spectrometry, Chem. Geol., 185, 165–
5
178, 2002.
Sinha, A., Cannariato, K. G., Stott, L. D., Cheng, H., Edwards, R. L., Yadava, M. G., Ramesh, R., and Singh, I. B.: A 900 yr (600 to 1500 AD) record of the Indian summer mon-soon precipitation from the core monmon-soon zone of India, Geophys. Res. Lett., 34, L16707, doi:10.1029/2007GL030431, 2007.
10
Sinha, A., Stott, L., Berkelhammer, M., Cheng, H., Edwards, R. L., Buckley, B., Aldenderfer, M., and Mudelsee, M.: A global context for megadroughts in monsoon Asia during the past mil-lennium, Quaternary Sci. Rev., 30, 47–62, 2011.
Liangcheng Tan, Yanjun Cai, Liang Yi, Zhisheng An, and Li Ai: Precipitation variations of Longxi, northeast margin of Tibetan Plateau since AD 960 and their relationship with solar activity,
15
Clim. Past, 4, 19–28, doi:10.5194/cp-4-19-2008, 2008.
Tan, M., Liu, T. S., Hou, J. Z., Qin, X. G., Zhang, H. C., and Li, T. Y.: Cyclic rapid warming on centennial-scale revealed by a 2650-yr stalagmite record of warm season temperature, Geophys. Res. Lett., 30, 191–194, 2003.
Tan, M., Baker, A., Genty, D., Smith, C., Esper, J., and Cai, B. G.: Applications of stalagmite
lam-20
inae to paleoclimate reconstructions: Comparison with dendrochronology/climatology, Qua-ternary Sci. Rev., 25, 2103–2117, 2006.
Tao, S. Y. and Chen, L. X.: A review of recent research on the East Asina summer monsoon in China, in: Monsoon Meteorology, edited by: Chang, C. P. and Krishnamurti, T. N., Oxford University Press, 60–92, 1987.
25
Thompson, L. G., Yao, T., Mosley-Thompson, E., Davis, M. E., Henderson, K. A., and Lin, P. N.: A high-resolution millennial record of the South Asian monsoon from Himalayan ice cores, Science, 289, 1916–1919, 2000.
Verschuren, D., Laird, K. R., and Cumming, B. F.: Rainfall and drought in equatorial east Africa during the past 1100 yr, Nature, 403, 410–414, 2000.
30
CPD
8, 1275–1300, 2012Isotopic and lithologic variations
of precisely dated stalagmite
Y. F. Cui et al.
Title Page
Abstract Introduction
Conclusions References
Tables Figures
◭ ◮
◭ ◮
Back Close
Full Screen / Esc
Printer-friendly Version Interactive Discussion
Discussion
P
a
per
|
Dis
cussion
P
a
per
|
Discussion
P
a
per
|
Discussio
n
P
a
per
|
Wang, Y. J., Cheng, H., Edwards, R. L., He, Y. Q., Kong, X. G., An, Z. S., Wu, J. Y., Kelly, M. J., Dykoski, C. A., and Li, X. D.: The Holocene Asian monsoon: links to solar changes and North Atlantic climate, Science, 308, 854–857, 2005.
Wang, Y. J., Cheng, H., Edwards, R. L., Kong, X. G., Shao, X. H., Chen, S. T., Wu, J. Y., Jiang, X. Y., Wang, X. F., and An, Z. S.: Millennial- and orbital-scale changes in the East
5
Asian monsoon over the past 224 000 yr, Nature, 451, 1090–1093, 2008.
Yancheva, G., Nowaczyk, N. R., Mingram, J., Dulski, P., Schettler, G., Negendank, J. W., Liu, J. Q., Sigman, D. M., Peterson, L. C., and Haug, G. H.: Influence of the intertropical convergence zone on the East-Asian monsoon, Nature, 445, 74–77, 2007.
Yang, B., Braeuning, A., Yao, T. D., and Davis, M. E.: Correlation between the oxygen isotope
10
record from Dasuopu ice core and the Asian Southwest Monsoon during the last millennium, Quaternary Sci. Rev., 26, 1810–1817, 2007.
Yi, L., Yu, H. J., Ge, J. Y., Lai, Z. P., Xu, X. Y., Qin, L., and Peng, S. Z.: Reconstruc-tion of annual summer precipitaReconstruc-tion and temperature in north-central China since 1470 AD based on drought/flood index and tree-ring records, Climatic Change, 110, 469–498,
15
doi:10.1007/s10584-011-0052-6, 2012.
Zhang, D. E., Li, H. C., Ku, T. L., and Lu, L. H.: On linking climate to Chinese dynastic change: spatial and temporal variations of monsoonal rain, Chin. Sci. Bull., 55, 77–83, 2010.
Zhang, P. Z., Cheng, H., Edwards, R. L., Chen, F. H., Wang, Y. J., Yang, X. L., Liu, J., Tan, M., Wang, X. F., Liu, J. H., An, C. L., Dai, Z. B., Zhou, J., Zhang, D. Z., Jia, J. H., Jin, L. Y., and
20
Johnson, K. R.: A test of climate, sun, and culture relationships from an 1810-yr chinese cave record, Science, 322, 940–942, 2008.
Zhang, Q. Y.: The relationship between the east summer Asia monsoon and the india monsoon, in: East Asia Monsoon and Storm in China, edited by: Institute of Atmospheric Physics, Chinese Academy of Sciences, Meteorological Press, Beijing, 266–273, 1998.
25
Zhang, Q. Y. and Tao, S. Y.: East Asia tropical and subtropical monsoons in the summer and precipitation in Eastern China in wet season, J. Appl. Meteorol. Sci., 9(Suppl.), 16–23, 1998. Zhang, R. H.: Relations of water vapor transport from Indian monsoon with that over East Asia
and the summer rainfall in China, Adv. Atmos. Sci., 18, 1005–1017, 2001.
Zheng, J. Y., Wang, W. C., Ge, Q. S., Man, Z. M., and Zhang, P. Y.: Precipitation variability
30
CPD
8, 1275–1300, 2012Isotopic and lithologic variations
of precisely dated stalagmite
Y. F. Cui et al.
Title Page
Abstract Introduction
Conclusions References
Tables Figures
◭ ◮
◭ ◮
Back Close
Full Screen / Esc
Printer-friendly Version Interactive Discussion
P
a
per
|
Dis
cussion
P
a
per
|
Discussion
P
a
per
|
Discussio
n
P
a
per
|
Table 1.Uranium and thorium isotopic compositions and230Th ages for sample BD by ICP-MS. The corrected ages are indicated in bold.
Sample 238U 232Th 234U 230Th/238
U 230Th/232
Th Age (yr BP) Age (yr BP) Age (yr AD) (ppb) (ppt) (measured) (activity) (atomic×10−6
) (uncorrected) (corrected) (corrected)
BD-1 mm 9567±16 1428±29 49.5±2 0.0022 246±5 173±2 169±3 1781±3
BD-16 mm 7890±92 2060±8 48±7 0.0028 176±3 231±7 224±8 1726±8
BD-29 mm 6028±8 3902±78 51.9±2 0.0035 90±2 308±2 290±13 1660±13
BD-58 mm 7489±57 2397±8 42±5 0.0061 313±3 577±8 569±9 1381±9
BD-75 mm 8925±19 2518±51 46.1±2 0.0068 396±8 647±4 639±7 1311±7
BD-95 mm 7550±12 1873±38 49.8±2 0.0073 488±10 706±3 699±6 1251±6
BD-106 mm 8713±21 4296±87 43.8±2 0.0079 263±5 764±4 750±11 1200±11
BD-126 mm 7398±55 2517±8 41±5 0.0093 450±3 918±11 909±12 1041±12
BD-148 mm 8891±23 4702±95 42.1±2 0.0098 307±6 973±5 958±12 992±12
BD-192 mm 7943±12 2260±45 48.6±2 0.0105 607±12 1035±3 1027±7 923±7
BD-207 mm 7444±12 7468±150 49.9±2 0.0113 185±4 1118±20 1090±20 860±20
Errors are 2σanalytical errors. Decay constant values areλ230=9.1577×10⁻⁶yr−1,λ
234=2.8263×10⁻⁶yr−1,λ
238=1.55125×10⁻¹⁰yr−1. Corrected 230Th ages assume an initial230Th/232Th atomic ratio of (4.4
CPD
8, 1275–1300, 2012Isotopic and lithologic variations
of precisely dated stalagmite
Y. F. Cui et al.
Title Page
Abstract Introduction
Conclusions References
Tables Figures
◭ ◮
◭ ◮
Back Close
Full Screen / Esc
Printer-friendly Version Interactive Discussion
Discussion
P
a
per
|
Dis
cussion
P
a
per
|
Discussion
P
a
per
|
Discussio
n
P
a
per
|
Fig. 1. Global mean July precipitation (mm month−1
CPD
8, 1275–1300, 2012Isotopic and lithologic variations
of precisely dated stalagmite
Y. F. Cui et al.
Title Page
Abstract Introduction
Conclusions References
Tables Figures
◭ ◮
◭ ◮
Back Close
Full Screen / Esc
Printer-friendly Version Interactive Discussion
P
a
per
|
Dis
cussion
P
a
per
|
Discussion
P
a
per
|
Discussio
n
P
a
per
|
1
1cm
B
1mm
A C
1mm
Fig. 2. (A)polished surface of sample BD, showing lamination alternations of white-porous and dark-compact calcite.(B)A higher magnification view of the area in the green rectangle in(A), displaying annual layers in white-porous calcite. (C)A higher-magnification view of the area in the red rectangle in(A), showing the examples of annual layers preserved in dark-compact lamination.
CPD
8, 1275–1300, 2012Isotopic and lithologic variations
of precisely dated stalagmite
Y. F. Cui et al.
Title Page
Abstract Introduction
Conclusions References
Tables Figures
◭ ◮
◭ ◮
Back Close
Full Screen / Esc
Printer-friendly Version Interactive Discussion
Discussion
P
a
per
|
Dis
cussion
P
a
per
|
Discussion
P
a
per
|
Discussio
n
P
a
per
|
1 1
800 1000 1200 1400 1600 1800
220 200 180 160 140 120 100 80 60 40 20 0
Year (AD)
Distan
ce
fro
m th
e top (m
m)
Fig. 3.A230Th age model for the stalagmite BD. Black dots with error bars depict230Th dates with age errors less than 20 yr (Table 1). The chronology was constructed by linear interpolation between230Th dates.
CPD
8, 1275–1300, 2012Isotopic and lithologic variations
of precisely dated stalagmite
Y. F. Cui et al.
Title Page
Abstract Introduction
Conclusions References
Tables Figures
◭ ◮
◭ ◮
Back Close
Full Screen / Esc
Printer-friendly Version Interactive Discussion
P
a
per
|
Dis
cussion
P
a
per
|
Discussion
P
a
per
|
Discussio
n
P
a
per
|
1 1
-13.5 -13 -12.5 -12 -11.5 -11
-8.8 -8.6 -8.4 -8.2 -8 -7.8
a
b c d
e
f
0 2 4 6 8 10
-8.8 -8.6 -8.4 -8.2 -8 -7.8 -7.6
a b c d
e
f
Distance from growth axix (mm)
δ
18 O
(‰
, VPDB
)
δ13C (‰, VPDB)
δ
18 O
(‰
, VP
DB)
A B
Fig. 4.The Hendy Test for the stalagmite BD.(A)δ18O profiles along six growth layers (a to f) show no substantial isotopic fractionation.δ18O variations along the same layer are relatively small (<0.3 ‰) compared with the variations along the growth axis.(B)δ18O versusδ13C for growth layers a to f. Correlations betweenδ18O andδ13C are statistically insignificant.
CPD
8, 1275–1300, 2012Isotopic and lithologic variations
of precisely dated stalagmite
Y. F. Cui et al.
Title Page
Abstract Introduction
Conclusions References
Tables Figures
◭ ◮
◭ ◮
Back Close
Full Screen / Esc
Printer-friendly Version Interactive Discussion
Discussion
P
a
per
|
Dis
cussion
P
a
per
|
Discussion
P
a
per
|
Discussio
n
P
a
per
|
1
1 Depth (mm)
0 20 40 60 80 100 120 140 160 180 200 220
-7.2 -7.6 -8 -8.4 -8.8 -9.2
-10 -11 -12 -13 -14 -15
0 20 40 60 80 100 120 140 160 180 200 220
MWP LIA
140 120 100 80 60
0 50 100 150 200 250
δ
18O (‰
, V
PDB)
δ
13 C
(‰
, V
PDB)
Gr
ay
L
evel
Sr
(counts
/se
cond)
A
B
C
D
Fig. 5.Comparison between lithologic changes and multi-proxy records of stalagmite BD.(A)Sr record (counts/s, black curve);(B)Gray level record (green curve);(C)δ13C record (red curve);
(D)δ18O record (purple curve). The sample photo is shown in the center for comparison. The black, green and red arrows indicate the analysis tracks of Sr, gray level and stable isotope, respectively.
CPD
8, 1275–1300, 2012Isotopic and lithologic variations
of precisely dated stalagmite
Y. F. Cui et al.
Title Page Abstract Introduction Conclusions References Tables Figures ◭ ◮ ◭ ◮ Back Close
Full Screen / Esc
Printer-friendly Version Interactive Discussion P a per | Dis cussion P a per | Discussion P a per | Discussio n P a per | 1 1
1350 1400 1450 1500 1550 1600 1650 1700 1750 1800
-7.2 -7.6 -8 -8.4 -8.8 -9.2 -10 -11 -12 -13 -14 -15 160 140 120 100 80 60 0.6 0.4 0.2 0 -0.2 -0.4 -0.6
1350 1400 1450 1500 1550 1600 1650 1700 1750 1800
1 2 3 4 5 6 7 Dry Wet Wet Wet Wet 0 50 100 150 200 250
800 1000 1200 1400 1600 1800
-7.2 -7.6 -8 -8.4 -8.8 -9.2 -10 -11 -12 -13 -14 -15 MWP LIA Year (AD) δ
18O (‰
, V PDB) δ 13C (‰ , V PDB) Year (AD) δ
18O (‰
, V PDB) δ 13C (‰ , V PDB) Gr ay L evel Sr (counts /se cond) Rec onstru ct ion PI A B
CPD
8, 1275–1300, 2012Isotopic and lithologic variations
of precisely dated stalagmite
Y. F. Cui et al.
Title Page
Abstract Introduction
Conclusions References
Tables Figures
◭ ◮
◭ ◮
Back Close
Full Screen / Esc
Printer-friendly Version Interactive Discussion
Discussion
P
a
per
|
Dis
cussion
P
a
per
|
Discussion
P
a
per
|
Discussio
n
P
a
per
|
1 1
0 0.04 0.08 0.12 0.16 0.2
0 1 2 3 4 5 6
Spectrum 99% Confidence level
95% Confidence level
90% Confidence level
0 0.04 0.08 0.12 0.16 0.2
0 10 20 30
Spectrum
95% Confidence level 90% Confidence level
Frequency (yr-1) Frequency (yr-1)
Spectra
l amp
litude
(d
b)
Spectra
l amp
litude
(d
b)
A B
103 89
Fig. 7.Spectral analyses of theδ18O(A)andδ13C(B)records during LIA. Spectral peaks are labeled with their period (in yr). The spectra were calculated with software REDFIT (Schulz and Mudelsee, 2002).