(Annals of the Brazilian Academy of Sciences)
Printed version ISSN 0001-3765 / Online version ISSN 1678-2690
www.scielo.br/aabc
http://dx.doi.org/10.1590/0001-3765201520140064
Conservation of Forest Biodiversity: how sample size affects the estimation of genetic parameters
LEONARDO S. DA COSTA1, NATHANA S. CORNELEO2 and VALDIR M. STEFENON2
1Universidade Federal de Santa Maria, Centro de Ciências Rurais, Av. Roraima, 1000, 97105-900 Santa Maria, RS, Brasil 2Universidade Federal do Pampa, Campus São Gabriel, Av. Antonio Trilha, 1847, 97300-000 São Gabriel, RS, Brasil
Manuscript received on February 12, 2014; accepted for publication on November 25, 2014
ABSTRACT
Efficient designs are crucial for population genetic studies on forest species. In this study we employed individual based simulations aiming to evaluate what fraction of a population should be sampled to obtain confident estimations of allelic richness and of inbreeding coefficient in population genetic surveys. The simulations suggest that at least 10% of the total population has to be sampled to ensure reliable estimations of allelic richness and inbreeding coefficient. This approach will allow the confidence of the genetic parameters estimations of a larger number of populations, based on a minimal sample within each one.
Key words: sampling strategy, study design, allelic richness, inbreeding coefficient.
Correspondence to: Valdir Marcos Stefenon E-mail: [email protected]
INTRODUCTION
In order to survive under diverse environmental
conditions over decades, populations of long-lived
tree species require high allelic diversity. However,
despite the extensive concern on collecting data
about forest biodiversity towards genetic resources conservation, the confidence of such information is directly correlated with an efficient study design.
A biased design can generate unfair results, leading
to mistakes and wrong actions when making decisions about ecosystem conservation.
An efficient study design on population genetics
of forest species includes: (i) planning the number and geographical distribution of the populations, (ii)
the category and number of markers to be employed
and (iii) the spatial distribution and number of
individuals to be sampled within each population.
The number and geographical distribution of
the populations is directly linked to the general
distribution of the studied species and funds
allocated to the research. This step is usually easy
to plan and does not offer major challenges. The
kind of marker to be employed depends on the financial support owed to the research and on the main objective of the study (Gillet 1999). Usually, using a large number of highly polymorphic
markers is desired, taking in conside ration the dominant or co-dominant nature of the marker.
For instance, while a large number of amplified fragment length polymorphism (AFLP) loci were highly informative for the intra-population analysis of the genetic structure in Araucaria angustifolia, the large number of alleles observed
at few microsatellite markers was crucial for inter-population genetic structure analysis (Stefenon
Concerning spatial distribution and number of individuals, sampling a high number of individuals is preferred, expecting to acquire estimations as
close to the total population as possible. However, the sampling and analysis of an outsized number of
individuals belonging to a large natural population is
very complex, expensive and laborious. Therefore, determining the minimal sample size needed for reliable estimations of genetic diversity measures in large populations of tree species may significantly help plan genetic diversity inventories.
Estimations of heterozigosity are less influen-ced by the sample size (Nei and Roychoudhury 1974), while allelic richness and inbreeding coefficient are more dependent on the number of analyzed individuals. Considering that researchers usually work with samples of large populations, the effect of sample size in such estimations becomes an important matter. Many studies have focused
on the comparison of allelic richness estimations
among samples of different sizes (Nei et al. 1975, El Mousadik and Petit 1996, Spencer et al. 2000, Leberg 2002, Belkhir et al. 2006). However, only a few
studies (e.g. Bashalkhanov et al. 2009) have centered
on the effect of the sample size in the estimation of
the actual allelic richness of a population.
Allelic richness is one of the most important
measures of genetic diversity. Although it strongly depends on the effective population size and past evolutionary history (Cornuet and Luikart 1996),
the number of observed alleles also depends on
the sample size evaluated. The Ewens sampling
formula, the rarefaction, the coalescent and the
Bayesian approaches may provide theoretical
expectations for the allelic richness in a given
sample. However, these methods are based on the total number of alleles identified in a sample of the
basis population. Therefore, if the sampling scheme
is biased, the estimations are also deficient.
Aiming to overcome such difficulties, Bashalkhanov et al. (2009) defined a regression model
in order to estimate the allelic richness of large
populations, based on finite samples. Although this
model revealed to be robust, it still remains dependent on the studied species and the molecular marker used (see equations 4a, 5 and 5a in Bashalkhanov
et al. 2009). Here we employed individual based
simulations intending to evaluate the effects of
sample size on the assessment of allelic richness and estimation of inbreeding coefficient aiming to answer the question: which fraction of a population should be sampled to obtain confident estimations of genetic parameters using highly polymorphic genetic markers in population genetic surveys?
To carry out this study, genetic data was obtained
through simulation of a population comprising 1000
individuals and displaying information on diploid genotypes at 10 microsatellite loci, each reaching a maximal of 40 alleles. In order to evaluate the influence of the mating system (amount of selfing) in estimations of genetic parameters, populations with four different levels of inbreeding were simulated: f = 0.0 (completely random mating), f = 0.1 (10% of
selfing), f = 0.5 (50% of selfing) and f = 0.8 (80% of
selfing). These populations were generated through
stochastic individual-based simulations using the
software Easypop version 1.0 (Balloux 2001).
Measures of allelic richness (AR, computed as the
total number of alleles) and inbreeding coefficient
(f, computed according to Weir and Cockerham
1984) were estimated using the software Fstat version 2.9.3 (Goudet 1995). Both measures were
estimated for the 1000 individuals of the population and for sub-sets of 25, 50 and 100 individuals
randomly sampled within the total population. Each sub-set was re-sampled from the total population 99 times with replacement of individuals, totalizing 100
samplings. Mean values over the 100 estimations of
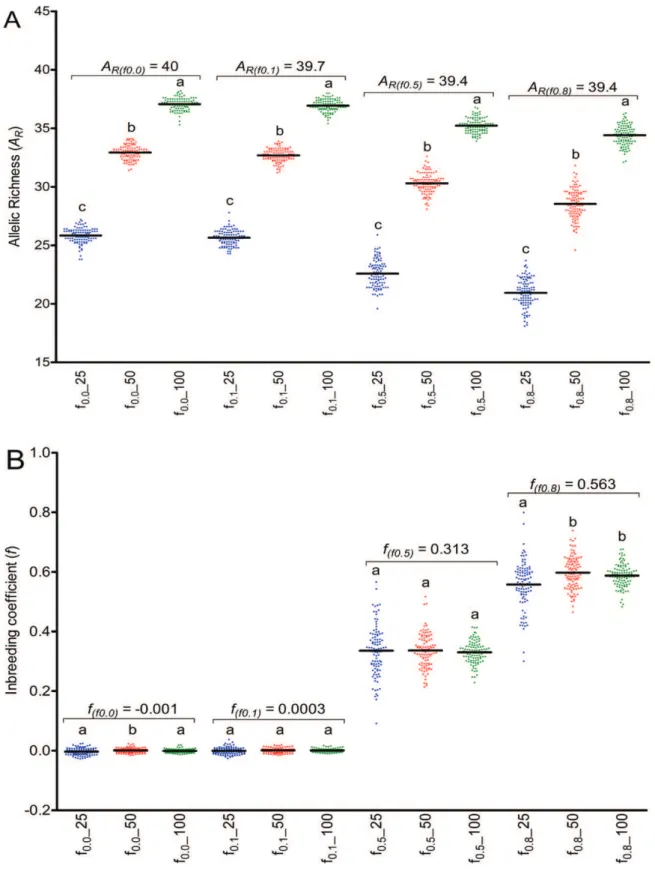
The estimations of allelic richness (Table I) were highly influenced by the sample size, with significant difference (p < 0.05, Fig. 1A) among
sub-sets, independent of the matting system. As expected, the larger sample size (100 individuals)
revealed the estimation of AR near to the actual
value of the basis population. The matting system influenced in the variation of individual repetitions
of the estimation (Fig. 1A), with higher variance for the samples with medium and high levels of selfing. These two mating systems also revealed lower estimations of AR for all sample sizes. The
loss of alleles ranged from 7.05% to 12.7% when 100 plants were sampled, while sampling 25 plants
lead to a loss of 35.5% to 46.9% of the alleles,
depending on the mating system (Table I).
TABLE I
Estimations of allelic richness (AR) and inbreeding coefficient (f) for sub-sets of the total population. Means, standard deviation and mode are presented for each parameter. Percentage of loss of allelic richness
in relation to the total populations is presented.
Mating system / Sample sizea
AR f
mean (% loss) sd mode mean sd mode
f0.0_total 40.0 -0.001
f0.0_25 25.8 (35.50%) 0.659 26.3 -0.003 0.011 -0.0137
f0.0_50 32.9 (17.75%) 0.593 32.9 0.001 0.004 0.0042
f0.0_100 37.1 (7.25%) 0.509 37.0 -0.0008 0.006 -0.007
f0.1_total 39.7 0.0003
f0.1_25 25.6 (35.50%) 0.641 26.2 -0.0004 0.011 -0.016
f0.1_50 32.7 (17.60%) 0.558 32.5 0.001 0.008 0.002
f0.1_100 36.9 (7.05%) 0.514 36.8 0.0009 0.006 -0.003
f0.5_total 39.4 0.313
f0.5_25 22.6 (42.60%) 1.139 21.8 0.336 0.084 0.364
f0.5_50 30.3 (23.10%) 0.846 30.6 0.336 0.057 0.273
f0.5_100 35.2 (10.60%) 0.609 35.4 0.330 0.037 n/d
f0.8_total 39.4 0.563
f0.8_25 20.9 (46.90%) 1.206 20.3 0.558 0.079 0.421
f0.8_50 28.5 (27.70%) 1.266 29.5 0.597 0.054 n/d
f0.8_100 34.4 (12.70%) 0.856 33.9 0.587 0.038 0.599
a
f0.0 represents the level of inbreeding in the simulated population (f = 0.0, f = 0.1, f = 0.5 and f = 0.8); total, represents the
values of the basis population, while 25, 50 and 100 represent the estimations of sub-sets of 25, 50 and 100 samples.
Concerning the estimations of inbreeding
coefficient, the size of the sample revealed low influence. Significant difference (p < 0.05, Fig. 1B) among sub-sets was observed just in two cases. Independent of the mating system, the estimated values were very similar to the actual inbreeding coefficient of the total population (Table I). However, the mating system highly influenced the
variance of the estimations (Fig. 1B).
These results suggest that for species with low to moderate amount of selfing (or mating among
relatives), at least 10% of the population should be
sampled in order to capture approximately 90% of the actual allelic richness. Populations with high level of selfing or mating among relatives (f = 0.8
in our study) need larger sampling, since collecting
10% of the population resulted around 13% of
alleles loss. The same pattern was obtained using
basis populations of 5000 and 200000 individuals
genetic breeding, the conservation of forest tree genetic resources aims to save the potential for adaptation (Eriksson 2005). Therefore, neglecting
some rare alleles seems not to be a drawback, considering that their low frequency is caused by
poor adaptation to the present environment (leading
them to be eradicated by selection) or because they recently emerged in the population as mutants that are in threat of loss by drift. Capturing such alleles in a large population would require sample sizes
close to the entire number of individuals in the population (Bashalkhanov et al. 2009).
Knowledge about species mating system and
inbreeding levels is also important for a consistent
sampling design. The influence of mating system in assessments of within-population gene diversity
(H) and between-population diversity (FST) has
been discussed (e.g. Hamrick et al. 1992, Nybom and Bartish 2000, Nybom 2004). Our study suggests that mating system and inbreeding level
are also important variables for estimations of allelic richness.
Several reviews of genetic studies propose that woody plants maintain high levels of variation within populations (H) and have relatively less genetic diversity among populations (GST) than
non-woody species (Hamrick et al. 1992). However,
allelic richness is the basis of population genetic
diversity and confident estimations of this parameter are crucial towards conservation of genetic resources
of forest tree species. Therefore, to ensure reliable estimates of allelic richness the sampling design of genetic inventories has to take into consideration
factors such the populations census size and the species mating system. Regarding the inbreeding coefficient, small sample sizes can generate reliable
estimations, considering that the standard deviation of the estimations overlapped the real values for all
sample sizes analyzed. Therefore, sampling at least
10% of the individuals from populations of tree
species should be considered when planning genetic studies. This design may provide estimations of the
adaptive potential of a larger number of populations,
based on a minimal sample within each one, capable of ensuring the confidence of the estimations.
ACKNOWLEDGMENTS
This research was made possible by the financial
support from Fundação de Amparo à Pesquisa do Estado do Rio Grande do Sul (FAPERGS,
Process no. 0902170) and Conselho Nacional de Desenvolvimento Científico e Tecnológico (CNPq,
Process no. 314664/2009-2 and 502804/2009-2).
LSC and NSC were sponsored by UNIPAMPA and
FAPERGS scholarships.
RESUMO
Desenhos eficientes são cruciais para estudos de genética de populações em espécies florestais. Neste estudo nós empregamos simulações baseadas em indíviduos objetivando avaliar qual fração de uma população deve ser amostrada para obter estimativas confiáveis de riqueza alélica e de coeficiente de endogamia em investigações de genética de populações. As simulações sugerem que ao menos 10% da população total deve ser amostrada para garantir estimativas confiáveis de riqueza alélica e de coeficiente de endogamia. Esta estratégia permitirá confiança nas estimativas de parâmetros genéticos de um maior número de populações, baseado em uma amostragem mínima em cada uma.
Palavras-chave: estratégia de amostragem, desenho de
estudo, riqueza alélica, coeficiente de endogamia.
REFERENCES
BALLOUX F. 2001. EASYPOP (version 1.7): a computer program for population genetics simulations. J Hered
92: 301-302.
BASHALKHANOV s, pANDEY M AND ROJORA o. 2009. A simple method for estimating genetic diversity in large populations from finite sample sizes. BMC Genetics 10: 84.
BELKHIR K, DAWSON KJ AND BONHOMME F. 2006. A Comparison of Rarefaction and Bayesian Methods for
Predicting the Allelic Richness of Future Samples on the
Basis of Currently Available Samples. J Hered 97: 483-492. CORNUET JM AND LUIKART G. 1996. Description and power of
EL MOUSADIK a AND pETIT RJ. 1996. High level of genetic
variation for allelic richness among populations of the argan tree [Argania spinosa (L.) Skeels] endemic to Marocco. Theor Appl Genet 92: 832-839.
ERIKSSON G. 2005. Evolution and evolutionary factors, adapta-tion and adaptability. In: Geburek T and Turok J (Eds),
Conservation and Management of Forest Genetic Resources in Europe. Arbora Publishers, Zvolen, p. 199-211.
GILLET EM. 1999. Which DNA Marker for Which Purpose? Final Compendium of the Research Project Development, optimization and validation of molecular tools for assessment of biodiversity in forest trees in the European Union DGXII Biotechnology FW IV Research Program Molecular Tools for Biodiversity. URL http://webdoc.sub. gwdg.de/ebook/y/1999/whichmarker/index.htm
GOUDET J. 1995. Fstat version 1.2: a computer program to calculate Fstatistics. J Hered 86: 485-486.
HAMRICK JL, GODT MJW AND sHERMAN-BROYLES sL. 1992. Factors influencing levels of genetic diversity in woody plant Species. N For 6: 95-124.
LEBERG pL. 2002. Estimating allelic richness: Effects of sample size and bottlenecks. Mol Ecol 11: 2445-2449.
NEI M, MARUYAMA t AND CHAKRABORTY R. 1975. The bottleneck effect and genetic variability in populations.
Evolution 29: 1-10.
NEI M AND ROYCHOUDHURY AK. 1974. Sampling variances of
heterozygosity and genetic distance. Genetics 76: 379-390. NYBOM H. 2004. Comparison of different nuclear DNA markers
for estimating intraspecific genetic diversity in plants.
Mol Ecol 13: 1143-1155.
NYBOM H AND BARTISH IV. 2000.Effects of life history traits and sampling strategies on genetic diversity estimates obtained with RAPD markers in plants. Perspect Plant Ecol Evol Syst 3: 93-114.
sPENCER CC, NEIGEL JE AND LEBERG pL. 2000. Experimental evaluation of the usefulness of microsatellite DNA for
detecting demographic bottlenecks. Mol Ecol 9: 1517-1528.
sTEFENON VM, GAILING o AND FINKELDEY R. 2008. The
role of gene flow in shaping genetic structures on the
subtropical conifer species Araucaria angustifolia. Plant Biol 10: 356-364.
WEIR Bs AND COCKERHAM CC. 1984. Estimating F-statistics for the analysis of population structure. Evolution 38: