Accuracy in the estimates of zucchini production related
to the plot size and number of harvests
Precisão nas estimativas de produção de abobrinha italiana relacionado ao tamanho da parcela e número de colheitas
Alessandro Dal’Col Lúcio1 Vilson Benz2
ISSNe 1678-4596
1Departamento de Fitotecnia, Centro de Ciências Rurais (CCR), Universidade Federal de Santa Maria (UFSM), 97105-900, Santa Maria, RS,
Brasil. E-mail: adlucio@ufsm.br. Corresponding author.
2Colégio Politécnico da Universidade Federal de Santa Maria, Universidade Federal de Santa Maria (UFSM), Santa Maria, RS, Brasil.
ABSTRACT: The productive variability in horticultural crops affects the planning and quality of the experiments, inflating the error and
leading to wrong conclusions with low experimental accuracy and reliability. The objective of this study was to dimension the plot size and number of harvests that are necessary so that there is improvement in the accuracy of zucchini production. The production data used was the one from the uniformity trials where the basic units (BU) were identified with the number of crop row and were numbered according to the position inside the row. With the values of individual production, (fresh fruit biomass) different plots sizes were simulated by summing up the adjacent BUs in the crop rows and the two forms of harvesting groups. For each plot size simulated and their respective harvests, a variation coefficient (%) was estimated at the crop row. A response surface design was applied, with a dependent variable in the variation coefficient and, with the independent variable, the plot size and number of harvests. Best combination between plot size and number of harvests is seven plants and half the productive cycle in both growing seasons.
Key words:Cucurbita pepo, uniformity trial, multiple regression.
RESUMO: A variabilidade produtiva em cultivos olerícolas afeta o planejamento e a qualidade de experimentos, inflacionando o erro e
levando a conclusões errôneas, com baixa precisão experimental e confiabilidade. O objetivo deste estudo foi dimensionar o tamanho da parcela e o número de colheitas necessárias para que haja melhoria da precisão nas estimativas de produção de abobrinha italiana. Foram utilizados dados de produção de ensaios de uniformidade em queas unidades básicas (UB) foram identificadas com o número da linha de cultivo e numeradas conforme a posição dentro da linha. Com os valores da produção individual (fitomassa fresca de frutos), foram simulados diferentes tamanhos de parcela somando as UBs adjacentes na linha de cultivo e duas formas de agrupamentos de colheita. Para cada tamanho de parcela simulado e suas respectivas colheitas, foi estimado o coeficiente de variação (%) na linha de cultivo. Foi aplicado o modelo de superfície de resposta, com variável dependente, o coeficiente de variação e, independentes, o tamanho de parcela e o número de colheitas. A melhor combinação entre o tamanho de parcela e o número de colheitas é de sete plantas e metade do ciclo produtivo, em ambas estações de cultivo.
Palavras-chave:Cucurbita pepo, ensaio de uniformidade, regressão múltipla.
CROP PRODUCTION
INTRODUCTION
Horticulture is a highly intensive activity in its most different aspects; it requires high technology and is in constant change, being more demanding regarding the quality of technical information than other areas.
Horticulture exploration is identified by the reduced size
of the occupied physical area, but it is highly used in both space and time (FILGUEIRA, 2003).
In the last decade, while the production
and productivity of vegetables in Brazil increased
33% and 38%; respectively, the area was reduced in
5%. The Southeast and South brazilian regions hold
three quarters of the production volume, while the Northeast and Midwest regions produced 25% of the total (MELO & VILELA, 2007).
Definitions of size, form of plot, number of repetitions, size of sample and experimental outline, among other characteristics, are directly influenced
by the variability inherent to the experiment (STEEL et al., 1997). This variability also interferes when
analyzing the results statistically, inflating the
experimental error estimate, leading the researcher to interpretations and conclusions that have low experimental accuracy and reliability in the results. Factors such as the presence or absence of fruits harvested, damages caused to the plants due to the harvesting, the heterogeneity of soil fertility, small differences in the amount of water for irrigation, differences in draining, trampling among the crop rows, occurrence of insect pests, diseases and weed,
are variability sources and should be minimized in the
performance of experiments in protected cultivation. Authors such as LOPES et al. (1998), LORENTZ et al. (2005), LÚCIO et al. (2008), CARPES et al. (2008) and COUTO et al. (2009)
have pointed out that there is a significant
variability between the crop rows and the harvests done, regardless of the horticulture assessed and
that such variability alters in a significant way the estimates of the sample sizes, types of sampling, size and form of plot, experimental outline and
enough number of harvests to better differentiate between the treatments studied.
One of the alternatives to evaluate the experimental area is the use of uniformity tests, also known as uniformity trials, where the area is cultivated throughout the length with a certain species and identical cultural practices, without applying treatments. After that, the area is divided in small plots, and the production of each plot is measured separately, in a way that the yield of plots
may be summed up to plot form of different sizes and
forms (STORCK et al., 2006). From data generated in uniformity trials, it is possible to identify the behavior of the productive variability among the plots and among the harvests.
There are several papers defining the
number of plants per plot in experiments with horticulture of multiple harvests (MELLO et al., 2004; LORENTZ et al., 2005; CARPES et al., 2010; LÚCIO et al. 2010; SANTOS et al., 2012). However,
there is a lack of papers that associate this size to the
number of harvests that should be done so that there is a smaller variability in the production data collected and, consequently, greater experimental accuracy. If the lowest variability is associated with a low number of harvests, it is possible to reduce the time necessary for the assessment of treatments, in case that is
possible, and it is not necessary to wait until the end of the crop cycle, saving time, resources and avoiding a situation where the variables collected are subject to greater variations in the observed values.
The objective of this study was to estimate
the plot size and number of harvests that are necessary
so that there is improvement in the accuracy of
zucchini fruits production estimates.
MATERIALS AND METHODS
The data used was from the uniformity trials, without the application of treatments, made
in protected cultivation with the crop of zucchini
(Cucurbita pepo), in the Crop Sciences Department at Federal University of Santa Maria, with coordinates 29º 43’ 23’’ S and 53º 43’ 15’’ Wand altitude of 95m. Two uniformity trials were carried out in a
greenhouse, using caserta cultivar. The first one in
the summer-autumn season and the second one in the winter-spring season, composed by eight rows of 20 plants, with a space of 0.9m between the plants and 1m between the rows, where each plant constituted a basic unit (BU). Fruits were harvested when presented the length of approximately18cm allowing
12 harvests in the first trial and 30 in the second one.
The number of harvests in the winter-spring season was greater because climatic conditions are more favorable for growth and fruits development.
In the trials, the BUs were identified with
the number of crop row and were numbered according to their position inside the row. With the values of individual production (fresh fruit biomass), different
plots sizes (1, 2, 4, 5, and 10) were simulated by
summing up the adjacent BUs in the crop rows and
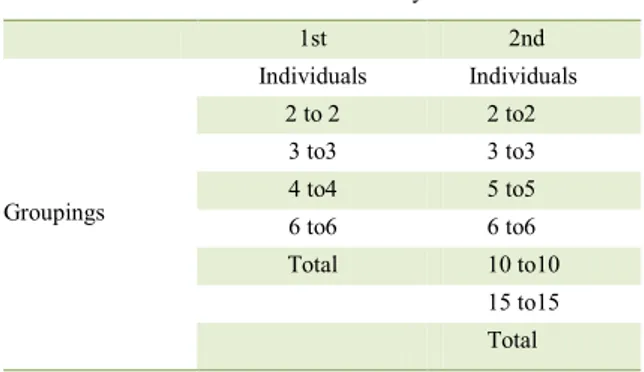
the two forms of harvesting groups. The first form of
grouping was with the sum of consecutive harvests, as follows: (1st), (1st + 2nd), (1st + 2nd + 3rd), ... until the
total of crop harvests is reached. The second form of grouping is described on table 1. Different forms of crop group were used in order to identify which of magnitude greater decrease in the percentage of nulls in fruit production and; therefore, to variability
in the data. For each plot size simulated and their respective harvests, a variation coefficient (%) was
estimated at the crop row.
To estimate the plot size and the number
of harvests necessary to reduce variability of the experiments, a second-order polynomial regression was used, described by Neter and Wasserman (1974) as: Y=b0+ b1X1 + b11X2
1 + b2X2 + b22X2 2 + b
12X1X 2+
coefficient between the plots inside the crop row and
X1 and X2, as independent variables, are respectively
the plot sizes simulated and harvests carried out.
The model was rewritten in matrix notation
, in which:
contains the values of the pair whose answer’s
estimate is desired; formed by the linear
coefficients of the equation; and,
is composed by the quadratic coefficients and linear
interaction of the model. For the estimated response surface a response function of the critical point was
estimated by . The maximum or
minimum nature of the critical point was identified
by the signal of the eigenvalues associated to the
matrix Â, that is, you find the values λ = (λ 1 λ2) so that the determinant of (Â – λ I) equals zero (I=
identity matrix). Parameters of regression equations were estimated by the least squares method, using the statistic package SOC (NTIA/EMBRAPA, 1989).
RESULTS AND DISCUSSION
Through the second-order polynomial equation, it was possible to identify the critical
point that minimizes the variation coefficient of the zucchini fresh fruit biomass for the combination of independent variables, plot size and harvesting group. Generally, plot size varied approximately
from six to eight basic units in both growing seasons and the harvesting group was from seven to 17 in the
summer-autumn season and winter-spring season, respectively (Table 2).
Models obtained with the first form of grouping always provided lower determination coefficients (R²) when compared to the second form of grouping, regardless of the cultivation season (Table 2). According to HAIR et. al. (2009), R² is the proportional measurement of the variance of the dependent variable around its mean, which is explained by the independent variables and, if the regression model is properly applied and estimated, the researcher may presume that the higher the value of R², the higher the power of explanation of the regression equation and the higher the power to predict the dependent variable. In this case, the models estimated with the second form of grouping have a higher power of explanation compared to the first one.
The higher value of R² in the second form of grouping is related to the number of observations because, as an example, when grouping the harvests
two by two in the first crop there is a total of 48 values of VC and in the first form of grouping, there are
eight VC values. The use of a greater number of VC values of the rows resulted in a lower variability in the estimated model and; therefore, a higher R².
As expected, in the smaller plots and
harvesting groups, the highest variation coefficient
values were reported. There is a VC reduction with
the increase of the plot size and with the increase in
the number of harvests that the VC reduces in the intermediate groupings.
The point that minimizes the VC is located in plot sizes and intermediate harvests. In
the summer-autumn season, with the grouping of
seven harvests, it is characterized as practically
half the productive cycle (12 harvests) and in the winter-spring season, with groups of 17 harvests, it is also practically half of the cycle (30 harvests). This result indicate that as harvests go by, the
production of plants tends to homogenize and that
the beginning and the end of the productive periods are the moments in which the fruits fresh mass has higher variability within the crop rows.
CARGNELUTTI FILHO et al. (2004) reported higher values of VC in the beginning and in the end of the harvests of tomatoes because in those development stages, the beginning and end of the fruit production are not uniform among the plants and; consequently, alternate their productions. LÚCIO et al. (2010), also with tomatoes, seen that the bigger production of fruits is focused mainly at half productive cycle and that in the end of the cycle the
Table 1 - Harvesting groups simulated for the crops of zucchini.
---Uniformity
trials---1st 2nd
Groupings
Individuals Individuals
2 to 2 2 to2
3 to3 3 to3
4 to4 5 to5
6 to6 6 to6
Total 10 to10
variability increases due to the physiological aspects of the plant because they go to a senescence state.
FEIJÓ et al. (2005) when assessing different intervals of the harvest saw that the use
of the initial half of the zucchini productive period
in a greenhouse and six plants by plot are enough to estimate the experimental error. This result agrees with what was observed, suggesting that the intermediate harvests are more homogeneous and
that its use with an appropriate plot size increases the
experimental accuracy.
In all the cases, it was possible to identify the VC minimum point. It is observed that there
was a rapid reduction of the variation coefficient
due to the accumulation of few harvests or small
increase of the plot size used. This is because many
times the plants do not have fruits or they are not appropriate for being harvested yet, resulting in null values of production and increasing variability inside the crop rows. LÚCIO et al. (2010) also
realized that there was a reduction in the magnitude of this indicator of accuracy due to e filling out of
gaps formed by plants that were not harvested, resulting in the increase of the mean.
There was a difference in the number of total harvests on both cultivation seasons (in the
first season with twelve harvests and in the second with 30 harvests). This difference influenced mainly the definition of better grouping of harvests to be
used, indicating that in times that are favorable for cultivation, where there is great growth and fruit production, there is the need for conducting the highest number of harvests so that there is a reduction in the variability between the plots in the crop rows. According to FILGUEIRA (2003), the crops of
zucchini produced and developed better when the
temperatures are mild; cold is not favorable while
elevated temperatures harm the pollination and compromise productivity. Authors such as LÚCIO et al. (2008) and CARPES et al.(2010) saw differences
in productivity of zucchini among experiments in
several cultivation seasons, attributing as the main factor the variability that exists in the sunshine and in the air mean temperature during the performance of the experiments. STRASSBURGER et al. (2011),
assessing the dynamics of growing zucchini, seen that
the availability of solar radiation of the cultivation period affects strongly the production and distribution of dry matter, as well as all the growth indexes of the
crops of zucchini, and the growth rates of the crop and
fruits are higher when the solar radiation is higher. For the second cultivation season (winter/ spring), generally, the values of VC in the response
surface were smaller than the first season (summer/ autumn). Like in the first season of cultivation, there
was a smaller number of harvests and few of them were said as intermediate, which possibly are the most uniform in production. Reduction of VC was also always higher in the second form of grouping harvests, and this possibly attributed to the way in which the groups were formed, enabling intermediate harvests to be included in a smaller number of plots and number of harvests.
Usually, when considering the crop rows
as blocks, the definition of plot size is made through
the multiple of the number of basic units available inside the rows. Considering the VC minimum point reported in both cultivation seasons, the closest
dimensions that can be used, in this situation, are five
or ten basic units. However, when choosing the bigger
plot size, there will be fewer of them available for
the application of treatments. In this scenario, the use
plot of five basic units and the performance of seven
to 17 harvests for the summer-autumn and
winter-Table 2 - Polynomial equations of second degree adjusted and their respective determination coefficients (R²) in two cultivation seasons of
zucchini (Cucurbita pepo) (S), in two forms of grouping (G), with a critical point of minimum to the plot size (X1)and harvesting
group (X2).
S1 G2 ---Fitted equation--- X
1 X2 R² 1 1 VC% = 194.228 - 21.615 X
1 + 1.135 2 1
X - 28.086 X
2 + 1.498 2 2
X + 0.636 X
1X2 7.32 7.81 0.70 1 2 VC % = 205.968 - 30.910 X
1 + 1.777 2 1
X - 30.897 X
2 + 1.610 2 2
X + 1.046 X
1X2 6.49 7.48 0.90 2 1 VC % = 135.577 - 13.959 X
1 + 0.618 2 1
X - 10.098 X
2 + 0.231 2 2
X + 0.246 X
1X2 7.76 17.65 0.58
2 2
VC % = 123.876 - 19.345 X1 + 1.094 2 1
X - 10.035 X 2 + 0.230
2 2
X + 0.379 X
spring seasons, respectively, would be the most
efficient combinations for the reduction of variability in the production estimates with greater utilization of
protected environment, time and resources. In case the researcher is interested in the total of harvests, it is possible to see that the reduction of VC is sharper in plots of four and eight basic units where there is
certain variability stabilization; in this case, the use of plots formed by five BUs continues to be a good strategy. However, the researcher will find greater
variability in the production comparing to the use of a smaller number of harvests.
CONCLUSION
The best combination between the plot size
and the number of harvests to obtain smaller values
for the variation coefficient is of seven plants and half
the productive cycle in winter/spring and summer/ autumn cultivation seasons.
ACKNOWLEDGEMENTS
We would like to thank the financial support of the Conselho Nacional de Desenvolvimento Científico e Tecnológico
(CNPq/Brasil).
REFERENCES
CARGNELUTTI FILHO, A. et al. Número de colheitas e
comparação de genótipos de tomateiro cultivados em estufa de
plástico. Pesquisa Agropecuária Brasileira, v.39, p.953-959, 2004.Available from: <http://www.scielo.br/scielo.php?script=sci_ arttext&pid=S0100-204X2004001000002>. Accessed: Nov. 02, 2014. doi: 10.1590/S0100-204X2004001000002.
CARPES, R.H. et al. Ausência de frutos colhidos e suas
interferências na variabilidade da fitomassa de frutos de abobrinha
italiana cultivada em diferentes sistemas de irrigação. Revista Ceres, v.55, p.590-595, 2008. Available from: <http://www.ceres. ufv.br/ojs/index.php/ceres/article/view/3377/1267>.Accessed: Jan. 15, 2015.
CARPES, R.H. et al.Variabilidade produtiva e agrupamentos de colheitas de abobrinha italiana cultivada em ambiente protegido.
Ciência Rural, v.40, p.294-301, 2010.Available from: <http://www. scielo.br/scielo.php?pid=S0103-84782010000200007&script=sci_ arttext>. Accessed: Nov. 07, 2014. doi: 10.1590/S0103-84782010005000007.
COUTO, M.R.M. et al. Transformação de dados em experimentos com abobrinha italiana em ambiente protegido. Ciência Rural, v.39, p.1701-1707, 2009. Available from: <http://www.scielo.br/ scielo.php?script=sci_arttext&pid=S0103-84782009000600011>. Accessed: Feb. 22, 2015. doi: 10.1590/S0103-84782009005000110. FEIJÓ, S. et al. Repetibilidade da produção de frutos de abobrinha italiana. Revista Brasileira de Agrociência, v.11, p.39-43, 2005.
Available from: <https://periodicos.ufpel.edu.br/ojs2/index.php/ CAST/article/viewFile/1165/960>. Accessed: Nov.20, 2008. FILGUEIRA, F.A.R. Agrotecnologia moderna na produção
e comercialização de hortaliças. In: _____. Novo manual de
olericultura. 2.ed.Viçosa: UFV, 2003.412p.
LOPES, S.J. et al. Técnicas experimentais para tomateiro tipo salada sob estufas plásticas. Ciência Rural, v.28, p.193-197, 1998. Available from: <http://www.scielo.br/scielo.php?script=sci_artte xt&pid=S0103-84781998000200002>. Accessed: Jan. 26, 2013. doi: 10.1590/S0103-84781998000200002.
LORENTZ, L.H. et al. Variabilidade da produção de frutos de pimentão em estufa plástica. Ciência Rural, v.35, p.316-323, 2005. Available from: <http://www.scielo.br/scielo.php?pid=S0103-84782005000200011&script=sci_arttext>. Accessed: Jul. 05, 2014. doi: 10.1590/S0103-84782005000200011.
LÚCIO, A.D. et al.Variância e média da massa de frutos de abobrinha-italiana em múltiplas colheitas. Horticultura Brasileira, v.26, p.335-341, 2008. Available from: <http://www.scielo. br/scielo.php?pid=S0102-05362008000300009&script=sci_ arttext>. Accessed: May 02, 2013. doi: 10.1590/S0102-05362008000300009.
LÚCIO, A.D. et al. Agrupamento de colheitas de tomate e estimativas do tamanho de parcela em cultivo protegido. Horticultura Brasileira, v.28, p.190-196, 2010. Available from: <http://www.scielo.br/ scielo.php?script=sci_arttext&pid=S0102-05362010000200009>. Accessed: Dec. 05, 2014. doi: 10.1590/S0102-05362010000200009. MELO, P.C.T.; VILELA, N.J. Importância da cadeia produtiva brasileira de hortaliças. In: REUNIÃO ORDINÁRIA DA CÂMARA SETORIAL DA CADEIA PRODUTIVA DE HORTALIÇAS, 13., 2007, Brasília, DF. Anais... MAPA: Brasília, 2007. Available from: <http://www.abhorticultura.com.br/downloads/cadeia_produtiva. pdf>. Accessed:May 12,2012.
MELLO, R.M. et al. Size and form of plots for the culture of
the italian pumpkin in plastic greenhouse. Scientia Agricola, v.61, p.457-461, 2004.Available from: <http://www.scielo. br/scielo.php?pid=S0103-90162004000400017&script=sci_ arttext>. Accessed: Ago. 13, 2014. doi: 10.1590/S0103-90162004000400017.
NTIA/EMBRAPA. Núcleo tecnológico para informática. SOC -
Software científico. Campinas, 1989. 548p.
SANTOS, D. et al.Tamanho ótimo de parcela para a cultura do
feijão-vagem. Revista Ciência Agronômica, v.43, p.119-128, 2012. Available from: <http://www.scielo.br/scielo.php?script=sci_artte xt&pid=S1806-66902012000100015>. Accessed: May 18, 2015. doi: 10.1590/S1806-66902012000100015.
STEEL, R.G.D. et al. Principles and procedures of statistics: a biometrical approach. New York: McGraw- Hill, 1997. 666p. STORCK, L. et al. Experimentação vegetal. Santa Maria: UFSM, 2006. 198p.