Article
J. Braz. Chem. Soc., Vol. 22, No. 6, 1156-1163, 2011. Printed in Brazil - ©2011 Sociedade Brasileira de Química 0103 - 5053 $6.00+0.00
A
*e-mail: [email protected]
Risk Simulation of Soil Contamination by Polycyclic Aromatic Hydrocarbons from
Sewage Sludge used as Fertilizers
Lourival C. Paraíba, Sonia C. N. Queiroz,* Débora R. C. de Souza and Maria L. Saito
Embrapa Meio Ambiente, Rodovia SP 340, km 127,5, Tanquinho Velho, CP 69, 13820-000 Jaguariúna-SP, Brazil
Este trabalho investigou a presença de 16 hidrocarbonetos policíclicos aromáticos (HPAs) em lodo de esgoto e em solo com aplicação de lodo como fertilizante agrícola e simulou o risco de contaminação por HPAs a longo prazo. As amostras foram extraídas usando diclorometano e em seguida com n-hexano em banho ultrassônico. A limpeza do extrato foi feita em coluna de alumina. As quantiicações dos HPAs foram obtidas por cromatograia gasosa acoplada a um espectrômetro de massas (GC-MS/MS ion trap). Os resultados evidenciaram que HPAs encontrados em lodos de esgoto podem apresentar risco de contaminação de solos. As simulações das concentrações dos HPAs no solo por meio de modelos matemáticos foram utilizadas para indicar uma ordem de prioridade para monitoramento da qualidade do solo: fenantreno > criseno > benzo(k)luoranteno > benzo(a)pireno > pireno > benzo(b)luoranteno > benzo(g,h,i)perileno > indeno(1,2,3-c,d)pireno > luoranteno > benzo(a)antraceno > dibenzo(a,h)antraceno > luoreno > antraceno > naftaleno > acenafteno > acenaftileno.
This work investigated the presence of PAH in sewage sludge and in soil with sewage sludge applied as agricultural fertilizer and simulated a long-term risk of soil contamination by PAH. The samples were extracted using dichloromethane and then with n-hexane in ultrasonic bath. The clean-up of the extract was done on a column containing alumina. The residual PAH were obtained using a gas chromatograph coupled to a mass spectrometer (ion trap GC-MS/MS). The results evidenced that PAH concentration levels found in sewage sludge might raise potential contamination risks to the soil. Simulations of the concentrations of PAHs in soil, by mathematical modeling, allowed to indicate a priority order for monitoring soil quality in terms of these contaminants: phenanthrene > chrysene > benzo(k)luoranthene > benzo(a)pyrene > pyrene > benzo(b)luoranthene > benzo(g,h,i)perylene > indeno(1,2,3-c,d)pyrene > luoranthene > benzo(a)-anthracene > dibenzo(a,h)benzo(a)-anthracene > luorene > benzo(a)-anthracene > naphthalene > acenaphthene > acenaphthylene.
Keywords:sewagesludge, PAH, biosolid, ion trap GC-MS/MS, soil contamination
Introduction
Polycyclic aromatic hydrocarbons (PAHs) are a group of non-polar hydrophobic organic compounds comprised of two or more fused aromatic rings.
Due to their toxic, mutagenic, estrogenic, and/or carcinogenic properties, sixteen PAH compounds have been identiied as pollutants by the US-EPA1 and seven
of them are considered carcinogenic.2 For this reason,
these organic pollutants are considered the most toxic to aquatic and terrestrial life and of high priority in environmental studies: acenaphthene, acenaphthylene, anthracene, benzo(a)anthracene, benzo(a)pyrene, benzo(b)
luoranthene, benzo(g,h,i)perylene, benzo(k)luoranthene, chrysene, dibenzo(a,h)anthracene, luoranthene, luorene, indeno(1,2,3-c,d)pyrene, naphthalene, phenanthrene and pyrene.
Human exposure to PAHs may occur via processed foods, contaminated water and green vegetables. Fismes
et al.3 demonstrated that lettuce, potato and carrot plants
can absorb PAHs from contaminated soils. Camargo and Toledo4 found signiicant PAH levels in grapes, apples,
pears, tomatoes, cabbages and lettuces grown in Brazilian rural areas nearby urban centers. Zohair et al.5 observed
PAH-contaminated potatoes and carrots from plants grown in organic cultivation systems. Farhadian et al.6 studied
grilled followed by lame-gas and oven grilled dishes. Kulhánek et al.7 used models, statistical regressions and
the PAH bioconcentration factors in foods to estimate the risk of human PAH intake via contaminated fruits, tubers and vegetables, in order to regulate the maximum food PAH level in the European Community. Collins et al.8 described
the main processes involved in the organic compound (including PAHs) accumulation by roots, leaves and fruits. Chouychai et al.9 studied the phenanthrene and pyrene
phytotoxicity in corn and peanut plants and concluded that corn plants can be used to phytoremediate contaminated soils, meaning that corn plants are able to take up and accumulate several PAHs from soil solution.10
Sewage sludge (SS) is a complex organic by-product of the wastewater treatment process. Large amounts of SS are constantly produced and the disposal routes are a matter of worldwide concern and environmental problem. This material is supposed to be potentially useful in agricultural land amendment or degraded area recovery due to its rich nutrient composition, especially in organic matter (OM), nitrogen (N) and phosphorus (P).11 However, there are risks
and beneits associated with SS use in soils, since it contains not only OM, N and P, but also metals, microorganisms and pollutant organic compounds such as the PAHs.12-14
In general, the pollutant substances are associated with uncontrolled mixtures of domestic and industrial wastes or with the waste treatment process.15 Sewage sludge used as
fertilizers might contaminate crops, soils, supericial and underground waters with nitrates, heavy metals, pathogens, various classes of organic compounds and persistent organic compounds.14,16,17 In Brazil, the use of SS in agriculture is
regulated through the directive CONAMA357/2005.18
There is little information in the literature about PAH uptake by plants from SS-treated soils. Evidences of plant accumulation of organic contaminants as a result of continuous SS-addition to agricultural soils were reported, showing positive correlations between PAH concentrations of shoots, roots and the soil where plants were grown.15,19
Oleszczuk and Baran19 investigated during three years the
PAH absorption by Salix viminalis and concluded that the residue concentrations found in leaves and stems were associated with the PAH content of SS added to the soil as fertilizers. The continuous PAH accumulation in soils as a consequence of the various human activities15,20 is
also a matter of great concern and represents risk of plant contamination.19,21
Many PAHs were found in SS samples obtained from Wastewater Treatment Plants in Brazilian cities.13 In the
State of São Paulo, the use of SS in agriculture is regulated through the technical directive P4230, created by CETESB22 -
a government environmental sanitation agency - which
limits the residue disposal in soils, according to the heavy metal and nitrogen soil contents, the crop nutrient demands and the soil nitrogen mineralization rate.
Dreher23 investigated organic pollutant contamination in
agricultural soils treated with SS and found high organotin and PAH concentrations in three of eleven cultivated ields and two other experimental plots. In another ield, high dioxin concentrations were found. These studies evidenced that SS-organic pollutants might persist for years in the soil. Among the pollutants, Dreher23 studied the classes of PAHs,
polychlorinated biphenyls, chloride pesticides, dioxins and furans, octil-nonylphenols, polycyclic mixtures, phthalates, polybrominated diphenyl ethers, organotins, linear alkylbenzene sulfonates, bisphenols, pharmaceutical products and heavy metals. Krogmann24 and Paraíba and
Saito25 pointed out the need of continuous organic pollutant
monitoring in sewage sludges from different origins. Along with this land application of sewage sludge, PAHs, pharmaceuticals and other contaminants can be introduced to soils, having the potential to be transported to surface water and groundwater. Anthropogenic organic contaminants, including several PAHs, have been found in soils amended with sewage sludges.17
Experimentally validated mathematical models can demonstrate or predict the soil contamination with persistent organic pollutants from SS continuously used as agricultural fertilizer. Physicochemical characteristics such as water solubility, lipid afinity, vapor pressure, soil organic carbon sorption and half-life of organic compounds allow developing mathematical models that can predict risks of soil contamination by continuous SS applications.
This research is based on the hypothesis that sewage sludges (SS) contain persistent organic pollutants (POPs) belonging to the polycyclic aromatic hydrocarbon (PAH) class and that POPs may accumulate in SS-fertilized soils. The objective of this study was to assess the presence of sixteen selected PAHs of concern to be monitored in soil and sewage sludges, according to US-EPA.1 Methods
of residue analysis using a gas chromatograph coupled to an ion trap mass spectrometer (CG-MS/MS) were developed for the determination of selected PAHs in soil and SS samples. Soil samples were obtained from a ield experimental area of Embrapa Meio Ambiente (Embrapa Environment), where a long-term experiment was carried out with corn plants grown in soils amended with SS for six consecutive years.11,14,26
Experimental
haplustox) at the ield station of Embrapa Environment, at Jaguariúna City, São Paulo State, Brazil (22º 41’S latitude, 47º W longitude and 570 m altitude). The PAH residue determinations in soil and SS samples were made in the Laboratory of Residues and Contaminant of Embrapa Environment.
Nine experimental plots of 10 × 20 m cultivated with corn plants were used. The experiment was arranged in randomized complete blocks with three replications. Treatments consisted of three SS rates: (i) control plots (without SS or mineral fertilizer-STEST); (ii) plots treated with 28.15 t ha-1 of SS, correspondent to one
regular nitrogen (N) rate for corn crop provided by mineral fertilization (SDL1N); and (iii) plots treated with 225.2 t ha-1 of SS, correspondent to 8-fold the regular
N rate for corn crop provided by mineral fertilization (SDL8N). The SS rates were calculated to supply the crop demand, based on the SS-N concentration supposing a 30% N mineralization rate,26 and on the soil available
N concentration. The SS rates were complemented with potassium (K), according to the plant K demand, added as mineral fertilizer (KCl).
The sewage sludge used in the experiments was obtained from the municipal Sanitation Plant of Franca, State of São Paulo, Brazil. Three to four days before maize sowing, the SS rates were manually applied to the ield plots (SDL1N and SDL8N) and incorporated up to 15 cm depth by hoeing. Six soil samples were collected from each of the
nine experimental plots (STEST, SDL1N and SDL8N) at 10-15 cm depth surface layer, where maize roots are most concentrated. A total of ifty four soil samples were air dried at room temperature and passed through 1mm screen sieves. Samplings were taken 24 h after SS application and before maize sowing.
The soil characteristics determined in the STEST, SDL1N and SDL8N plots at 10-15 cm depth layer were as follows: ield capacity θ = 0.30 m3 m-3, organic carbon =
0.015 g g-1, dry soil density ρ
Sd = 1.25 kg L
-1, humid soil
density ρSw = 1.5 kg L-1 and total porosity δ = 0.55 m m-3.
These soil characteristics were used in the analysis and simulation model to obtain the risk of soil contamination by PAHs from successive yearly SS application rates.
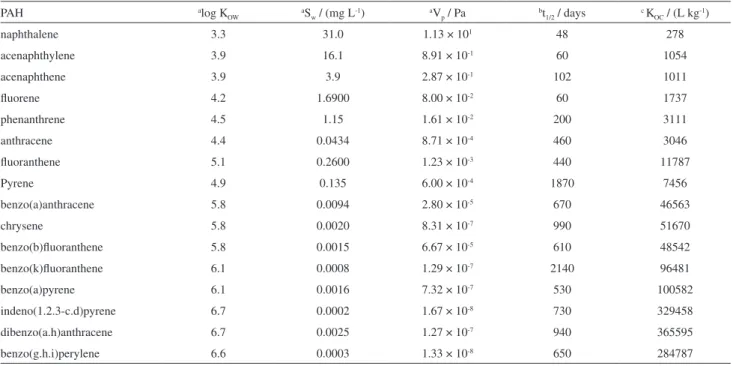
The results of soil and SS sample analysis are shown in Table 1, referred to the following PAH physical characteristics: base 10-logarithm of octanol-water partition coeficient (log KOW), molar mass (Mw g mol
-1), water
solubility (Sw mg L-1), vapor pressure (Vp Pa), half-life
in the soil (t1/2days), and the soil organic carbon sorption
coeficient (KOC).
Analytical methods for PAH determination in soil and sewage sludge samples
Methods for PAH residue determination in soil and SS samples were developed and validated by gas chromatography coupled to an ion trap mass spectrometry
Table 1. Polycyclic aromatic hydrocarbon (PAH) logarithm of octanol-water partition coeficient, water solubility, vapor pressure, half-life in soil and sorption coeficient in soil organic carbon (16 PAHs)
PAH alog K
OW aSw / (mg L-1) aVp / Pa bt1/2 / days c KOC / (L kg-1)
naphthalene 3.3 31.0 1.13 × 101 48 278
acenaphthylene 3.9 16.1 8.91 × 10⁻¹ 60 1054
acenaphthene 3.9 3.9 2.87 × 10⁻¹ 102 1011
luorene 4.2 1.6900 8.00 × 10⁻² 60 1737
phenanthrene 4.5 1.15 1.61 × 10⁻² 200 3111
anthracene 4.4 0.0434 8.71 × 10⁻⁴ 460 3046
luoranthene 5.1 0.2600 1.23 × 10⁻³ 440 11787
Pyrene 4.9 0.135 6.00 × 10⁻⁴ 1870 7456
benzo(a)anthracene 5.8 0.0094 2.80 × 10⁻⁵ 670 46563
chrysene 5.8 0.0020 8.31 × 10⁻⁷ 990 51670
benzo(b)luoranthene 5.8 0.0015 6.67 × 10⁻⁵ 610 48542
benzo(k)luoranthene 6.1 0.0008 1.29 × 10⁻⁷ 2140 96481
benzo(a)pyrene 6.1 0.0016 7.32 × 10⁻⁷ 530 100582
indeno(1.2.3-c.d)pyrene 6.7 0.0002 1.67 × 10⁻⁸ 730 329458
dibenzo(a.h)anthracene 6.7 0.0025 1.27 × 10⁻⁷ 940 365595
benzo(g.h.i)perylene 6.6 0.0003 1.33 × 10⁻⁸ 650 284787
aData obtained in SRC, Inc.;27 bfrom Howard et al.;28cestimated by log K
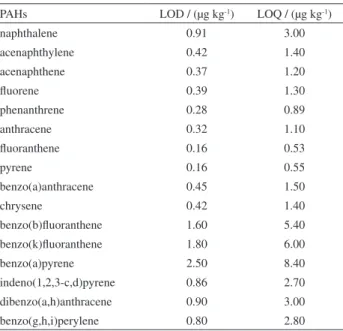
(GC-MS/MS). The proposed methods were validated through the parameters of linearity, limit of detection (LOD), limit of quantiication (LOQ), accuracy (recovery) and precision (repetitiveness and intermediary precision). The LOD and LOQ values in soil and SS samples are presented in Table 2.
Linear equipment response was obtained for all PAH compounds in speciic concentration ranges, due to the differences among analytes for the equipment detection limits. Linear concentration ranges were obtained for acenaphthene, acenaphthylene, fluorene, phenanthrene, anthracene, luoranthene and pyrene concentrations between 0.005 µg mL-1 and 0.6 µg mL-1; for naphthalene between
0.008 µg mL-1 and 0.4 µg mL-1; for benzo(a)anthracene,
crysene, benzo(b)luoranthene and benzo(k)luoranthene between 0.008 µg mL-1 and 0.6 µg mL-1; and for
benzo(a)-pyrene, indeno(1,2,3-c,d)benzo(a)-pyrene, dibenzo(a,h)anthracene and benzo(g,h,i)perylene between 0.025 µg mL-1 and 0.6 µg mL-1.
Standards and reagents
A standard solution obtained from ChemService (West Chester, PA, USA) was used, prepared in dichloromethane: benzene (50:50, v/v) and containing 2.000 µg mL-1 of
each PAH studied, that is, naphthalene, acenaphthalene, acenaphtene, fluorene, phenanthrene, anthracene, fluoranthene, pyrene, benzo(a)anthracene, chrysene, benzo(b)luoranthene, benzo(k)luoranthene, benzo(a)-pyrene, dibenzo(a,h)anthracene, benzo(ghi)perylene and
indeno(1,2,3-c,d)pyrene. Dichloromethane and n-hexane (pesticide residual degree) were obtained from Tedia Company Inc.; anhydrous sodium sulfate from J.T. Baker; and alumina (80-200mesh) from Fisher Scientiic.
PAH extraction and clean-up
10 g of dry soil or SS sample were transferred to 250 mL-centrifuge tubes; 20 mL of dichloromethane (DCM) was added and the sample was shaken in a sonic shaker for 30 min, centrifuged and the organic supernatant was preserved; this procedure was repeated with 20 mL of
n-hexane; the collected organic extract was submitted to evaporation to reduce the volume to 3 mL using a Syncore Analyst from Buchi. For the clean-up procedure, the soil or SS-extract was transferred to 1.5 cm diameter glass column containing 2 g of alumina (activated Al2O3) and 1.0 g of
anhydrous sodium sulfate (Na2SO4). The PAHs were eluted
with 10 mL of n-hexane: DCM (19:1, v/v), and after, with 15 mL of n-hexane: DCM (1:2, v/v).30 All the percolate was
collected and evaporated to reduce the volume to 1 mL.
PAH quantiication and validation of methods
The method of external standardization was used for the PAH quantiication. Standard stock solutions containing 80 mg L-1 of each PAH were prepared in dichloromethane.
And these stock solutions were diluted to prepare the standard solutions (1.0 mg L-1) also in dichloromethane.
Afterwards, the work solutions were prepared by means of successive dilutions in n-hexane and they were used to determine the detector linearity, fortify samples and obtain the standard analytical curves.
Samples from the soil control treatment were submitted to extraction procedures in three different days and duplicated for each fortiication level. For the recovery step, the soil samples without SS-addition were fortiied with 10 µg kg-1, 20 µg kg-1 and 50 µg kg-1 of a mixture of
the sixteen PAHs in order to evaluate the method accuracy (recovery) and precision (repetitiveness and intermediary precision).
Sample analysis by ion trap GC-MS
Sixteen PAHs were analyzed using a gas chromatograph - model 3900 - coupled to an ion trap mass spectrometer model Saturno 2100T, both from Varian, and a Restek capillary column (RTX®-5 Sil MS, 30 m × 0.25 mm i.d. ×
0.25 µm). A constant low rate at 1.0 mL min-1 of helium was
used as a carrier gas. The trap, manifold, transfer-line and injector temperature were 220 ºC, 60 ºC, 280 ºC and 250 ºC, Table 2. Limits of detection (LOD) and quantiication (LOQ) of the
method for the polycyclic aromatic hydrocarbons (PAHs) in the soil and sewage sludge matrices
PAHs LOD / (µg kg-1) LOQ / (µg kg-1)
naphthalene 0.91 3.00
acenaphthylene 0.42 1.40
acenaphthene 0.37 1.20
luorene 0.39 1.30
phenanthrene 0.28 0.89
anthracene 0.32 1.10
luoranthene 0.16 0.53
pyrene 0.16 0.55
benzo(a)anthracene 0.45 1.50
chrysene 0.42 1.40
benzo(b)luoranthene 1.60 5.40
benzo(k)luoranthene 1.80 6.00
benzo(a)pyrene 2.50 8.40
indeno(1,2,3-c,d)pyrene 0.86 2.70
dibenzo(a,h)anthracene 0.90 3.00
respectively. The oven temperature was initially 50 oC per
1 min; 10 oC min-1 until 150 oC per 2 min; 6 ºC min-1 until
220 ºC; 4 ºC min-1 until 286 ºC and 10 ºC min-1 until 300 ºC.
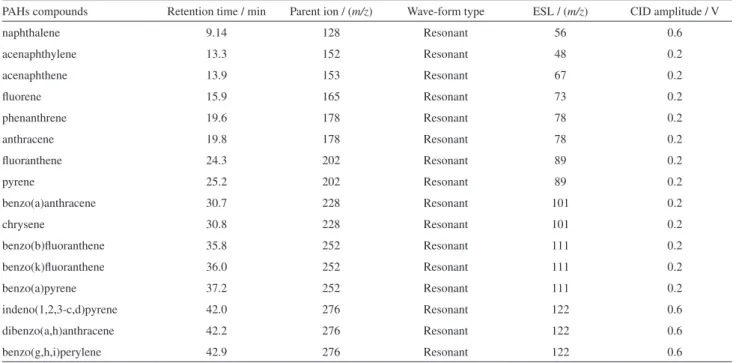
The injection volume was 1 µL and injection was pulsed-splitless mode with 25 psi during 1.10 min. The acquisition data was obtained in the MS/MS mode, using electron impact ionization voltage of 70 eV and emission current of 20 µA. The method was developed using Automatic Method Developed (AMD) where the collision induced dissociation (CID), waveform and other conditions were selected for all PAHs (Table S1, see Supplemantary Information)
Precision and accuracy
The original control soil- and SS-samples were submitted to the extraction procedures in three different days and in duplicated fortiication levels (10 µg kg-1,
20 µg kg-1 and 50 µg kg-1 of a mixture of the sixteen
PAHs). The results were satisfactory as concerned to the method accuracy (recovery) and precision. For most PAH compounds, accuracy and precision were within the range of 70-120% with coeficient of variation lower than 20%. The same method of PAH determination was used for soil and sewage sludge samples.
Results and Discussion
PAH residue levels in soil samples
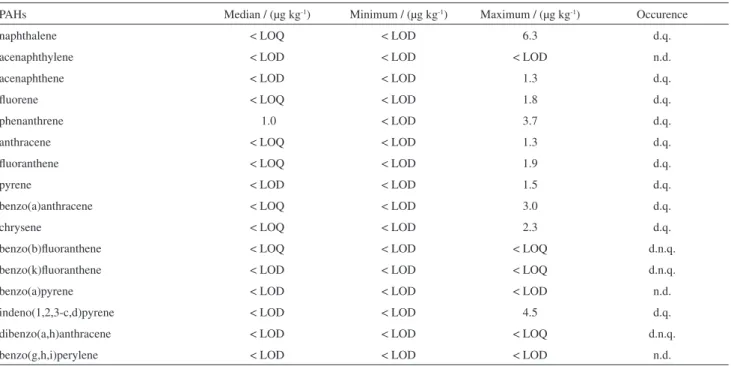
The analysis results of sixteen different PAHs (median, minimum and maximum PAH residue concentrations) in ifty four dried soil samples (eighteen samples from each treatment - STEST, SDL1N and SDL8N plots) from ield plots cultivated with maize are presented in Tables S2-S4. The detection occurrences indicate whether PAH was detected and quantiied in at least one sample (d.q.), PAH was detected in at least one sample but not quantiied in any sample (d.n.q.), and PAH was not detected in any sample (n.d.).
Sewage sludge PAH concentrations
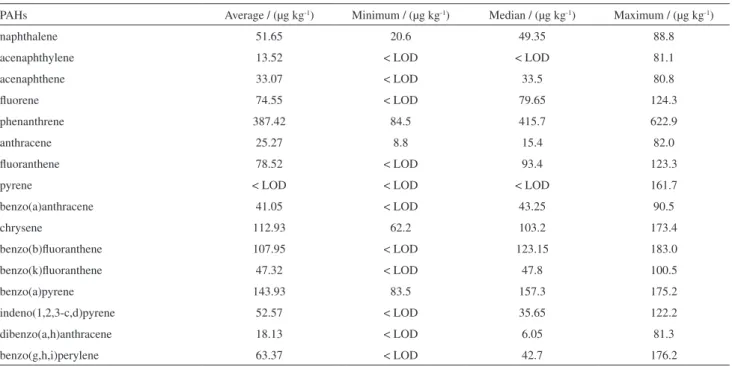
The analysis results of sixteen PAHs in six SS samples (from Franca City - State of São Paulo) used in this experiment are presented in Table S5. It is important to highlight that several PAHs were reported to be also found in SS samples from the sanitation plants of Barueri and Suzano Cities, both of the State of São Paulo.13
The PAH residue concentration values and detection classes showed signiicant differences between the median and maximum PAH residue values in soil samples from
STEST, SDL1N and SDL8N plots. The total sum of maximum PAH residues in the soil samples allowed ranking the plots as follows: SDL8N > SDL1N > STEST. The results evidenced a clear relation between the increasing PAH rate applied to the soil and the increasing total soil PAH residue concentration. And also that the total sum of median, mean or maximum PAH values in the original SS will determine the PAH concentration levels in the SDL1N and SDL8N plots treated with 28.15 t ha-1 and 225.2 t ha-1, respectively.
It was observed that all PAHs were detected or quantiied in the soil samples from SDL1N and SDL8N plots, meanwhile among those from the control plots (STEST) the lowest number of detected or quantiied PAHs were found. The results evidenced that the use of SS as agricultural fertilizer may contaminate soils with PAHs, as also observed by Oleszczuk and Baran.19 The
total load of SS-PAHs disposed in the SS-treated plots and the PAH physical-chemical characteristics such as soil sorption and half-life (Table 1) are the main causes of soil contamination risk.
High mean and median phenanthrene values were found in the SS samples compared to the other PAH residue values in the same sludge material. The phenanthrene (light PAH) characteristics such as low lipid afinity, relatively high water solubility and high vapor pressure favor its preferential uptake by plants, in this case maize plants, and its transport to grains.19,25 In this research, the SS analysis
revealed 67% of PAHs with two, three or four aromatic rings (light PAHs) and 33% with ive or six aromatic rings (heavy PAHs). Sewage sludge PAH and other compound contents may be seasonal dependent, and retention and bioavailability in soil samples depend on sorption, water solubility, and charged functional groups in the molecules.17
According to Haynes et al.,31 sewage sludge application
to lands will inevitably elevate soil PAH concentrations. It is thought that PAHs bind strongly to SS-organic matter what initially limits their decomposition. However, as the SS-organic matter begins to breakdown, the sorptive processes are weakened and PAH degradation proceeds. During decomposition, there is a rapid disappearance of low molecular mass PAHs and a slower degradation of higher molecular mass compounds.
After cessation of SS applications on two long-term monitoring ields, Beck et al.32 observed 90% loss of total
Petrogenic PAHs are mainly constituted by two or three aromatic rings, meanwhile PAHs originated from organic matter combustion present higher relative frequency of compounds with four to six rings. According to Budzinski
et al.34 the quotient between phenanthrene and anthracene
concentrations in a same matrix, allow identifying the PAH origin. The high predominance of thermodynamically stable phenanthrene on its isomer anthracene is characteristic of contamination by petroleum products.35 These authors
afirm that a quotient of [phenanthrene]/[anthracene] > 15 indicates the presence of petrogenic PAHs, that is, PAHs originated from petroleum; or, a quotient of [phenanthrene]/[anthracene] < 10 indicates the presence of PAHs from organic matter pyrolysis. Several other studies reported in the literature have suggested the quotient between two particular PAHs may reveal the matrix PAH origin.36-38 According to these criteria, the average values
of phenanthrene and anthracene found in the present work indicated that SS-PAH are of petrogenic origin. Another ratio, using Antracene/(Anthracene+Phenanthrene), reinforce the origin of these PAHs, since the obtained value was 0.06 and values lower than 0.1 indicate the presence of petrogenic PHA.37 This result suggests that the sewage
sludge used in this study received signiicant contribution of wastewaters from gas stations, auto repair shops, truck or city bus garages and car dealer shops.
Risk simulation of soil contamination by PAHs from sewage sludges
The physical-chemical properties of PAHs (Table 1), the PAH concentration levels in the soil samples from STEST, SDL1N and SDL8N plots, the soil attributes and the sewage sludge PAH concentrations allowed simulating the risk of soil contamination by PAH from continuous SS application to the soil as plant fertilizers.
It is supposed t0 (days) is the time interval between
two consecutive SS applications to an agricultural soil and soil PAH degradation is described by a irst order kinetic equation with constant degradation rates for each PAH.
It was adopted the notation CP
iA-1H(µg kg-1) for the soil
PAH concentration in the beginning of the ith time interval
(1st interval = CP
0AH, 2nd = CP1AH , 3rd = CP2AH , ...) and it
was assumed equal to t0 all the intervals between two
consecutive applications. As CP
0
AH is the initial soil PAH concentration after the
irst SS application, thus, at the end of the irst t0 interval
or beginning of the second SS application the CP 0
A H
concentration will be degraded to CP
0AH e–kt0 and it will be
added to the second application resulting as CP 0
AH +CP 0
AH e–kt0.
Therefore, in the beginning of the nth interval or the
nth SS application, the soil PAH concentration can be
estimated by
CP n
AH = CP 0
AH +CP 0
AH e–kt0+CP
0
AH e–2kt0+...+CP
0
AH e–(n–1)kt0=
= CP
0AH +CP0AH e–kt0[(1-e–nkt0)/(1-e–kt0)]
Consequently, the limit soil PAH concentration can be simulated by
CP ∞
AH = l ni→m∞ C
P n
AH = CP 0
AH + CP 0
AH/(e–kt0 -1)
where, k (day-1) is the soil PAH degradation rate
calculated as k = 0.693/ t1/2, and t1/2 is the PAH half-life
in the soil.39
Since there is always increasing soil PAH concentrations in consequence of the successive equal SS rates yearly applied, than CP
0AH < CP1AH < CP2AH <...< CPnAH <...< CP∞AH.
It is important to observe that the soil PAH limit concentration depends directly on the SS-PAH concentration that will deine the soil PAH initial concentration, and, inversely on the soil PAH degradation rate.
The initial PAH concentration in a humid soil basis, CP
0AH (µg kg-1), was estimated by C0PAH = ρSdKDCPwA0H/ρSw,
where CP w A 0
H (µg L-1) is the soil solution initial concentration
and ρSd (kg L-1) and ρSw (kg L-1) are the soil density in a dry
and humid basis, respectively; and KD (L kg
-1) is the soil PAH
distribution coeficient, calculated by KD =fOCKOC where
fOC is the soil organic carbon volumetric fraction and KOC
(L kg-1) is the PAH sorption coeficient in the soil organic
carbon. The soil solution initial concentration, CP w A 0
H (µg L-1),
was estimated by CP
wA0H = (CPSASH × d ×10-7)/ε(ρSdKPDAH + θ + δKP
A A W
H), where CP S A S
H (µg kg-1) is SS-PAH concentration in a
dry basis, d(t ha-1) is the SS-rate in a humid basis applied
to the soil, ε (m) is the average soil depth of SS-PAH initial concentration dissipation, θ is the soil water volumetric content at ield capacity, δ is the soil air volumetric content (porosity), KAW is the PAH air/water partition coeficient
estimated by KAW = (Vp × Mw) / (Ws × R × T), where
R = 8.314 kJ mol-1K-1 is the gas constant, T = 298 K is the
room temperature in Kelvin and Vp (Pa), Mw (g mol -1) and
Ws (g mol-1) are the PAH vapor pressure, molar mass and
water solubility values, respectively.40
of Embrapa Environment). It was supposed that the SS continuously used in the experimental SDL1N plots had the same characteristics and average composition of the SS presented in Table 6; similarly, the simulated SS rates were assumed to be equal to the SS rates applied to SDL1N plots (28.15 t ha-1); and, in the same way, it was assumed
10.0 cm average soil depth for the initial PAH concentration dissipation and 1.1 t m-3 density for the humid SS. And, the
following equations were required: (i) equations to estimate the PAH initial concentrations; (ii) equations to estimate the nth PAH soil concentration; and (iii) equations to estimate
each PAH soil concentration limit. The simulation results of (i), (ii) and (iii) plus the total PAH concentration in the soil, are presented in Table S6.
The data was used to simulate the contamination risk and to indicate the most wanted SS- PAHs to be monitored in soil quality monitoring programs involving continuously SS-fertilized soils. The simulation resulted in the following PAH classification, ranked in a decreasing degree of contamination risk: phenanthrene > chrysene > benzo(k)-fluoranthene > benzo(a)pyrene > pyrene > benzo(b)-luoranthene > benzo(g,h,i)perylene > indeno(1,2,3-c,d)-pyrene > luoranthene > benzo(a)anthracene > dibenzo(a,h) anthracene > fluorene > anthracene > naphthalene > acenaphthene > acenaphthylene. This classiication agrees with the dependent relationship between the soil limit concentration and the soil initial concentration, calculated from the average PAH concentration values in the sewage sludge and the PAH half-lives in the soil (Table 1).
The simulated PAH concentrations values after ten years of successive SS applications compared to the median and maximum values determined in soil samples from the SDL1N plots evidenced consistence of results, since the compared values showed the same order of magnitude. And most determined median concentrations were lower than the simulated ones. The observed soil concentrations that showed higher values than the simulated limit concentrations were attributed to the SS origin, to the sequential rates applied to the plots and to the fact that the PAH degradation rate decreases as soil PAH concentration increases.19
The simulation results presented in Table S6 were obtained supposing constant degradation rates, once an equation expressing a relationship between PAH degradation rate in soils and soil PAH concentrations was not available in the literature. Therefore, the approach used in this research work is conservative, because the PAH persistence in soil increases with the increasing soil PAH concentrations.19
It is important to highlight that PAH properties such half-life in soil (t1/2), soil distribution coeficient (KD) and
concentration in sewage sludge (CP S A S
H) are determinant
factors for an actual soil contamination risk by PAHs.
The simulated limit soil concentrations indicate that soils from experimental ields of Embrapa-Environment are hypothetically at the maximum capacity to hold SS-PAHs, because the observed values CP
1 A 0
H are very close to the
simulated ones CP
∞AH, evidencing that PAH concentration
levels found in sewage sludges might raise potential contamination risks to the soil.
Conclusions
The presence of polycyclic aromatic hydrocarbons (PAHs) [acenaphthene, acenaphthylene, anthracene, benzo(a)anthracene, benzo(a)pyrene, benzo(b) luoranthene, benzo(g,h,i)perylene, benzo(k)luoranthene, chrysene, dibenzo(a,h)anthracene, luoranthene, luorene, indeno(1,2,3-c,d)pyrene, naphthalene, phenanthrene and pyrene] were experimentally observed in sewage sludge samples and its continuous use as fertilizer might contaminate soils with PAHs. The soil PAH concentration simulations indicated the priority order of wanted PAHs for a soil quality monitoring program: phenanthrene > chrysene > benzo(k)luoranthene > benzo(a)- pyrene > pyrene > benzo(b)luoranthene > benzo(g,h,i)-perylene > indeno(1,2,3-c,d)pyrene > fluoranthene > benzo(a)anthracene > dibenzo(a,h)anthracene > luorene > anthracene > naphthalene > acenaphthene > acenaphthylene. The soil PAH concentrations were positively correlated to the sewage sludge PAH concentrations and to the sewage sludge rates applied to the soil. The PAH concentration levels found in sewage sludges might raise potential contamination risks to the soil. Therefore, additional research on this subject is of high concern and priority in order to achieve an ecologically correct and sustainable agriculture. More research is needed to better know the PAH and persistent organic pollutants (POPs) concentration range in sewage sludges of varied origins and the consequent ecosystem impact before using them as fertilizers in agriculture.
Acknowledgments
The authors thank Marley M. Tavares for the sample preparation. Financial support for this research was provided by Embrapa (Empresa Brasileira de Pesquisa Agropecuária) grant number MP3/03065100001 and Fapesp (Fundação de Amparo à Pesquisa do Estado de São Paulo) grant number 2007/04427-8.
Supplementary Information
References
1. US-EPA; Provisional Guidance for Qualitative Risk Assessment of Polycyclic Aromatic Hydrocarbons, U.S. Environmental Protection Agency. Ofice of Research and Development: Washington, DC, 1993. (EPA/600/R-93/089).
2. http://monographs.iarc.fr/ENG/Monographs/vol32/volume32. pdf accessed in June 2010.
3. Fismes, J.; Perrin-Ganier, C.; Empereur-Bissonnet, P.; Morel, J. L.; J. Environ. Qual. 2002, 31, 1649.
4. Camargo, M. C. R.; Toledo, M. C. F.; Braz. J. Food Technol. 2002, 5, 19.
5. Zohair, A.; Salim, A.B.; Soyibo, A. A.; Beck, A. J.; Chemosphere 2006, 63, 541.
6. Farhadian, A.; Jinap, S.; Faridah, A.; Sakar, Z. I.; Food Control 2010,21, 606.
7. Kulhánek, A.; Trapp, S.; Sismilich, M.; Jank , J.; Zimová, M.; Sci. Total Environ. 2005, 339, 71.
8. Collins, C.; Fryer, M.; Grosso, A.; Environ. Sci. Technol. 2006, 40, 45.
9. Chouychai, W.; Thongkukiatkul, A.; Upatham, S.; Lee, H.; Pokethitiyook, P.; Kruatrachue, M.; Environ. Toxicol. 2007, 22, 597.
10. Paraíba, L. C.; Queiroz, S. C. N.; Maia, A. de H. N.; Ferracini, V. L.; Sci. Total Environ. 2010, 408, 3270.
11. Fernandes, S. A. P.; Bettiol, W.; Cerri, C. C.; Camargo, P.; Geoderma 2005,125, 49.
12. Fernandes, S. A. P.; Bettiol, W.; Cerri, C. C.; Appl. Soil Ecol. 2005,30, 65.
13. Tsutiya, M. T.; Comparini, J. B.; Sobrinho, A. P.; Hespanol, I.; de Carvalho, P. C. T.; Meli, A. J.; Biossólidos na Agricultura, Sabesp: São Paulo, Brasil, 2001.
14. Alcantara, S.; Pérez, D. V.; Almeida, M. R. A.; Silva, G. M.; Polidoro, J. C.; Bettiol, W.; Water, Air, Soil Pollut. 2009, 203, 3. 15. Oleszczuk, P.; Chemosphere 2006, 65, 1616.
16. Mantovi, P.; Baldoni, G.; Toderi, G.; Water Res. 2005, 39, 289. 17. Kinney, C. A.; Furlong, E. T.; Zaugg, S. D.; Burkhardt, M. R.;
Werner, S. L.; Cahill, J. D.; Jorgensen, G. R.; Environ. Sci. Technol. 2006, 40, 7207.
18. ftp://ftp.sp.gov.br/ftpcomitepcj/Res-CONAMA-375-06.PDF accessed in June 2010.
19. Oleszczuk, P; Baran, S.; Water, Air, Soil Pollut. 2005, 168, 91. 20. Jones, K. C.; Stratford, J. A.; Tidridge, P.; Waterhouse, K. S.;
Johnston, A. E.; Environ. Pollut. 1989, 56, 337.
21. Tao, S.; Jiao, X. C.; Chen, S. H; Liu, W. X.; Coveney Jr, R. M.; Zhu, L. Z; Luo, Y. M.; Environ. Pollut. 2006, 140, 406. 22. http://www.cetesb.sp.gov.br accessed in June 2010.
23. Dreher, P.; Contaminants in Arable Soils in Baden-Wurttemberg Fertilized with Sewage Sludge - Concise Report; Landesanstalt fur Umweltschutz (State Institute for Environmental Protection): Baden-Wurttemberg, 2003, Vol.16.
24. http://njaes.rutgers.edu/pubs/publication.asp?pid=FS957 accessed in June 2010.
25. Paraíba, L. C.; Saito, M. L.; Pesq. Agropec. Bras. 2005, 40, 853. 26. Dynia, J. F.; De Souza, M. D.; Boeira, R. C.; Pesq. Agropec.
Bras. 2006, 41, 855.
27. http://www.syrres.com/what-we-do/databaseforms. aspx?id=386 accessed in June 2010.
28. Howard, P. H.; Boethling, R. S.; Jarvis, W. F.; Meylan, W. M.; Michalenko, E. M.; Handbook of Environmental Degradation Rates, Lewis Publishers: Chelsea, 1991.
29. Chiou, C.T.; Environ. Sci. Technol. 1985, 19, 57.
30. Pérez, S.; Guillamón, M.; Barceló, D; J. Chromatogr., A 2001, 938, 57.
31. Haynes, R. J.; Murtaza, G.; Naidu, R.; Adv. Agron. 2009, 104, 165.
32. Beck, A. J.; Johnson, D. L.; Jones, K. C.; Sci. Total Environ. 1996, 185, 125.
33. Saison, C.; Perrin-Ganier, C.; Schiavon, M.; Morel, J. L.; Environ. Pollut. 2004, 130, 275.
34. Budzinski, H.; Jones, I.; Bellocq, J.; Piérard, C.; Garrigues, P.; Mar. Chem. 1997, 58, 85.
35. Baumard, P.; Budzinski, H.; Michona, Q.; Garrigues, P.; Burgeot, T.; Bellocq, J; Estuar. Coast. Shelf Sci. 1998, 47, 77. 36. Soclo, H. H.; Garrides, P. H.; Ewald, M.; Mar. Pollut. Bull.
2000, 40, 387.
37. Maioli, O. L. G.; Rodrigues, K. C.; Knoppers, B. A.; Azevedo, D. A.; J. Braz. Chem. Soc. 2010, 21, 1543.
38. Froehner, S.; Maceno, M.; da Luz, E. C.; Souza, D. B.; Machado, K. S.; Environ. Monit. Assess. 2010, 168, 205.
39. Aguiar, A. F. A.; Xavier, A. F. S.; Rodrigues, J. E. M.; Cálculo para Ciências Médicas e Biológicas, Editora Harbra Ltda.: São Paulo, Brasil, 1988, p. 216.
40. Trapp, S.; Matthies, M.; Chemodynamics and Environmental Modeling, Springer: Heidelberg, 1998.
Submitted: June 14, 2010
Published online: February 22, 2011
Supplementary Information
S
I
J. Braz. Chem. Soc., Vol. 22, No. 6, S1-S4, 2011. Printed in Brazil - ©2011 Sociedade Brasileira de Química 0103 - 5053 $6.00+0.00
*e-mail: [email protected]
Risk Simulation of Soil Contamination by Polycyclic Aromatic Hydrocarbons from
Sewage Sludge used as Fertilizers
Lourival C. Paraíba, Sonia C. N. Queiroz,* Débora R. C. de Souza and Maria L. Saito
Embrapa Meio Ambiente, Rodovia SP 340, km 127,5, Tanquinho Velho, CP 69, 13820-000 Jaguariúna-SP, Brazil
Table S1. Conditions for the GC-EI-MS-MS analysis of PAHs
PAHs compounds Retention time / min Parent ion / (m/z) Wave-form type ESL / (m/z) CID amplitude / V
naphthalene 9.14 128 Resonant 56 0.6
acenaphthylene 13.3 152 Resonant 48 0.2
acenaphthene 13.9 153 Resonant 67 0.2
luorene 15.9 165 Resonant 73 0.2
phenanthrene 19.6 178 Resonant 78 0.2
anthracene 19.8 178 Resonant 78 0.2
luoranthene 24.3 202 Resonant 89 0.2
pyrene 25.2 202 Resonant 89 0.2
benzo(a)anthracene 30.7 228 Resonant 101 0.2
chrysene 30.8 228 Resonant 101 0.2
benzo(b)luoranthene 35.8 252 Resonant 111 0.2
benzo(k)luoranthene 36.0 252 Resonant 111 0.2
benzo(a)pyrene 37.2 252 Resonant 111 0.2
indeno(1,2,3-c,d)pyrene 42.0 276 Resonant 122 0.6
dibenzo(a,h)anthracene 42.2 276 Resonant 122 0.6
benzo(g,h,i)perylene 42.9 276 Resonant 122 0.6
Table S2. Polycyclic aromatic hydrocarbon (PAH) median, minimum and maximum concentrations in soil samples from the control plots (STEST), (n = 18) PAHs Median / (µg kg-1) Minimum / (µg kg-1) Maximum / (µg kg-1) Occurence
naphthalene < LOQ < LOD 6.3 d.q.
acenaphthylene < LOD < LOD < LOD n.d.
acenaphthene < LOD < LOD 1.3 d.q.
luorene < LOQ < LOD 1.8 d.q.
phenanthrene 1.0 < LOD 3.7 d.q.
anthracene < LOQ < LOD 1.3 d.q.
luoranthene < LOQ < LOD 1.9 d.q.
pyrene < LOD < LOD 1.5 d.q.
benzo(a)anthracene < LOQ < LOD 3.0 d.q.
chrysene < LOQ < LOD 2.3 d.q.
benzo(b)luoranthene < LOQ < LOD < LOQ d.n.q.
benzo(k)luoranthene < LOD < LOD < LOQ d.n.q.
benzo(a)pyrene < LOD < LOD < LOD n.d.
indeno(1,2,3-c,d)pyrene < LOD < LOD 4.5 d.q.
dibenzo(a,h)anthracene < LOD < LOD < LOQ d.n.q.
benzo(g,h,i)perylene < LOD < LOD < LOD n.d.
LOD = limit of detection; LOQ = limit of quantiication; d.q. = detected and quantiied; d.n.q. = detected and not quantiied; n.d. = not detected.
Table S3. Polycyclic aromatic hydrocarbon (PAH) median, minimum and maximum concentrations in soil samples from the sewage sludge (SS) treated plots (SDL1N), n = 18
PAHs Median / (µg kg-1) Minimum / (µg kg-1) Maximum / (µg kg-1) Occurence
naphthalene < LOQ < LOQ 3.27 d.q.
acenaphthylene < LOD < LOD < LOQ d.n.q.
acenaphthene < LOQ < LOD 1.66 d.q.
luorene < LOQ < LOD 1.54 d.q.
phenanthrene 1.6 < LOD 2.74 d.q.
anthracene < LOQ < LOD 2.04 d.q.
luoranthene 0.76 < LOD 2.81 d.q.
pyrene < LOD < LOD 2.63 d.q.
benzo(a)anthracene < LOQ < LOD 3.32 d.q.
chrysene 1.6 < LOD 4.47 d.q.
benzo(b)luoranthene < LOQ < LOD 6.45 d.q.
benzo(k)luoranthene < LOD < LOD < LOQ d.n.q.
benzo(a)pyrene < LOD < LOD < LOQ d.n.q.
indeno(1,2,3-c,d)pyrene < LOD < LOD 5.52 d.q.
dibenzo(a,h)anthracene < LOD < LOD 3.26 d.q.
benzo(g,h,i)perylene < LOD < LOD 3.34 d.q.
Table S4. Polycyclic aromatic hydrocarbon (PAH) median, minimum and maximum concentrations in soil samples from the sewage sludge (SS) treated plots (SDL8N), n = 18
PAHs Median / (µg kg-1) Minimum / (µg kg-1) Maximum / (µg kg-1) Occurence
naphthalene < LOQ < LOD < LOQ d.n.q.
acenaphthylene < LOQ < LOD 2.4 d.q.
acenaphthene < LOQ < LOD 2.2 d.q.
luorene < LOQ < LOD 1.8 d.q.
phenanthrene 2.9 < LOD 3.9 d.q.
anthracene 1.5 < LOD 2.4 d.q.
luoranthene < LOD < LOD 4.4 d.q.
pyrene < LOD < LOD 3.3 d.q.
benzo(a)anthracene 3.8 < LOD 5.0 d.q.
chrysene 6.7 < LOD 10.4 d.q.
benzo(b)luoranthene 9.6 < LOD 11.65 d.q.
benzo(k)luoranthene < LOQ < LOD 8.0 d.q.
benzo(a)pyrene < LOQ < LOD < LOQ d.n.q.
indeno(1,2,3-c,d)pyrene 7.3 < LOD 14.0 d.q.
dibenzo(a,h)anthracene < LOQ < LOD 11.0 d.q.
benzo(g,h,i)perylene 6.4 < LOD 10.2 d.q.
LOD = limit of detection; LOQ = limit of quantiication; d.q. = detected and quantiied; d.n.q. = detected and not quantiied; n.d. = not detected.
Table S5. Polycyclic aromatic hydrocarbon (PAH) median, minimum and maximum concentrations in the sewage sludge used in SDL1N and SDL8N plots, n = 18
PAHs Average / (µg kg-1) Minimum / (µg kg-1) Median / (µg kg-1) Maximum / (µg kg-1)
naphthalene 51.65 20.6 49.35 88.8
acenaphthylene 13.52 < LOD < LOD 81.1
acenaphthene 33.07 < LOD 33.5 80.8
luorene 74.55 < LOD 79.65 124.3
phenanthrene 387.42 84.5 415.7 622.9
anthracene 25.27 8.8 15.4 82.0
luoranthene 78.52 < LOD 93.4 123.3
pyrene < LOD < LOD < LOD 161.7
benzo(a)anthracene 41.05 < LOD 43.25 90.5
chrysene 112.93 62.2 103.2 173.4
benzo(b)luoranthene 107.95 < LOD 123.15 183.0
benzo(k)luoranthene 47.32 < LOD 47.8 100.5
benzo(a)pyrene 143.93 83.5 157.3 175.2
indeno(1,2,3-c,d)pyrene 52.57 < LOD 35.65 122.2
dibenzo(a,h)anthracene 18.13 < LOD 6.05 81.3
Table S6. Simulation of soil PAH concentrations after ten years of yearly successive applications of sewage sludge rates and simulation of soil PAH limit concentrations in µg kg-1
PAHs CP
0AH CP10AH C∞PAH
naphthalene 1.83 1.84 1.84
acenaphthylene 0.50 0.51 0.51
acenaphthene 1.22 1.33 1.33
luorene 2.77 2.81 2.81
phenanthrene 14.47 20.16 20.16
anthracene 0.94 2.22 2.23
luoranthene 2.94 6.71 6.73
pyrene 1.54 9.03 12.18
benzo(a)anthracene 1.54 4.79 4.90
chrysene 4.24 17.33 18.79
benzo(b)luoranthene 4.05 11.74 11.93
benzo(k)luoranthene 1.78 11.04 15.93
benzo(a)pyrene 5.40 14.11 14.23
indeno(1,2,3-c,d)pyrene 1.97 6.53 6.74
dibenzo(a,h)anthracene 0.68 2.69 2.88
benzo(g,h,i)perylene 2.38 7.23 7.38