1
Vol.59: e16150275, January-December 2016 http://dx.doi.org/10.1590/1678-4324-2016150275
ISSN 1678-4324 Online Edition
BRAZILIAN ARCHIVES OF BIOLOGY AND TECHNOLOGY
A N I N T E R N A T I O N A L J O U R N A L
Effect of Heavy Metals on Liver, Kidney, Gills and Muscles
of
Cyprinus carpio
and
Wallago attu
inhabited in the Indus
Shahid Mahboob
1,2*,
Shazia Kausar
2, Farhat Jabeen
2, S. Sultana
2, T. Sultana
2, K.A.
Al-Ghanim
1, Bilal Hussain
2, Fahad Al-Misned
1and Z. Ahmed
1.
1Department of Zoology, College of Science, King Saud University, P.O. Box 2455, Riyadh-11451, Saudi Arabia. 2Department of Zoology, Government College University, Faisalabad, Pakistan.
ABSTRACT
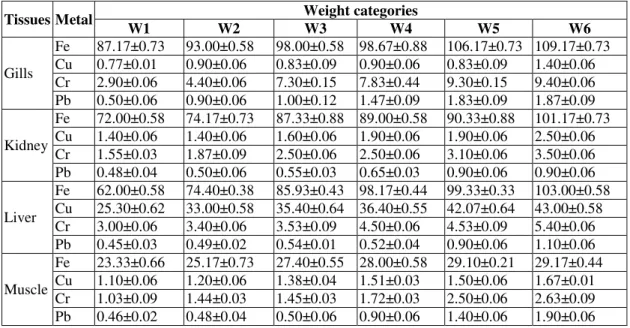
The present study was aimed to evaluate the effect of heavy metals on an important tissue of two fish species Cyprinus carpio and Wallago attu, sampled from the Indus river, Mianwali District, Pakistan. The concentration of selected heavy metals Fe, Cr, Cu, and in gills, muscles, kidney and liver was compared with an International standard of food fish. The overall metal concentrations among different weight categories in C. carpio were in the order of Fe > Cu > Cr >. In W. attu the overall accumulation of these metals were, in order of Fe > Cu > Cr > Pb The order of accumulation of metals in gills and muscle of C. carpio was Fe > Cr > Pb > Cu; kidney and muscles of W. attu was Fe > Cr > Cu > Pb; liver Fe > Cu > Cr > Pb. An increasing trend of concentration of iron, copper, chromium and lead occurred with an increase in weight of C. carpio and W. attu. There was a significant difference in the accumulation of heavy metals in different organs of both species (p<0.01). All studied heavy metals except Cr were within permissible limits described by various international agencies like WHO, FAO and FEPA in edible tissues of C. carpio and W. attu.
Key words: River; heavy metals; fish; weight; pollution
1Authors for correspondence: shahidmahboob60@hotmail.com
INTRODUCTION
Fish are one of the symptomatic factors in freshwater systems, particularly for the estimation of the lethal hazards from human utilizations. Heavy metals taken up by an organism are distributed to different organs of the fish, because of the chemical assemblage between them. The muscles, liver, gonads and gills are the tissues of fish that have been used in research works of heavy metals in wide ranges [1]. Fresh water organisms, fish and shellfish pile up metals to concentrations much greater than accumulating in water and sediments [2-3]. Metal bioaccumulation is largely attributed to differences in uptake and depuration period for various metals in different fish species [4]. The organisms developed a protective measure against the dangerous impacts of heavy metals and other contaminants that cause destructive changes like oxidative pressure in the Cichlidae domains are greatly known and highly frugal to fish body [5]. Dormant biomarkers show that heavy metals are responsible for many disastrous effects in different types of fish and other animals [6-7].
Metals are unrelenting contaminants and they aggregate in soil, water, sediments and mostly, in trophic chains [8]. The absorption of heavy metals in submerged organisms can pose a long lasting effect on nutrient cycling in the ecosystem. Heavy metals can also greatly affect the growth rate of major carps [9]. It is important to monitor all potential contaminations of the ecosystem and its effect on food webs to ensure the food quality and safety [10]. Even low concentration of trace metals may cause a lingering stress that may not cause death of the individual fish, but cause a decrease in fish size, and body weight [11]. Heavy metal poisoning might be having degenerative impacts on the environmental remainders, of the present kingdom and mostly of freshwater organisms [7, 12]. The voracious fish load an appreciable high amount of heavy metal elements, when collate with the heavy metal burden in cannibal fish. The metals may into the fish's body by three possible routes: (i) the skin surface/epidermal surface (skin), (ii) the gills (iii) the food tract [13].
Wallago attu and Cyprinus carpio were used in this study because these freshwater fish species are highly consumed in the study area due to their nutritional value. Wallago attu and Cyprinus carpio
is gradually declining in the river Indus due to pollution stress and other anthropogenic activities. Unfortunately, only limited information in the
literature is available on these commercially important fish species in the region. The aim of this study was to investigate the concentration of different selected heavy metals (Fe, Cu, Cr and Pb) in kidney, liver, gills and muscles of Wallago attu
and Cyprinus carpio fish species harvested from the Indus river near Mianwali District, Pakistan. As
Cyprinus carpio is an omnivorous fish and Wallago attu is a carnivorous fish, the difference in metal bioaccumulation levels in different tissues of fish was compared as well.
MATERIALS AND METHODS
Study Area
The study was carried out along the stretch of the Indus River in District Mianwali, which is located in the north-west of the Punjab, Pakistan. Mianwali is rich in azoaics, argillaceous slab, cinder, calcium magnesium carbonate, fire clay, hydrated calcium sulphate, sedimentary rocks having calcium, alkalies, colorless vitreous insoluble solids, loose material consisting of grains of rock or coral and rocks, which are excavated in commercial amounts. The residents of District Mianwali are dependent on the Indus River for fishing and fish consumption. In this area, an important issue is to check the quality of fish meat with regards to the effects of environmental factors which may affect the food fish. The city is located at 32.10º to 33.15 º north latitudes and 71.08 º to 71.57 º east longitudes (shown on map; Fig. 1). The District covers an area of 1,426,000 acres or 5,840 sq. km.This District has excessive hot and cold seasons, where the hot temperature can range up to 51 ºC in summer and -2 ºC in cold season, with usual rainfall of about -250 mm [14].
Figure 1: Map of Punjab with Mianwali District
Effect of heavy metals in tissues in fish 3
Procurement of fish and preservation
Fishing was performed with the help of professional local anglers. Forty-two samples of each fish species (Cyprinus carpio and Wallago atuu) of different sizes were sampled in September 2014 from the Indus River in Mianwal, Punjab, Pakistan. The fishes were categorized into six weight categories. Fish were quickly killed, stored on ice
and transported to the research laboratory, Department of Zoology and Fisheries, GC University Faisalabad, where morphometric measurements (including overall length, fork length, standard length and wet weight) of fish samples were carried out (Table 1).
Table 1: Morphometric measurements of Cyprinus carpio and Wallago attu
Cyprinus carpio
Wallago attu
Weight categor ies
Mean Weight in (g) ±SE
Fork length (cm)±SE
Total length (cm) )±SE
Standard length (cm) ±SE
Mean Weight in (g) ±SE
Fork length (cm) )±SE
Total Length (cm) )±SE
Standard Length (cm) ±SE I 1033.33±28.90 39.37±0.04 43.18±0.12 36.83±0.23 1000±44.14 40.26±0.07 44.34±0.14 38.26±0.24 II 1466.66±28.90 41.9±0.07 45.72±0.14 38.37±0.21 1400±44.14 42.34±0.04 45.31±0.09 39.07±0.23 III 2008.33±28.90 46.74±0.08 50.8±0.14 42.67±0.22 1900±98.36 48.5±0.08 52.58±0.09 47.96±0.22 IV 2533.33±50.74 48±0.07 52.15±0.17 46.18±0.21 2458.33±60.16 50.31±0.07 54.85±0.14 48.23±0.24 V 2950±28.90 52.05±0.09 56.42±0.13 49.99±0.24 2850±86.70 53.85±0.04 57.12±0.09 51.5±0.23 VI 3516.66±43.35 53.42±0.08 58.39±0.18 51.26±0.27 3475±44.14 56.12±0.07 60.2±0.14 53.31±0.24
Each fish was dissected to separate gills, liver, kidney and muscles. Forty-two samples of each tissue of each fish species were collected which can accumulate metals and yet tolerate metal load. From each fish sample about 15 g of gills, liver, kidney and muscles were collected, washed with distilled water, transferred into clearly marked polyethylene flexible bags, and stored in a freezer at -20C º for further analysis. The tissue samples were thawed at room temperature before analysis. Approximately 1 g (gills, liver, kidney and muscle) was weighed in an Erlenmeyer flask and digested with 5 ml Perchloric acid and 15 ml HNO3 on a hot
plate until brown fumes ceased to evolve, then samples were cooled at room temperature, diluted with 50 ml distilled water by following [15].
Analysis of fish samples
Samples of gills, kidney, liver and muscle of W. attu and C. carpio were analyzed by following methods described in [15] for the detection of metals viz., Pb, Cu, Fe and Cr through an Atomic Absorption Spectrophotometer (Hitachi Polarized Zeeman AAS, Z-8200, Japan). The blanks and calibration standard solution were also analyzed in the same way as for the samples. The instrument calibration standards was prepared by diluting standard (1000 ppm) supplied by Merck, Germany. A known 1000 mg/l concentration of Pb, Cu, Fe and Cr solution was prepared from their salts. All reagents used were of analytical grade purchased from Merck, Germany.
Statistical Analysis
The mean values and standard error were calculated. The data were analyzed by using statistical package Minitab 15. Level of significance was established at P<0.05.
RESULTS
Table 1 reveals the morphometric measurements of
C. carpio and W. attu sampled in this study. The weight of both fish species was categorized into six categories viz., W1, W2, W3, W4, W5 and W6 (wet weight in grams) with W1 being the lowest and W6 as a highest weight category. The weight categories of C. carpio ranged from 1033.33±28.90g to 3516.66 ±43.35g. The weight categories of W. attu
ranged from 1000±44.14g to 3475±44.14g. The fork length of C. carpio ranged from 39.37±0.04 cm to 53.42 ±0.08 cm, while in W. attu fork length ranged from 40.26±0.07cm to 56.12±0.07 cm. Total length of C. carpio ranged from 43.18±0.12cm to 58.39±0.18cm while Total length of W. attu ranged from 44.34±0.14 cm to 60.2±0.14cm. The standard length of C. carpio ranged from 36.83±0.23 cm to 51.26±0.27cm and standard length of W. attu
1.03±0.09 to 9.40±0.06 and 0.45±0.03 to 1.90±0.06 mg/Kg among different weight categories of C. carpio (Table 2; Fig. 2). The level of metals in gills and muscle and liver of C. carpio was recorded: Fe > Cr > Pb > Cu and Fe > Cr > Cu > Pb, respectively. The overall metal concentrations in W. attu of Fe, Cu, Cr and Pb was recorded as, 197.17 ±0.73, 24.00±0.58, 20.00±0.58 and 2.00±0.12 mg/ Kg. The level of Cu, Cr and lead were ranged as 1.40±0.06 to 24.00±0.58, 2.53±0.09 to 20.00±0.58 and Theorderof accumulation of these metals was
recorded as Fe > Cu > Cr > Pb. The level of Cr and lead was ranged 1.03±0.09 to 9.40±0.06 and 0.45±0.03 to 1.90±0.06 and 0.00±0.00 to 2.0±0.12 mg/Kg, respectively. The order of bioaccumulation of metals in gills was Fe> Cr > Pb > Cu; kidney and muscles were; Fe > Cr > Cu > Pb; liver as Fe > Cu > Cr > Pb (Table 3). An increasing trend of concentration of iron, copper, chromium and lead was observed to increase in weight categories of C. carpio and W. attu (Fig 3-6).
Table 2: Mean concentration ± SE of heavy metals (mg/kg ww) in different tissues of Cyprinus carpio.
Tissues Metal Weight categories
W1 W2 W3 W4 W5 W6
Gills
Fe 87.17±0.73 93.00±0.58 98.00±0.58 98.67±0.88 106.17±0.73 109.17±0.73 Cu 0.77±0.01 0.90±0.06 0.83±0.09 0.90±0.06 0.83±0.09 1.40±0.06 Cr 2.90±0.06 4.40±0.06 7.30±0.15 7.83±0.44 9.30±0.15 9.40±0.06 Pb 0.50±0.06 0.90±0.06 1.00±0.12 1.47±0.09 1.83±0.09 1.87±0.09
Kidney
Fe 72.00±0.58 74.17±0.73 87.33±0.88 89.00±0.58 90.33±0.88 101.17±0.73 Cu 1.40±0.06 1.40±0.06 1.60±0.06 1.90±0.06 1.90±0.06 2.50±0.06 Cr 1.55±0.03 1.87±0.09 2.50±0.06 2.50±0.06 3.10±0.06 3.50±0.06 Pb 0.48±0.04 0.50±0.06 0.55±0.03 0.65±0.03 0.90±0.06 0.90±0.06
Liver
Fe 62.00±0.58 74.40±0.38 85.93±0.43 98.17±0.44 99.33±0.33 103.00±0.58 Cu 25.30±0.62 33.00±0.58 35.40±0.64 36.40±0.55 42.07±0.64 43.00±0.58 Cr 3.00±0.06 3.40±0.06 3.53±0.09 4.50±0.06 4.53±0.09 5.40±0.06 Pb 0.45±0.03 0.49±0.02 0.54±0.01 0.52±0.04 0.90±0.06 1.10±0.06
Muscle
Fe 23.33±0.66 25.17±0.73 27.40±0.55 28.00±0.58 29.10±0.21 29.17±0.44 Cu 1.10±0.06 1.20±0.06 1.38±0.04 1.51±0.03 1.50±0.06 1.67±0.01 Cr 1.03±0.09 1.44±0.03 1.45±0.03 1.72±0.03 2.50±0.06 2.63±0.09 Pb 0.46±0.02 0.48±0.04 0.50±0.06 0.90±0.06 1.40±0.06 1.90±0.06
Table 3: Mean concentrations of heavy metals (mg/kg) in different tissues of Wallago atuu
Tissues Metal Weight categories
W1 W2 W3 W4 W5 W6
Gills
Fe 93.17±0.44 98.17±0.60 101.00±0.58 107.50±0.87 110.17±1.17 123.17±0.60 Cu 3.00±0.12 3.40±0.06 4.10±0.15 4.70±0.15 5.00±0.12 5.90±0.21 Cr 4.47±0.09 5.00±0.12 5.50±0.06 7.00±0.29 8.47±0.09 9.50±0.29 Pb 0.45±0.03 1.00±0.06 1.00±0.06 1.00±0.06 1.50±0.06 1.92±0.04
Kidney
Fe 99.17±0.60 106.50±2.29 132.00±0.58 160.00±0.58 143.50±1.04 160.00±1.15 Cu 1.40±0.06 1.50±0.06 2.50±0.06 2.50±0.06 3.00±0.12 3.47±0.03 Cr 2.53±0.09 3.40±0.06 3.50±0.06 4.50±0.06 6.50±0.06 5.53±0.03 Pb 0.00±0.00 0.00±0.00 0.23±0.03 0.50±0.03 0.50±0.06 0.50±0.06
Liver
Fe 154.17±0.73 158.63±1.07 165.00±0.58 174.17±0.73 187.17±0.73 197.17±0.73 Cu 11.50±0.29 12.00±0.29 16.00±0.58 16.50±0.29 17.50±0.29 24.00±0.58 Cr 12.50±0.29 15.00±0.58 15.33±0.44 18.00±0.58 20.00±0.58 20.00±0.58 Pb 0.90±0.06 0.90±0.06 0.90±0.06 0.90±0.06 1.00±0.06 1.00±0.12
Muscle
Effect of heavy metals in tissues in fish 5
Fig. 2: Overall concentrations of heavy metals in Cyprinus carpio and Wallago attu
Fig .3: Concentration of heavy metals in gills of Cyprinus carpio and Wallago attu.
0 50 100 150 200 250
Fe Cu Cr Pb
metals
c
o
n
c
.
o
f
m
e
ta
ls
Cyprinus carpio. Wallago attu
0 20 40 60 80 100 120 140
Fe Cr Pb Cu
metals
co
n
c.
o
f
m
eta
ls
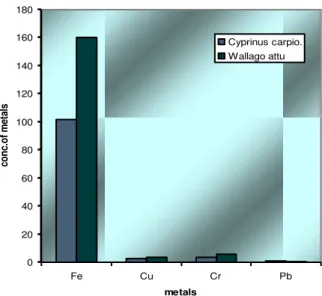
Fig. 4: Concentration of heavy metals in kidney of Cyprinus carpio and Wallago attu.
Fig. 5: Concentration of heavy metals in liver of Cyprinus carpio and Wallago attu.
Fig. 6: Concentration of heavy metals in muscles of Cyprinus carpio and Wallago attu.
0 20 40 60 80 100 120 140 160 180
Fe Cu Cr Pb
metals
c
o
n
c
.o
f
m
e
ta
ls
Cyprinus carpio. Wallago attu
0 50 100 150 200 250
Fe Cu Cr Pb
metals
co
n
c.
o
f
m
eta
ls
Cyprinus carpio. Wallago attu
0 10 20 30 40 50 60 70
Fe Cu Cr Pb
metals
c
o
n
c
.
o
f
m
e
ta
ls
Effect of heavy metals in tissues in fish 7
Iron (Fe):
The concentration of Fe in gills of C. carpio ranged from 87.17±0.73 to 109.17±0.73 mg/Kg while, Iron (Fe) concentration in gills of W. attu ranged from 93.17±0.44 to 123.17±0. 60 mg/Kg in different weight groups. The concentration of Fe in kidney of
C. carpio and W. attu was ranged from 72.00±0.58 to 101.17±0.73 and 99.17±0.60 to 160.00±1.15 mg/Kg, respectively in different weight groups. Fe concentration in liver of C. carpio and W. attu was ranged from 62.00±0.58 to 103.00±0.58 and 154.17±0.73 to 197.17±0.58 mg/Kg, respectively. Iron (Fe) concentration in muscles of C. carpio and
W. aatu ranged from 23.33±0.6 to 29.17±0.44 and 41.17±0. 60 to 60.17±1.17 mg/Kg, respectively in different weight groups (Table 2-3; Fig. 3). The concentration of Fe in C. carpio was detected in order as gills > liver > kidney > muscles. The overall Fe concentration in W. attu was recorded in the order as liver > kidney > gills > muscles. The concentration order of iron (Fe) in these tissues was 197.17±0.73 > 160.00±1.15 > 123.17±0.60 > 60.17±1.17. However, iron showed an increasing trend with an increase in weight categories. Fe showed more affinity towards W. attu than C. carpio.
Copper (Cu).
The concentration of Copper (Cu) in gills, kidney, liver and muscles of C. carpio was ranged from 0.77±0.01 to 1.40±0.06, 1.40±0.06 to 2.50±0.06 and 25.30±0.62 to 43.00±0.58 and 1.10±0.06 to 1.67±0.01 mg/Kg, respectively. The level of Cu in gills, kidney, liver and muscles of W. attu was ranged from 3.00±0.12 to 5.90±0.21, 1.40±0.06 to 3.47±0.03, 11. 50±0.29 to 24.00±0.58 and 2.90±0.0.6 to 5.50±0.06 mg/Kg, respectively (Table 2-3). The concentration order of Copper (Cu) in all studied organs of C. carpio wasrecorded in the order ofliver >kidney >muscles >gills while in W. attu, it was liver >gills >muscles >Kidney (Table 2-3). However, copper showed an increasing trend with an increase in weight of the fish. Kidney and muscles were accumulated more in W. attu
while in liver in C. carpio.
Chromium (Cr):
The concentration of Chromium (Cr) in gills, kidney, liver and muscles of C. carpio was ranged from 2.90±0.06 to 9.40±0.06, 1.55±0.03 to 3.50±0.06, 3.00±0.06 to 5.40±0.06 and 1.03±0.09 to 2.63±0.09 mg/Kg, respectively. The level of Cr
in gills, kidney, liver and muscles of W. attu was ranged from 4.47±0.09 to 9.50±0.29, 2.53±0.09 to 5.53±0.03, 12.50±0.29 to 20.00±0. 58 and 6.50±0.29 to 15.17±0.44 mg/Kg, respectively (Table 2-3). The concentration of Cr in all studied organs of C. carpio wasrecorded in the order gills > liver >kidney >muscles, while in W. attu, it was liver > muscles > gills >Kidney (Table 2-3). There was a significant difference in the chromium concentration in kidney, liver and muscles of both fish species. There was an increasing trend in Cr with an increase in weight in both the fish species.
Lead (Pb):
The concentration of lead (Pb) in gills, kidney, liver and muscles of C. carpio was ranged from 0.50±0.06 to 1.87±0.09, 0.48±0.04 to 0.90±0.06, 0.90±0.06 to 1.00±0.12 and 0.46±0.02 to 1.90±0.06 mg/Kg, respectively. The level of Pb in gills, kidney, liver and muscles of W. attu was ranged from 0.45±0.03 to 1.92±0.04, 0.00±0.00 to 0.50±0.06, 0.90±0.06 to 1.00±0.12 and 0.83±0.09 to 2.00±0.12 mg/Kg, respectively (Table 2-3). The concentration of Cr in all studied organs of C. carpio and W. attu was recorded in the order muscles >gills >liver >kidney. There was a significant difference in the Pb concentration in kidney, liver and muscles of both fish species. There was an increase in the concentration of Cr with an increase in the weight of fish
DISCUSSION
The concentration of heavy metals in W. attu in this study was recorded in the order of Fe>Cu >Cr>Pb. The overall comparison, exhibited Fe was recorded in higher concentration compared to Cr, Pb and Cu while Pb was in least concentration. These findings were in line with the findings of [16-17], who reported the highest concentration of iron in organs of different fish species. The concentration of Fe, Cu, and Cr was higher in the gills, kidney, liver and muscles that were in line with the findings of [13, 18]. The order of Cr and Cu accumulation in W. attu
the liver of fish reported in the studies of [17]. Cu concentration was greater in liver than gills of W. attu which is in line with the work of [13] who reported that concentrations of Cu as being greater in liver than gills of W. attu and Labeo dyocheilus. The level of Cu in C. carpio was higher in liver and lowest in the gills. The order of concentration was liver > kidney > muscles > gills, which is in an agreement with the work of [12] who reported the order of organs with respect to the Cu metal as being minimum accumulated in gills as compared to kidney and liver in which Cu concentration was greater than gills. The accumulation of Cr in C. carpio was highest in the liver which was in agreement with the work experimented by]12, 20] who reported that Cr concentration was greater in liver as compared to muscles of Catla catla, Labeo rohita and Cirrhina mrigala. Cr concentration was greater than Pb in the gills, kidney, liver and muscles of C. carpio and W. attu. This finding was being contradictory to the work of [17] who reported lead was greater than chromium in gills, stomach, intestine, heart and liver except muscles, which were possessed greater chromium concentrations than Pb, which was in the present study. Overall comparison revealed that the concentrations of Fe, Cu, and Cr were greater in the liver than the muscles of W. attu which is in line with the work of [21] who reported that greatest heavy metals were significantly occurring in liver than muscles in fish species and macro-invertebrates. Fe concentration was greater than all other selected heavy metals in the gills, kidney, liver and muscles of C. carpio and W. attu which in accordance with [17] who reported that the iron bioaccumulation concentration was greater than all other metals in gills, stomach, air bladder, heart and liver of C. carpio. In this study, all selected heavy metals in edible tissues of C. carpio and W. attu
were in permissible limits of [22-24] except chromium. Excessive levels of Cr in edible tissues of C. carpio and W. Alto may be due to the reason that chromium is present as a natural source in the form of Cr deposits in District Mianwali which may cause its greater accumulation in aquatic environment and aquatic organisms [7, 12. 18]. Cr concentration was greater than Cu and lower than iron in the gills, kidney and muscles of W. attu as well as in kidney of C. carpio. Cr concentration in organ systems of C. carpio was gills > liver > kidney > muscles which is in accordance with the investigations of Jabeen and Chudhry (2010) who reported that the metal load order as gills > liver >
skin > muscles of C. carpio. They also reported that chromium was above permissible levels of [22-23]. Cr concentration in organs was as liver > muscles > gills > kidney of W. attu in the present study, which was contrary to the reported results [7]. Pb concentration in organs of C. carpio was muscles > gills > liver > kidney and organs of W. attu showed the concentrations of heavy metals in order as muscles > gills > liver > kidney. Pb concentration was lower in the gills, kidney, liver and muscles of
W. attu As well as in kidney and liver of C. carpio. The findings of this study are contrary to [12] who reported that lead was greater in liver as compared to the gills and kidney of Clarias gariepinus. Excessive levels of Cr in edible tissues of C. carpio
and W. attu may be due to the reason that Cr is present as a natural source in the form of chromium deposits in District Mianwali which may cause its greater accumulation in aquatic environment and organisms [3, 14]. Thus, the excessive level of Cr in food fish is hazardous for pregnant females and children. Accumulation of chromium in the liver and muscle tissues could be a possible reason for varying enzyme activities. Fish goes under stress due excessive level of Cr. During stress, fish need more energy to detoxify the toxicants and to overcome stress. Since fish have very little carbohydrate, protein is used to meet the increased energy demand. Proteins are mainly involved in the architecture of the cell, which is the chief source of nitrogenous metabolism during chronic periods of stress; they are also a source of energy. Thus, the depletion of the protein fraction in the liver and muscle tissues may be due to their degradation and possible utilization for metabolic purposes. An increase in free amino acid levels was the result of the breakdown of protein for energy and impaired incorporation of amino acids in protein synthesis [3]. In this study, more metal accumulation was observed in W. attu compared to C. carpio and there was a significant difference in metal accumulation in different organs of these fishes (P < 0.05). The fish of the Indus River was investigated to know whether fish are safe for human consumption with respect to Fe, Cu, and Pb but Cr or not considering permissible limits of [22-24].
CONCLUSION
From the findings of this study, it was concluded that the fish liver and gills exhibited highest accumulation heavy metals (Fe, Cu, Cr and Pb) in
Effect of heavy metals in tissues in fish 9
Mianwali, Pakistan. All studied heavy metals except Cr were in permissible limits described by various international agencies like WHO, FAO and FEPA in edible tissues of C. carpio and W. attu.
ACKNOWLEDGEMENTS
The authors would like to express their sincere appreciation to the Deanship of Scientific Research at King Saud University for its funding of this research through the Research Group Project No. RG-1435-012.
REFERENCES
[1] Yilmaz FN, Ozdemir A, Demirak A, Tuna AL. Heavy metal levels in two fish species Leuciscus cephalus and Lepomis gibbosus. Microchem. J.2007; 95, 341-344.
[2] Al-Weher SM. Levels of Heavy Metal Cd, Cu and Zn in Three Fish Species Collected from the Northern Jordan Valley. Jordan. Mar., 2008; 1: 41 – 46 [3] Mahboob S, Alkahem Al-Balawi H F, Al-Misned F,
Al-Quraishy S, Ahmad Z. Tissue Metal Distribution and Risk Assessment for Important Fish Species from Saudi Arabia. Bull Environ Contam Toxicol 2014; 92:61–66.
[4] Twari-Fufeyin P, Ekaye SA. Fish species diversity as indicator of pollution in Ikpoba river, Benin City, Nigeria. Rev Fish Biol Fisheries. 2007; 17:21-30. [5] Abouel-Naga EH, El-Moselhy KH, Hamid MA.
2005. Toxicity of cadmium and copper and their effect on some biochemical parameters of marine fish Mugil seheli, Egyptian J Aquatic Res. 2005; 31: 60-71.
[6] Hassan NS, Awad SM. Reverse effect of vitamin-E on oxidative stress, derivatives and conductivity changes of hemoglobin induced by exposure to cadmium. J App Sci 2007; 3:437-443.
[7] Gundogdu A, Saniye T, Culha, FK, Mehmet C. Heavy metal accumulation in muscles and total bodies of Mullus barbatus, Trachurus trachurus and Engraulis encrasicolus captured from the Coast of Sinop, Black Sea. Pak J. Zool 2016; 48(1): 25-34. [8] Swaileh KM, Sansur R. Monitoring urban heavy
metal pollution using the house sparrow (Passer domesticus). J Environ Monit 2006; 8: 209-213. [9] Hayat S, Javed M, Razzaq S. Growth performance of
metal stressed major carps viz. Catla catla, Labeo rohita and Cirrhina mrigala reared under semi-intensive culture system. Pak Vet J. 2007; 27(1): 8-12.
[10] Andreji J, Stanai I, Massanyi P, Valent M. Accumulation of Some Metals in Muscles of Five Fish Species from Lower Nitra River. J of Environ Sci and Eng. 2006; 41: 2607–2622.
[11] Vosylien MZ, Jankaite A. Effect of heavy metal model mixture on rainbow trout biological parameters. Ekologija. 2006; 4: 12-17.
[12] Farombi EO, Adelowo OA, Ajimoko YR. Biomarkers of Oxidative Stress and Heavy Metal Levels as Indicators of Environmental Pollution in African Cat Fish (Clarias gariepinus) from Nigeria Ogun River. Int J Environ Res Public Health. 2007; 4(2):158-165.
[13] Yousafzai AM, Douglas P, Khan AR, Ahmad I, Siraj M. 2010. Comparison of heavy metals burden in two freshwater fishes Wallago attu and Labeo dyocheilus with regard to their feeding habits in natural ecosystem.Pak J Zool 2010; 42, 537-544. [14] Jabeen F, Chaudhry AS. Monitoring trace metals in
different tissues of Cyprinus carpio from the Indus River in Pakistan. Environ Monit Assess, 2010; 170:645–656.
[15] AOAC. Official and Methods of Analysis 15th. Association of Official Analytical Chemists, Washington DC;1995.
[16] Alinoor I.J, Obiji A. Assessment of trace metal composition in fish samples from Nworie River, Pakistan. J of Nutr. 2010; 9 (1): 81-85, 2010.
[17] Minareci E, Oztrurk M, Ozozen G. 2009. Determination of heavy metals in fish, water and sediments of avsar dam lake in turkey. Iran. J Environ Health Sci Eng. 2009;6: 73-80.
[18] Al-Ghanim KA, Mahboob S, Seemab S, Sultana S, Sultana T, Al-Misned F, Ahmed, Z.. Monitoring of trace metals in tissues of Wallago attu (lanchi) from the Indus River as an indicator of environmental pollution. Saudi J of Biol Sci 2016; 23: 72–78 [19] Chen YC, Chen MH. Heavy Metal Concentrations
in Nine Species of Fishes Caught in Coastal Waters off Ann-Ping, S.W. Taiwan. J of Food and Drug Analy. 2001; Vol. 9, No. 2, 107-11.
[20] Rauf A, Javed M, Ubaidullah M. Heavy metal levels in three major carps (Catla catla, Labeo rohita and Cirrhina mirigala) from the river Ravi Pakistan Pak Vet J. 2009; 29(1): 24-26.
[21] Martillano JK, Paula Alcantara T, Su GS, Ragragio E, Jesus JD, Hallare A. Ramos G. Assessing heavy metals in the waters, fish and macroinvertebrates in manila bay, Philippines. Volume 4, Number 2009; 3: 187-195.
[22] WHO (World Health Organization) Guidelines for drinking water quality (Vol. 1, p. 30). Recommendation. Geneva: WHO; 1985.
[24] Food and Agriculture/World Health Organization (FAO/WHO). Evaluation of certain food additives and the contaminants mercury, cadmium and lead. WHO Technical Report Series No. 505. Geneva; 1972.