*
Corresponding author:
E-mail: [email protected]
Received: May 26, 2017
Approved: November 13, 2017
How to cite: Batista AH, Melo VF, Gilkes R, Roberts M. Identification of heavy metals in crystals of sand and silt fractions of soils by scanning electron microscopy (SEM EDS/ WD-EPMA). Rev Bras Cienc Solo. 2018;42:e0170174.
https://doi.org/10.1590/18069657rbcs20170174
Copyright: This is an open-access article distributed under the terms of the Creative Commons Attribution License, which permits unrestricted use, distribution, and reproduction in any medium, provided that the original author and source are credited.
Division - Soil Processes and Properties | Commission - Soil Mineralogy
Identification of Heavy Metals in
Crystals of Sand and Silt Fractions
of Soils by Scanning Electron
Microscopy (SEM EDS/WD-EPMA)
Araína Hulmnn Batista(1), Vander Freitas Melo(2)*, Robert Gilkes(3) and Malcolm Roberts(4)
(1)
Universidade Federal do Paraná, Departamento de Solos e Engenharia Agrícola, Programa de Pós-Graduação em Ciência do Solo, Curitiba, Paraná, Brasil.
(2)
Universidade Federal do Paraná, Departamento de Solos e Engenharia Agrícola, Curitiba, Paraná, Brasil. (3) The University of Western Australia, School of Geography and Environmental Science, Crawley, Australia. (4) The University of Western Australia, Centre for Microscopy, Characterization and Analysis, Crawley, Australia.
ABSTRACT: Studies of heavy metals are concentrate on clay fractions, but coarser
fractions of the soil can constitute significant sources of structural forms of heavy metals. The aim of this study was to evaluate the occurrence of heavy metals in the structure of minerals of the sand and silt fractions of soils from three different parent materials (metamorphic rocks and granite) in southern Brazil using SEM/EDS - Scanning Electron Microscopy with Energy Dispersive Spectroscopy and with WD-EPMA – with Wavelength Dispersive-Electron Probe Microanalysis. We sampled soils from two areas naturally rich in heavy metals, with high mineral deposits (galena - PbS) hosted in carbonate rocks and phyllite/mica schist. The main form of Ba in the sand and silt fractions was as barite (BaSO4). The precipitation of Ba and S from the soil solution occurred on the surface
of silicate mineral particles. Due to the proximity of ionic radius of Ba-Pb, there was isomorphic substitution of Ba for Pb in the barite structure. The only primary mineral source of Pb in the coarse soil fractions was trioctahedral mica. Several secondary minerals in the silt and sand are sources of structural Pb: plumbogummite, plumboferrite, magnetoplumbite, and cerussite. There was a strong geochemical association of Pb-Fe-Mn. Zinc was also associated with Fe. The SEM/EDS/WD-EPMA techniques are important analyses to complement standard procedures, such as X-ray diffraction and total chemical digestion, in geochemical studies.
INTRODUCTION
Some authors have used X-ray diffraction (XRD) to identify mineral sources of structural forms of heavy metals (Ryan et al., 2008; Roach et al., 2009). Association of P with Pb was found by Batista et al. (2017) using XRD, and the main host of Pb in the clay fractions of soils in the South of Brazil was plumbogummite [PbAl3(PO4)2(OH)5.H2O]. However, minerals
in the soil fraction that are present at contents below about 10 g kg-1 cannot be detected
by XRD (Brindley and Brown, 1980). The predominance of quartz with high crystallinity makes it even more difficult to identify minor mineral sources of heavy metals by XRD in the sand and silt fractions. Another significant limitation of XRD is the occurrence of heavy metals in the structure of Fe and Mn oxides and aluminosilicate minerals, since XRD does not directly determine the chemical composition of these minerals.
Chemical extraction also does not have sufficient selectivity for dissolution of only one mineral phase, which makes the speciation of heavy metals in the soil fractions very imprecise (Duarte et al., 2012; Kummer et al., 2013). The analysis of isolated crystals is the only way to accurately identify the mineral source of structural forms of heavy metals in soil fractions (Batista et al., 2017). The scanning electron microscope (SEM) equipped with an energy dispersive X-ray spectrometer (EDS) has been used in several areas of soil science, such as discrimination of forensic soil (Cengiz et al., 2004), environmental chemistry (Teršič, 2011; Umar and Adamu, 2015), and soil genesis (Simas et al., 2007). The following studies show the association of heavy metals with soil minerals using SEM-EDS: i) Co, Cr, Ni, and V in magnesium silicates and Fe oxides from two serpentine quarries in Galicia (Arenas-Lago et al., 2016); ii) Pb-sulfides and Pb-molybdates in Meza River sediments, Spain (Miller and Gosar, 2009); and iii) several Pb-bearing minerals, such as, galena, anglesite, cerussite, mimetite, and pyromorphite in soils of an abandoned mine, South Wales (Umar and Adamu, 2015). Structural forms of heavy metals in soils is mainly attributed to isomorphic substitution in primary and secondary minerals, and their release into the soil solution involves a slow dissolution process (Prakongkep et al., 2008; Hayes et al., 2009). Some results of isomorphic substitution of Al, Fe, and Mg by heavy metals in minerals can be highlighted. The substitution of Cr for Mg in the M2 site of pyroxene (Mg1.425Cr
2+
0.611Si1.964O6) is associated with an increase
in the mean M2-O bond distance (0.221 nm) over that found in MgSiO3 (Angel et al., 1989).
As the ionic radius of Mg2+
(0.72 nm) and Ni2+ (0.73 nm) is quite similar, isomorphic substitution of these two cations in minerals (octahedral coordination), such as thekerolite-pimelite series (Brindley et al., 1979), is very common. The greater the difference between the ionic radius of the elements involved, the more difficult isomorphic substitution will be (Kummer et al., 2013). Our study region is part of the geomorphological domain of the Açungui Group in the municipality of Adrianópolis, Paraná, Brazil. Successive transformations due to compressive efforts led to metamorphism of the rocks and the flow of hydrothermal fluids rich in heavy metals (Faleiros et al., 2007). Lead ores, containing galena (PbS), are often associated with minerals rich in Zn, Cu, As, and Ag in the area studied (Kummer et al., 2013).
We used total digestion (concentrated HF + HNO3) of rock, sand, and silt samples to
release structural forms of Pb, As, Ba, and Zn; and XRD analysis to determine the mineral source of these elements. These analyses have been used in geochemical studies (Ryan et al., 2008; Kummer et al., 2013) but are not enough to ensure identification of all mineral sources of structural forms of heavy metals in soil. In chemical extractions, the contribution of individual mineral sources of heavy metals is lost.
MATERIALS AND METHODS
Area characterizationSoil samples were collected in three different areas in the municipality of Adrianópolis, Paraná, in southern Brazil (Figure 1). Each area has a distinct parent material. Two of the areas studied have high mineral deposits (galena - PbS) in marble (area 1) and phyllite/ mica schist (area 2) (Table 1).
Area 1. Calcite Marble
Twelve soil samples were obtained from six different profiles [Entisol and Inceptisol (Soil Survey Staff, 1999)], with surface and sub-surface soil sampling (Table 1). The correspondent soil classes according to Brazilian System of Soil Classification (Santos et al., 2013) are Neossolo Litólico Eutrófico típico and Cambissolo Háplico Ta Eutrófico típico, respectively.
Area 2. Phyllite and mica schist
Mining was carried out at this site and soils were heavily modified, with destruction of pedogenetic horizons (Table 1). Only surface samples were considered.
Area 3. Itaoca Granite
The Itaoca batholith is a discordant contact intrusion, with quartzites, schists, and marbles. Only one profile [Incepitsol (Soil Survey Staff, 1999); Cambisolo Háplico Tb Ditrófico típico (Santos et al., 2013)] was selected (Table 1). On the basis of the distinct geochemical processes and low contents of heavy metals (Table 1), this profile was chosen as a reference, before metamorphism events in the region. Successive transformations due to compressive efforts led to metamorphism of the granite and the flow of hydrothermal fluids rich in heavy metals (Faleiros et al., 2007). Areas 1 and 2 have metamorfic rocks as parent material and have more Pb in the soils (Table 1).
Sample preparation and particle size analysis of soils
The soil samples were air dried and sieved (2 mm). Particle size analysis was performed by the pipette method (Gee and Bauder, 1986).
AM PA
AP RR
AC RO
MT DF
GO TO
MA PI
CE RN PB PE AL SE BA
MG ES RJ Adrianópolis
10 km
Adrianópolis
Ribeira River
Curitiba 2
3 1
SP PR
SC RS MS
N
Sand and silt separation
Organic matter was removed by treating a 20 g subsample of soil with H2O2 (30 % v/v)
in a water bath at 70 °C. Samples were dispersed with 0.2 mol L-1 NaOH, and the sand
fraction was retained in a 0.053 mm mesh sieve. The silt and clay fractions were separated by sedimentation according to Stokes’ law (Gee and Bauder, 1986).
Total content of heavy metals in rock, sand, and silt fractions
Samples of fine rock, sand, and silt (0.5 g - ground and sieved at 0.25 mm) were placed in a sealed Teflon tube (microwave irradiation) with 9 mL of concentrated HNO3 and 3 mL
of concentrated HF (EPA 3052 - Usepa, 1997). The total contents of Pb, As, Ba, and Zn were determined by ICP- OES (Varian 720 ES Axial).
X-ray diffraction (XRD)
Rocks, sand, and silt were analyzed by XRD (randomly oriented powder samples). The XRD patterns were obtained with a vertical goniometer with a scan speed of 0.5 °2θ min-1
and range of 2 to 50 °2θ. The diffractometer (Philips - PW 3020), equipped with a graphite monochromator and CuKα radiation, was operated at 40 kV and 30 mA.
Table 1. General properties and total contents of Pb, As, Ba, and Zn (EPA 3052 - Usepa, 1997) in soils of areas 1, 2, and 3
Sample Profile Horizon Depth UTM (22J) Pb As Ba Zn
Latitude Longitude
m mg kg-1
Area 1
1 1 A 0.00-0.15
7268600 S 710624 W 3208 74 85 331
2 1 AB 0.15-0.25 1120 50 38 180
3 2 A1 0.00-0.15
7268609 S 710648 W 2058 53 75 254
4 2 A2 0.15-0.25 1490 50 76 239
5 3 A 0.00-0.15
7268583 S 710609 W 1606 52 81 245
6 3 AB 0.15-0.30 516 37 97 158
7 4 A 0.00-0.15
7268561 S 710585 W 454 33 32 131
8 4 AB 0.15-0.30 309 26 71 132
9 6 A 0.00-0.10
7268497 S 710678 W 336 26 12 101
10 6 AC 0.10-0.25 128 22 10 56
11 7 A 0.00-0.10
7268459 S 0710657 W 799 27 78 139
12 7 AB 0.10-0.30 408 16 70 102
Area 2
13 8 - 0.00-0.10 7251277 S 0701793 W 1939 44 433 1384
14 9 - 0.00-0.10 7251279 S 0701825 W 574 10 287 139
15 10 - 0.00-0.10 7251412 S 0701845 W 51032 271 453 1097
16 11 - 0.00-0.10 7251412 S 0701845 W 24537 165 245 627
17 12 - 0.00-0.10 7251473 S 0701807 W 17963 309 395 831
18 13 - 0.00-0.10 7251471 S 0701807 W 6727 294 509 1098
19 14 - 0.00-0.10 7251498 S 0701812 W 12135 102 451 1907
20 15 - 0.00-0.10 7251515 S 0701815 W 8887 85 385 1518
21 16 - 0.00-0.10 7251520 S 0701804 W 5884 93 635 1702
22 17 - 0.00-0.10 7251549 S 0701842 W 3120 91 467 699
23 18 - 0.00-0.10 7251549 S 0701842 W 7886 90 499 1365
Area 3
24 19 A 0.00-0.30
0715399 S 7269531 W
26 8 20 37
25 19 AB 0.30-0.45 34 10 19 37
26 19 BC 0.45-0.60 1 9 11 45
27 19 C 0.60-0.90+
2 10 10 32
Scanning electron microscopy (SEM) analysis
Samples 4 (area 1); 15 and 23 (area 2); and 25 (area 3) were analyzed with a Tescan Vega 3 scanning electron microscope (SEM) equipped with an Oxford X Max50 energy dispersive X-ray spectrometer (EDS). Analytical conditions were 15 kV and working distance of 15 mm. Count rates were adjusted to give >15-20 kcps, and beam intensity was calibrated on a pure Cu standard. The SEM coupled to an energy dispersive X-ray spectrometer (EDS) provided imaging and spatially resolved elemental analyses on a microscopic scale. The interaction of the electron beam with the atoms of the sample produces X-rays that are characteristic of the elements present in the sample, which are identified by the EDS. Images obtained in backscatter electron mode allow identification of areas with different atomic numbers. The grey scale of the images is related to the relative mean atomic number of the particles, with brighter particles having elements of higher mean atomic numbers. The sand fraction was prepared as fine polished and unpolished samples. Selected sand samples were embedded in epoxy resin and then polished sections were prepared. Polished samples were used to acquire quantitative chemical maps using wavelength dispersive spectrometry by EPMA on a JEOL 8530F Hyperprobe. This instrument is equipped with five wavelength dispersive spectrometers. Operating conditions for instrument calibration prior to the mapping run were a 40 degree take-off angle, beam energy of 20 keV, beam current of 20 nA, and 20 second on-peak counting time. The elements were acquired using the analyzing crystals LiF for Ba lβ, Zn, Cu, Fe, Mn and Ti kα, PET for S, Ca, K kα and Pb mα, and TAP for Al, Mg, and Si kα. The standards employed were commercially available metals, oxides, silicates, and phosphates. Mean atomic number background and ZAF corrections were used throughout. For map acquisition, the beam was fully focused and set to 80 nA with a dwell time per pixel of 50 ms and a 2 × 2 µm pixel dimension. Image processing was performed off-line with CalcImage® software.
Unpolished samples were placed on a metal support and fixed on carbon tape placed on a stub (SEM sample holder). Samples were covered with a thin carbon film to provide a conductive surface. The same procedure was used for the silt fraction.
The chemical formulas of minerals were calculated from chemical analyses of individual crystals (SEM) and are based on the ideal formulas of minerals (Hetzel and Doner, 1993).
RESULTS AND DISCUSSION
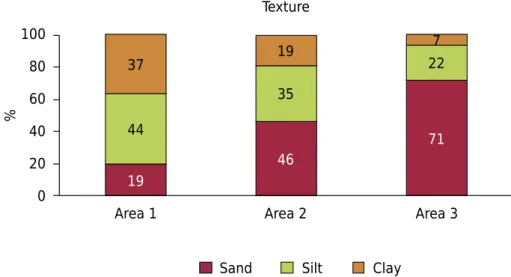
Soil textureThe variation in sand + silt contents (Figure 2) primarily reflects the different lithologies of the three areas: greater amount of quartz in the parent materials in area 2 and especially in area 3. Considering the high contents of these coarse fractions (63 to 93 %), it is important to study their mineralogical and chemical properties to identify minerals that are sources of heavy metals in soils rich in these elements (Table 1).
The soils of area 2 have higher heavy metal (Table 1) and sand + silt (Figure 2) contents than the soils of area 1. In both areas, metamorphic rocks contained higher contents of heavy metals. Although the soils of area 3 had the highest levels of sand + silt, the weathering of granite released small contents of heavy metals.
Mineralogical composition of rock, sand, and silt samples
Great mineralogical diversity was observed in samples 15 and 23 (area 2): olivine, barite, quartz, mica, feldspar, vermiculite, and plumbogummite. Plumbogummite is an aluminous hydrated phosphate and has very low solubility in soils (Rivera et al., 2015).
19 46 71 44 35 22 37 19 7 0 20 40 60 80 100
Area 1 Area 2 Area 3
%
Texture
Sand Silt Clay
Figure 2. Average distribution of sand, silt, and clay for areas 1, 2, and 3.
(a)
S Qz Ca Ca
Ve Mi Mi Sm Mi Fd Fd Fd Mc Es Mi Ba Mi Mi Sm Mi Es Qz Ca Fd In Cb Gt Gt In Ca Gt Ca S Hm Ca Mi Ca Ve Ve Sm Ka Mi Mi O O Gt Ka Qz Qz Ba Fd Fd Fd Fd OO Hm/Gt O Qz Ba Ba Mi Pb Ve Ve Ve Mi Mi
Zr BaFd Ba Fd PbMi Ol Ol Ba Mi Pb
2 12 22 32 42 2
2θ o2θ
12 22 32 42
Pb Gb
Fd Ol
Ol Pb Ba Cl Pb Pb Ba Fd Qz Ol Ba Mi Mi Pb Gt/Hm Fd Ba Ba Qz Qz Qz Qz Fd Fd Sm Mi Mi Mi Mi Cl Cl Ba Ba Mi Gt Gt Mi Mi Mi Es Ba A R S A R S A R S A R (b) (c) (d)
Total contents of Pb, As, Ba, and Zn in rock, sand, and silt samples
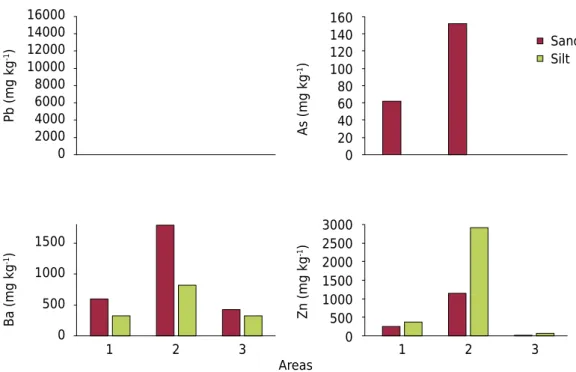
In area 1, with the exception of As, the heavy metal contents in the rocks were consistently lower than in the sand and silt fractions (Table 2). Heavy metals have low mobility in relation of Ca2+ and Mg2+ and high persistence in the environment, and they accumulate in the soil
profile (Rivera et al., 2015). In geochemical processes, Ba is associated with K because of the similarity of their ionic radius (Ba - 0.135 nm; K - 0.133 nm) (Klein and Hurlbut, 1993). The parent material and sand and silt fractions of area 2 have the highest contents of Pb, Ba, Cu, and Zn (Table 2; Figure 4). Plumbogummite and barite were identified in the sand and silt fractions of samples 15 and 23 (Figure 3). In area 2, there was more evidence of veins of Pb ores (Mello and Bettencourt, 1998). Several studies have already shown that parent material has a strong influence on soil chemistry (Acosta et al., 2011; Ramos-Miras et al., 2014; Rivera et al., 2015).
The low contents of heavy metals in soils and in their coarse fractions in area 3 (Table 2 and Figure 4) are consistent with the very low heavy metal contents of the granitic parent material (Table 2). This result shows the importance of the metamorphism process in enhancing heavy metals in the soil fractions of areas 1 and 2 in relation to area 3. The metamorphism in the area studied generated hydrothermal fluids rich in Pb, Zn, and Cu (Rivera et al., 2015).
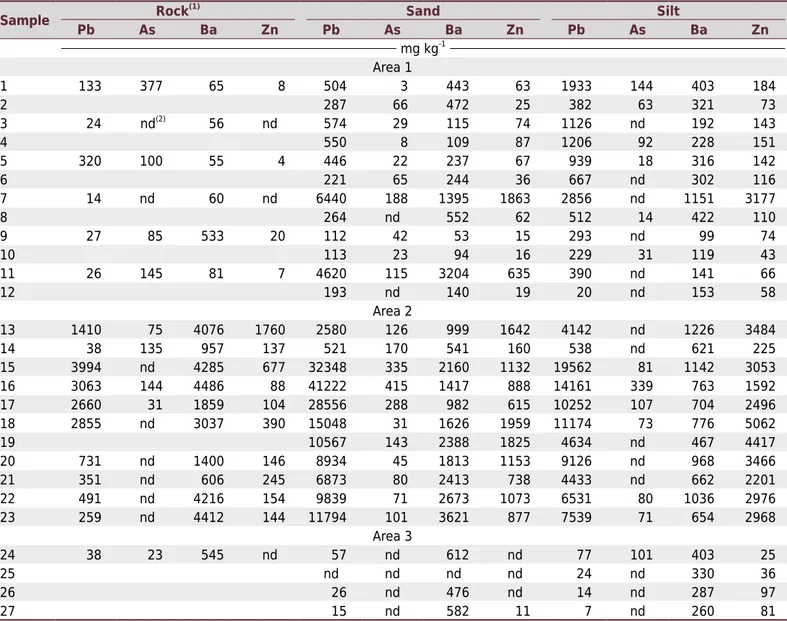
Table 2. Total contents of Pb, As, Ba, Zn, and Cu in sand and silt fractions of soils in areas 1, 2, and 3
Sample Rock
(1) Sand Silt
Pb As Ba Zn Pb As Ba Zn Pb As Ba Zn
mg kg-1
Area 1
1 133 377 65 8 504 3 443 63 1933 144 403 184
2 287 66 472 25 382 63 321 73
3 24 nd(2)
56 nd 574 29 115 74 1126 nd 192 143
4 550 8 109 87 1206 92 228 151
5 320 100 55 4 446 22 237 67 939 18 316 142
6 221 65 244 36 667 nd 302 116
7 14 nd 60 nd 6440 188 1395 1863 2856 nd 1151 3177
8 264 nd 552 62 512 14 422 110
9 27 85 533 20 112 42 53 15 293 nd 99 74
10 113 23 94 16 229 31 119 43
11 26 145 81 7 4620 115 3204 635 390 nd 141 66
12 193 nd 140 19 20 nd 153 58
Area 2
13 1410 75 4076 1760 2580 126 999 1642 4142 nd 1226 3484
14 38 135 957 137 521 170 541 160 538 nd 621 225
15 3994 nd 4285 677 32348 335 2160 1132 19562 81 1142 3053
16 3063 144 4486 88 41222 415 1417 888 14161 339 763 1592
17 2660 31 1859 104 28556 288 982 615 10252 107 704 2496
18 2855 nd 3037 390 15048 31 1626 1959 11174 73 776 5062
19 10567 143 2388 1825 4634 nd 467 4417
20 731 nd 1400 146 8934 45 1813 1153 9126 nd 968 3466
21 351 nd 606 245 6873 80 2413 738 4433 nd 662 2201
22 491 nd 4216 154 9839 71 2673 1073 6531 80 1036 2976
23 259 nd 4412 144 11794 101 3621 877 7539 71 654 2968
Area 3
24 38 23 545 nd 57 nd 612 nd 77 101 403 25
25 nd nd nd nd 24 nd 330 36
26 26 nd 476 nd 14 nd 287 97
27 15 nd 582 11 7 nd 260 81
(1) With the exception of sample 19 (no rock was found in this profile), only one rock sample for each soil profile was collected. For this reason, in the samples
Chemical composition (unpolished sample) of sand and silt particles by SEM-EDS The only mineral sources of heavy metals found in some rock, sand, and silt samples by XRD were plumbogummite and barite. The use of SEM-EDS is important to confirm the presence and determine the chemical composition of these minerals. In most samples, no Pb, As, and Zn sources were identified by XRD, but in the total digestion of rock, sand, and silt samples, different amounts of heavy metals were released. In this situation, only analysis of isolated particles of sand and silt (SEM-EDS) allows identification of specific minerals that host structural forms of heavy metals. The result from the areas studied is shown separately, as follows.
Area 1
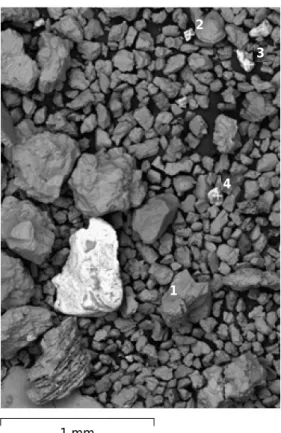
Backscattered electron image obtained from sand of sample 4 is shown in figure 5. The grey scale seen in this image relates to the relative mean atomic number of the particles, in which brighter particles have higher mean atomic numbers.
Lead in some particles is associated with high contents of Fe and Mn (Figure 5): point 2 Fe = 55.5 % and Pb = 22 %; point 3 Fe = 38.2 %, Mn = 33.7 %, and Pb = 3.4 %. Due to the greater ionic radius of Mn2+
(0.083 nm) and Fe2+ (0.076 nm) in relation to Al3+ (0.050 nm) and Si4+ (0.041 nm) (Klein and Hurlbut, 1993), it is highly likely that isomorphic
substitution of Pb2+
(0.119 nm) occurs in Mn and Fe minerals. The affinity between Pb and Fe and Mn minerals has also been highlighted in other studies (Miler and Gosar, 2012; Courtin-Nomade et al., 2016). There was no correlation between Pb and S (Table 3). Galena was also not identified in X-ray analysis (Figure 3).
The chemical composition of particle 2 (Figure 5) is consistent with plumboferrite. The minimum formula calculated for this mineral based on atomic element contents (SEM-EDS) is Pb2Mn
2+
0.2Mg0.1Fe 3+
10.6O18.4. The theoretical composition of plumboferrite is 45 % Fe, 32 %
Pb, and 22 % O (Courtin-Nomade et al., 2016). This mineral occurs in Pb ore, containing Fe-Mn (Mello and Bettencourt, 1998). The presence of minor quantities of Si and Ca in this analysis may be the result of contamination by silicate mineral(s) on the surface of particle 2. Pure particles with the ideal chemical composition of minerals are exceptional, as most grains are associations of particles (Batista et al., 2017). Particle 3 has 3.4 % Pb (Figure 5, Table 3) and it occurs in the form of secondary precipitations of Fe-Mn-Pb oxide. Figure 4. Average of total contents of Pb, As, Ba, and Zn in sand and silt fractions in areas 1, 2, and 3.
0 2000 4000 6000 8000 10000 12000 14000 16000
Sand Silt
0 20 40 60 80 100 120 140 160
0 500 1000 1500
1
Ba (mg kg
-1)P
b (mg kg
-1)
Zn (mg kg
-1)A
s (mg kg
-1)
2 3
Areas 0 500 1000 1500 2000 2500 3000
Particles with moderate contents of Pb (2.5 %) in silt also have larger Fe contents (34.2 %) (Table3), and sand particles show similar behavior (isomorphic substitution of Fe by Pb). Apparently, particles 3 and 4 in silt (Table 3) are calcium carbonate (CaCO3). This mineral
has also been identified by XRD (Figure 3a). Particle 1 in silt has Ca (5.2 %) and Mg (9.8 %) in the structure. These Ca and Mg contents are compatible with amphibole minerals (identified in XRD analysis). There are no heavy metals in the amphibole structure (Table 3).
Area 2
The sand and silt particles have high contents of Pb, especially compared to area 1, according to the contents of Pb in these two areas obtained by total extraction (Table 2, Figure 4). In area 2, the samples with high contents of Fe also have high contents of Pb (Figure 6a, Table 4): point 4 = 29.3 % Fe and 20.3 % Pb; point 3 = 32.9 % Fe and 7.9 % Pb;
1 mm
1
4 3 2
Figure 5. Scanning Electron Microscopy images of sand particles from sample 4 (area 1).
Table 3. Chemical analysis (% - m/m) of sample 4 for silt particles (EDS image is not shown) and selected sand particles identified in figure 5
Element 2 Sand3 4 1 2 Silt 3 4
O 16.7 9.6 9.4 47.1 38.5 39.0 36.0
Si 1.1 1.7 7.7 16.4 9.1 9.7 11.5
Al <1(1) nd(2) 4.6 <1 2.5 1.6 1.4
Fe 55.5 38.2 73.0 <1 34.2 nd nd
Ca 1.2 12.0 3.1 5.2 1.5 19.3 16.9
Pb 22.0 3.4 <1 nd 2.5 nd nd
Mg <1 nd <1 9.8 <1 nd nd
Zr nd nd nd nd <1 nd nd
Ti nd <1 <1 nd nd 20.8 17.2
Mn <1 33.7 nd nd nd nd nd
C nd nd nd 19.6 9.3 8.8 16.8
(1)
point 10 = 56.1 % Fe and 5.4 % Pb. The chemical composition of particle 2 (Figure 6a) indicates the presence of trioctahedral mica (Table 4), with a relatively high Pb content (1.8 %) for a phylosilicate. Mica was observed (XRD) in area 2 (Figure 3). Lead may be located on octahedral sites of phylosilicate, substituting Mg2+ and Fe2+ (Acosta et al., 2011),
or between the layers in ditrigonal sites, usually occupied by K+. The high temperature
and pressure conditions during metamorphic processes (areas 1 and 2) may promote isomorphic substitution in primary minerals (Klein and Hurlbut, 1993).
Samples 15 and 23 contain particles with high variation of Ba contents (0.5-1.0 to 80.9 %) (Figure 6 and 7, Tables 4 and 5). In particle 9 (Figure 6a, Table 4), Ba (68.3 %) is associated with Fe (13.2 %). Barium was also observed in the form of barite (BaSO4) in an aluminosilicate
matrix (Figure 6b): point 1 = 49.7 % Ba, 12.7 % S, and 7.5 % Pb. The ideal chemical composition of barite is: 58.8 % Ba, 13.7 % S, and 27.4 % O. The smaller content of Ba in point 1 (Figure 6b) is attributed to isomorphic substitution of Ba by Pb. The difference between the ionic radius of Ba2+ (0.134 nm) and Pb2+ (0.119 nm) is only 13 %.
The particle in the center of Figure 6b has dark and light portions. The dark portion (point 2 - silicate mineral) contains 2.6 % Pb, without Ba (Table 4). The silicon portion also has Zn and Cu. This double composition in the same particle reinforces that barite was formed by the precipitation of Ba and S from the soil solution onto the surface of sand particles. The low solubility of barite (BaSO4) implies a strong preferential partitioning of
Table 4. Chemical analysis (% - m/m) of sample 15 for selected sand particles identified in figure 6
Element 2 3 4Figure 6a8 9 10 1 Figure 6b2 3 2Figure 6c4
O 45.3 15.2 41.5 23.2 8.1 25.5 28.8 46.7 34.6 33.7 22.0
Si 24.9 17.0 4.8 13.0 5.3 7.5 <1(1)
13.8 <1 6.4 3.5
Al 11.3 10.1 1.9 1.1 1.3 4.3 nd(2)
8.2 <1 1.3 nd
Fe 8.3 32.9 29.3 51.7 13.2 56.1 nd 3.5 18.5 39.4 <1
Ca nd <1 nd nd nd nd nd 1.6 nd nd nd
Pb 1.8 7.9 20.3 1.7 1.9 5.4 7.5 2.6 2.1 15.9 72.4
K 5.8 2.5 nd nd nd nd nd nd nd nd nd
Na nd nd nd nd nd nd nd 1.8 nd nd nd
Mg 2.1 <1 nd 7.7 1.9 nd nd 9.6 nd nd nd
Ba nd nd nd nd 68.3 nd 49.7 nd nd nd nd
Mn nd 11.8 nd nd nd nd nd nd nd nd nd
S nd nd nd nd nd nd 12.7 nd nd nd nd
Zn nd nd nd nd nd nd nd 9.7 nd nd nd
Cu nd nd <1 1.1 nd nd nd 1.6 nd 2.2 nd
Ti nd 1.3 nd nd nd nd nd <1 42.6 nd nd
(1)
Content <1 % represents contents between 0.5-1 %. (2) nd = below the level of detection of the SEM-EDS (<0.5 %).
Figure 6. Scanning Electron Microscopy images of sand particles from sample 15 (area 2).
0.5 mm 0.1 mm 1 mm
(a) (b) (c)
2 3
8
4
2 3
4 3
2
1
1
10 11
5
9 12
4
6
Ba to the solid phase (González et al., 2008). The point 3 particle (Figure 6b) has 42.6 % Ti, 18.5 % Fe, and 2.1 % Pb, probably formed by weathering of ilmenite.
Point 2 (Figure 6c) is a particle with high Fe and Pb contents (Table 4). In this case, it has two different minerals, and there is no direct association between Pb and Fe; in the image, these two particles have different colors. The brightest portion is probably cerussite (PbCO3)
precipitated on the depression of iron oxide. The main result in figure 6c is particle 4, with isolated particles of PbCO3 (Table 4). The Pb content in particle 4 (72.4 %) is quite close to
the Pb content in cerussite (ideal composition of 77.5 % Pb). The precipitation of cerussite is consistent with the very high Pb contents in soils of area 2 (Table 2).
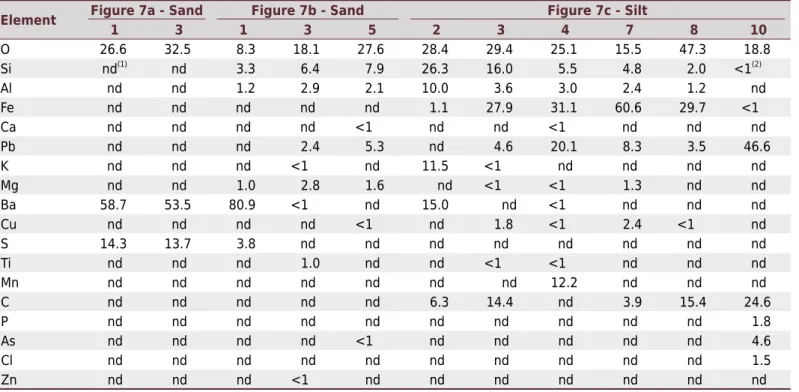
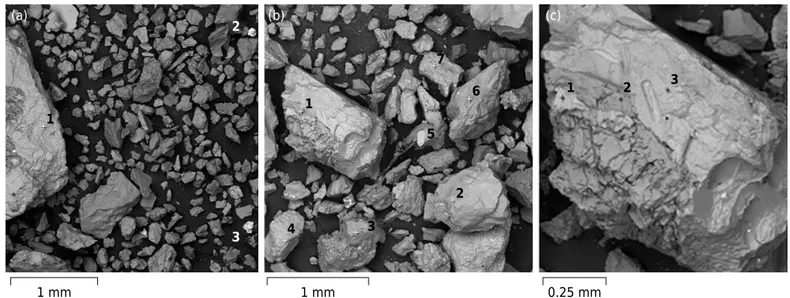
The sand of sample 23 and the sand of sample 15 have similar behavior (Figure 7a, Table 5): barite - points 1 and 3; phylossilicates - points 2 and 4. Most Ba (80.9 %) (barite) was found in Figure 7b (point 1). Lead was not observed at points with high Ba contents. Point 2 of sample 23 (silt fraction) (Figure 7c, Table 5) indicates K-feldspar. Potassium can be replaced by Ba in K-feldspar (González-Acebrón et al., 2012). Point 7 is a particle of iron
0.25 mm 0.5 mm 0.1 mm
(a) (b) (c)
2
3
7
4 6
1
11 7 1
2
10 8 9
3
4 6
5 5
1
4 3
2
Figure 7. Scanning Electron Microscopy images of sand (A and B) and silt (C) particles from sample 23.
Table 5. Chemical analysis (% - m/m) of sample 23 for selected particles identified in figure 7
Element Figure 7a - Sand1 3 1Figure 7b - Sand3 5 2 3 Figure 7c - Silt4 7 8 10
O 26.6 32.5 8.3 18.1 27.6 28.4 29.4 25.1 15.5 47.3 18.8
Si nd(1)
nd 3.3 6.4 7.9 26.3 16.0 5.5 4.8 2.0 <1(2)
Al nd nd 1.2 2.9 2.1 10.0 3.6 3.0 2.4 1.2 nd
Fe nd nd nd nd nd 1.1 27.9 31.1 60.6 29.7 <1
Ca nd nd nd nd <1 nd nd <1 nd nd nd
Pb nd nd nd 2.4 5.3 nd 4.6 20.1 8.3 3.5 46.6
K nd nd nd <1 nd 11.5 <1 nd nd nd nd
Mg nd nd 1.0 2.8 1.6 nd <1 <1 1.3 nd nd
Ba 58.7 53.5 80.9 <1 nd 15.0 nd <1 nd nd nd
Cu nd nd nd nd <1 nd 1.8 <1 2.4 <1 nd
S 14.3 13.7 3.8 nd nd nd nd nd nd nd nd
Ti nd nd nd 1.0 nd nd <1 <1 nd nd nd
Mn nd nd nd nd nd nd nd 12.2 nd nd nd
C nd nd nd nd nd 6.3 14.4 nd 3.9 15.4 24.6
P nd nd nd nd nd nd nd nd nd nd 1.8
As nd nd nd nd <1 nd nd nd nd nd 4.6
Cl nd nd nd nd nd nd nd nd nd nd 1.5
Zn nd nd nd <1 nd nd nd nd nd nd nd
(1)
nd = below the level of detection of the SEM-EDS (<0.5 %). (2)
oxide (60.6 % Fe), with 8.3 % Pb (isomorphic substitution). Point 3 in the same image is an association between Fe-Pb and carbon (Table 5, Figure7c). The likely source of carbon was mica schist (parent material), which has pyrobetuminous facies (Mello and Bettencourt, 1998). The same behavior can be observed at point 10 - C (24.6 %), Pb (46.6 %), and O (18.8 %).
Chemical analysis of point 8 (Figure 7c, Table 5) can be compared with humboldtine (theoretical formula - Fe2+(C
2O4)·2(H2O), Fe 31 %, C 13.4 %, and O 53.4 %). The Pb (3.5 %)
input in the particle was probably replacing Fe2+ (0.076 nm), which has a higher ionic
radius than Fe3+(0.065 nm) and is more compatible with Pb2+. Humboldtine belongs to
the natural oxalate group of minerals (Frost, 2004).
Point 4 (Figure 7c, Table 5) has no carbon and is compatible to magnetoplumbite (calculated formula based on SEM-EDS analysis: Pb1.1Fe
3+ 7.7Mn
3+ 2.6Mn
2+
0.6Ti0.6Al0.4Ca0.1O19). The ideal
composition of magnetoplumbite (Ca 0.5 %, Ti 2.4 %, Mn 14.9 %, Al 0.9 %, Fe 36.4 %, Pb 19.3 %, and O 25.7 %) is quite similar to the chemical composition of particle 4 (Table 5).
Area 3
In sample 25, there are more quartz grains (Figure 8b, points 2 and 3). Feldspars or mica mineral could be observed in figure 8a (point 1), as well as barite (point 2) and ilmenite (point 3) (Table 6). Lead was not detected at any point analyzed by SEM-EDS. Sample 25 has low levels of Pb (Table 2: rock = 33 mg kg-1; sand = 22 mg kg-1; and silt = 5 mg kg-1).
Point 1 is a K-feldspar (Figure 8c), with 1.3 % Ba.
Table 6. Chemical analysis (% - m/m) of sample 25 for selected sand particles identified in figure 8
Element 1 Figure 8a2 3 1 Figure 8b2 6 1Figure 8c3
O 42.4 35.5 33.6 50.3 52.6 61.2 49.4 34.7
Si 29.1 4.4 6.4 28.1 47.4 37.9 27.7 9.0
Al 11.3 2.9 <1(1)
9.1 nd(2)
<1 9.3 1.9
Fe 3.5 6.6 36.5 nd nd nd nd 14.5
Ti nd nd 23.3 nd nd nd nd 30.9
Ba 1.4 40.9 nd nd nd nd 1.3 3.0
K 12.3 nd nd 12.0 nd nd 11.9 1.1
Na nd nd nd nd nd nd nd 3.0
V nd nd nd nd nd nd nd <1
S nd 9.7 nd nd nd nd nd nd
(1)
Content <1% represents content between 0.5-1 %. (2) nd = below the level of detection of the SEM-EDS (<0.5 %).
1 mm 1 mm 0.25 mm
(a) (b) (c)
2
3
1
1
6 1 2 3
7
5
2
4 3
Element distribution maps (polished sample) of sand particles by SEM-WD/EPMA There are strong associations between Pb/Mn and Fe/Mn (Figure 9). Some Fe-rich particles showed intermediate contents of Pb. Zinc is associated with Fe. Iron is mostly substituted by Al3+, Ti4+, Mg2+, Zn2+, and Mn2+ in iron oxides (Schwertmann and Fechter, 1984).
In synthesized maghemites, the degrees of substitution of Fe3+
for Zn2+ can reach a
maximum of 0.34 mol mol-1 (Batista et al., 2008). The metallogenetic associations
Fe/Mn and Fe/Zn are usually found in mineral deposits (Courtin-Nomade et al., 2016). The association among Pb-Mn-Fe is also in the form of precipitate. There is a coating of Pb-Mn-Fe precipitated on the borders of the barite particle (BaSO4) (inside of the red
circle in figure 9). There are geochemical associations between Fe and Mn oxides and heavy metals (Singh et al., 1999). The Fe and Mn oxide constitutes a significant sink for heavy metals in the environment (Zakir and Shikazono, 2011).
Pb S
Mn Ba
Zn Fe
Pb Wt % 90 85 80 75 70 65 60 55 50 45 40 35 30 25 20 15 10 5 75 70 65 60 55 50 45 40 35 30 25 20 15 10 5 S Wt %
Mn Wt % Ba Wt %
Zn Wt % Fe Wt %
2 1 3 4 5 6 7 8 9 10 11 12 13 10 5 15 20 25 30 35 40 45 50 55 60 65 14 15 4 2 6 8 10 12 14 16 18 20 22 24 26 28 30 16 17 18 6 7 8 9 10 1 2 3 4 5 11 12 13 14
Figure 9. Elemental maps showing chemical distribution in polished sand sample 23. The precipitation of Pb-Mn-Fe around the barite
CONCLUSIONS
Chemical analysis with an SEM EDS/WD-EPMA instrument has considerable potential for locating heavy metals in sand and silt fractions and should be regularly used in studies of soil geochemistry. No other technique can provide such a direct examination of the location (speciation) of heavy metals in coarse soil fractions. This analytical technique allowed inferences to be made regarding the genesis of secondary mineral sources of heavy metals.
Barite (BaSO4) was the main form of Ba in the sand and silt fractions. Barium and S from
the soil solution precipitated onto the surface of silicate mineral particles. There was Pb input in the barite particle.
Trioctahedral mica was the only primary mineral source of Pb in the coarse soil fractions. Several secondary minerals in the silt and sand fractions are sources of Pb as a result of precipitation of Pb released from galena with other elements: plumbogummite (Pb, Al, and P), plumboferrite (Pb and Fe), magnetoplumbite (Pb, Ca, Ti, Mn, Al, and Fe), humboldtine (Pb, Fe, and C), and cerussite (Pb and CO32-).
Geochemical associations were observed between Pb-Fe-Mn in the form of precipitate of Pb with Mn and Fe oxides in the sand and silt fractions. Zinc was also associated with Fe.
REFERENCES
Acosta JA, Martínez-Martínez S, Faz A, Arocena J. Accumulations of major and trace elements in particle size fractions of soils on eight different parent materials. Geoderma. 2011;161:30-42. https://doi.org/10.1016/j.geoderma.2010.12.001
Angel RJ, Gasparik T, Finger LW. Crystal structure of a Cr2+
-bearing pyroxene. Am Mineral. 1989;74:599-603.
Arenas-Lago D, Andrade MA, Vega FA, Singh BR. TOF-SIMS and FE-SEM/EDS to verify the heavy metal fractionation in serpentinite quarry soils. Catena. 2016;136:30-43. https://doi.org/10.1016/j.catena.2015.03.005
Batista AH, Melo VF, Gilkes R. Scanning and transmission analytical electron microscopy (STEM-EDX) identifies minor minerals and the location of minor elements in the clay fraction of soils. Appl Clay Sci. 2017;135:447-56. https://doi.org/10.1016/j.clay.2016.10.032
Batista MA, Costa ACS, Souza Junior IG, Bigham JM. Cristallochemical characterization of
synthetic Zn-substituted maghemites (g-Fe2-xZnxO3). Rev Bras Cienc Solo. 2008;32:561-8.
https://doi.org/10.1590/S0100-06832008000200011
Brindley GW, Bish DL, Wan H-M. Compositions, structures and properties of nickel-containing minerals in the kerolite-pimelite series. Am Mineral. 1979;64:615-25.
Brindley GW, Brown G. Crystal structures of clay minerals and their X-ray identification. Madison: Mineralogical Society; 1980.
Cengiz S, Karaca AC, Çakır I, Üner HB, Sevindik A. SEM–EDS analysis and discrimination of forensic soil. Forensic Sci Int. 2004;141:33-7. https://doi.org/10.1016/j.forsciint.2003.12.006 Courtin-Nomade A, Waltzing T, Evrard C, Soubrand M, Lenain J-F, Ducloux E, Ghorbel S, Grosbois C, Bril H. Arsenic and lead mobility: from tailing materials to the aqueous compartment. Appl Geochem. 2016;64:10-21. https://doi.org/10.1016/j.apgeochem.2015.11.002
Duarte AP, Melo VF, Brown GG, Pauletti V. Changes in the forms of lead and manganese in soils
by passage through the gut of the tropical endogeic earthworm (Pontoscolex corethrurus). Eur J
Soil Biol. 2012;53:32-9. https://doi.org/10.1016/j.ejsobi.2012.08.004
Faleiros FM, Campanha GAC, Bello RMS, Fuzikawa K. Fault-valve action and vein development during strike-slip faulting: an example from the Ribeira Shear Zone, Southeastern Brazil. Tectonophysics. 2007;438:1-32. https://doi.org/10.1016/j.tecto.2007.03.004
Gee GW, Bauder JW. Particle-size analysis. In: Klute A, editor. Methods of soil analysis: physical and mineralogical methods. 2nd ed. Madison: American Society of Agronomy; 1986. Pt 1. p. 383-411.
González AF, Pedreira VB, Pietro M. Crystallization of zoned (Ba,Pb)SO4 single
crystals from aqueous solutions in silica gel. J Cryst Growth. 2008;310:4616-22. https://doi.org/10.1016/j.jcrysgro.2008.07.078
González-Acebrón L, Götze J, Barca D, Arribas J, Mas R, Pérez-Garrido C. Diagenetic albitization in the Tera Group, Cameros Basin (NE Spain) recorded by trace elements and spectral cathodoluminescence. Chem Geol. 2012;312-313:148-62. https://doi.org/10.1016/j.chemgeo.2012.04.012
Hayes SM, White SA, Thompson TL, Maier RM, Chorover J. Changes in lead and zinc lability during weathering-induced acidification of desert mine tailings: coupling chemical and micro-scale analyses. Appl Geochem. 2009;24:2234-45. https://doi.org/10.1016/j.apgeochem.2009.09.010 Hetzel F, Doner HE. Some colloidal properties of beidellite: comparison with low and high charge montmorillonites. Clay Clay Miner. 1993;41:453-60. https://doi.org/10.1346/CCMN.1993.0410406 Klein C, Hurlbut CS. Manual of mineralogy. 21st ed. New York: John Wiley & Sons; 1993. Kummer L, Melo VF, Barros YJ. Lead and zinc in the structure of organic and mineral soil components. Rev Bras Cienc Solo. 2013;37:438-49. https://doi.org/10.1590/S0100-06832013000200015
Mello ISC, Bettencourt JS. Geologia e gênese das mineralizações associadas ao maciço Itaoca, Vale do Ribeira, SP e PR. Rev Bras Geocienc. 1998;28:269-84.
Miller M, Gosar M. Application of SEM/EDS to environmental geochemistry of heavy metals. Geologija. 2009;52:69-78. https://doi.org/10.5474/geologija.2009.008
Miler M, Gosar M. Characteristics and potential environmental influences of mine waste in the area of the closed Mežica Pb-Zn mine (Slovenia). J Geochem Explor. 2012;112:152-60. https://doi.org/10.1016/j.gexplo.2011.08.012
Prakongkep N, Suddhiprakarn A, Kheoruenromne I, Smirk M, Gilkes RJ. The geochemistry of Thai paddy soils. Geoderma. 2008;144:310-24. https://doi.org/10.1016/j.geoderma.2007.11.025 Ramos-Miras JJ, Díaz-Fernández P, SanJosé-Wery A, Rodríguez-Martín JA, Roca N, Bech J,
Roca-Perez L, Boluda R, Gil C. Influence of parent material and soil use on arsenic forms in soils: a case study in the Amblés Valley (Castilla-León, Spain). J Geochem Explor. 2014;147:260-7. https://doi.org/10.1016/j.gexplo.2014.09.003
Rivera MB, Fernández-Caliani JC, Giráldez MI. Geoavailability of lithogenic trace elements of environmental concern and supergene enrichment in soils of the Sierra de Aracena Natural Park (SW Spain). Geoderma. 2015;259-260:164-73. https://doi.org/10.1016/j.geoderma.2015.06.009 Roach N, Reddy KR, Al-Hamdan AZ. Particle morphology and mineral structure of heavy metal-contaminated kaolin soil before and after electrokinetic remediation. J Hazard Mater. 2009;165:548-57. https://doi.org/10.1016/j.jhazmat.2008.10.022
Ryan PC, Hillier S, Wall AJ. Stepwise effects of the BCR sequential chemical extraction procedure on dissolution and metal release from common ferromagnesian clay minerals: a combined solution chemistry and X-ray powder diffraction study. Sci Total Environ. 2008;407:603-14. https://doi.org/10.1016/j.scitotenv.2008.09.019
Santos HG, Jacomine PKT, Anjos LHC, Oliveira VA, Oliveira JB, Coelho MR, Lumbreras JF, Cunha TJF. Sistema brasileiro de classificação de solos. 3. ed. Rio de Janeiro: Embrapa Solos; 2013.
Schwertmann U, Fechter H. The influence of aluminium on iron oxides. XI. Aluminium substituted maghemite in soils and its formation. Soil Sci Soc Am J. 1984;48:1462-3. https://doi.org/10.2136/sssaj1984.03615995004800060054x
Simas FNB, Schaefer CEGR, Melo VF, Albuquerque-Filho MR, Michel RFM,
Pereira VV, Gomes MRM, Costa LM. Ornithogenic Cryosols from Maritime Antarctica: phosphatization as a soil forming process. Geoderma. 2007;138:191-203.
https://doi.org/10.1016/j.geoderma.2006.11.011
Soil Survey Staff. Soil taxonomy: a basic system of soil classification for making and interpreting soil surveys. 2nd ed. Washington, DC: United States Department of Agriculture, Natural
Resources Conservation Service; 1999. (Agricultural Handbook, 436).
Teršič T. SEM/EDS analysis of soil and roasting vessels fragments from ancient mercury ore roasting sites at Idrija area. Geologija. 2011;54:31-40. https://doi.org/10.5474/geologija.2011.002 Umar BA, Adamu H. Fractionation of Pb in soil of abandoned Pb mine by SEM-EDX and XRD. J Appl Sci Environ Manage. 2015;19:403-9. http://dx.doi.org/10.4314/jasem.v19i3.9
United States Environmental Protection Agency - Usepa. Method 3052: microwave assisted acid digestion of siliceous and organically based matrices. Washington, DC; 1997