Contents lists available atScienceDirect
Journal of Food Composition and Analysis
journal homepage:www.elsevier.com/locate/jfca
Comparative analysis of minor bioactive constituents (CoQ
10
, tocopherols
and phenolic compounds) in Arbequina extra virgin olive oils from Brazil
and Spain
Thays H. Borges
a,b, Luis Carlos López
c, José Alberto Pereira
d, Carmen Cabrera
–
Vique
b,
Isabel Seiquer
a,⁎aDepartamento de Fisiología y Bioquímica de la Nutrición Animal, Estación Experimental del Zaidín, Consejo Superior de Investigaciones Científicas (CSIC), Camino del
Jueves, 18100 Armilla, Granada, Spain
bDepartamento de Nutrición y Bromatología, Facultad de Farmacia, Universidad de Granada, Campus de Cartuja, 18012 Granada, Spain
cInstituto de Biotecnología y Departamento de Fisiología, Centro de Investigación Biomédica, Parque Tecnológico de Ciencias de la Salud, Universidad de Granada,
Granada, Spain
dREQUIMTE-LAQV, School of Agriculture, Polytechnic Institute of Bragança, Campus de Santa Apolónia, 5300-253 Bragança, Portugal
A R T I C L E I N F O
Keywords:
Food composition Food analysis Arbequina Virgin olive oil Coenzyme Q10 Tocopherols Polyphenols Chemometric analysis
A B S T R A C T
There is currently an emerging production of olive oil in Brazil but it is still poorly characterized. In this study, we performed a comparative analysis of minor bioactive constituents (CoQ10,tocopherols and phenolic
com-pounds) in extra virgin olive oil from different regions of Brazil and Spain, of Arbequina cultivar. Significant variations (P <0.05) in the concentration of the compounds analyzed were observed among oils from the different growing areas, not only between Spanish and Brazilian samples but also within zones of the same country. All the oils analyzed showed a high content of CoQ10, which ranged from 48 to 85 mg/L. Theα−
tocopherol was the major isomer quantified and three main groups of phenolic compounds were identified:
flavonoids (apigenin, luteolin), phenolic acids (naringenin, p-coumaric acid, vanillic acid) and phenolic alcohols (hydroxytyrosol). Climatic and geographic factors of the production zones greatly influenced the minor fraction composition; positive relationships between altitude and the level of CoQ10, tocopherols and phenolic
com-pounds of the oils were observed, whereas a negative correlation with rainfalls was found. Chemometric analyses demonstrated that oils were differentiated by the chemical composition and origin area and that polyphenols (particularly hydroxytyrosol) held the major weight in the oil classification.
1. Introduction
It is well known that chemical composition of olive oils consists of major (saponifiable fraction) and minor constituents (unsaponifiable fraction). The minor constituents, despite present in lower amounts (up to 2%), are a complex mixture of more than 230 compounds (Lopez et al., 2014; Servili et al., 2014). Among them, phenolic compounds and tocopherols are of great interest, mainly due to their nutritional value, antioxidant potential and health benefits.
The phenolic compounds are secondary plant metabolites that have one phenol ring (phenolic acids/phenolic alcohol) or several aromatic rings with one or more hydroxyl groups (polyphenols) (Ignat et al., 2011; Lopez et al., 2014). Over the last few decades, multiple biological properties, providing antioxidant, anti-inflammatory, chemopreventive
and anti-cancer benefits, as well as sensorial proprieties has been at-tributed to phenol compounds of olive oils (Servili et al., 2014). Re-cently, their protective effect over blood lipids from oxidative stress has been recognized by the European Food Safety Authority (EFSA, 2011), thus stimulating, even more, the interest for olive oil polyphenols and allowing the use of its health claims (Reboredo-Rodríguez et al., 2016; Martín-Peláez et al., 2013). Tocopherols are known as lipophilic phe-nols that include 8 occurring forms: 4tocopherols and 4 tocotriephe-nols (α, β,γandδ). In extra virgin olive oil (EVOO), the most predominant is theα-tocopherol (up to 90% of total), recognized as the most active form of vitamin E in mammals, although different factors such as cul-tivar and geographic location of the olive trees may influence its con-centration (Lopez et al., 2014; Kalogeropoulos and Tsimidou 2014). These natural antioxidants not only provide nutritional value to virgin
http://dx.doi.org/10.1016/j.jfca.2017.07.036
Received 9 February 2017; Received in revised form 21 July 2017; Accepted 22 July 2017
⁎Corresponding author at: Departamento de Fisiología y Bioquímica de la Nutrición Animal, Estación Experimental del Zaidín (CSIC), Camino del Jueves s/n, 18100 Armilla, Granada, Spain.
E-mail address:[email protected](I. Seiquer).
Abbreviations:CoQ10, coenzyme Q10; EVOO, extra virgin olive oil; EFSA, European Food Safety Authority; HCA, hierarchical cluster analysis
Available online 24 July 2017
0889-1575/ © 2017 Elsevier Inc. All rights reserved.
olive oils but also contribute to its stability, protecting from oxidation (Lopez et al., 2014; Kalogeropoulos and Tsimidou, 2014).
Another minor compound with great value is the coenzyme Q10 (CoQ10), an endogenous lipophilic compound that is involved in es-sential cell regulations and modulations, mainly in the mitochondrial respiratory chain (Jankowski et al., 2016; Thanatuksorn et al., 2009). In the body it exists in either oxidized (ubiquinone) or reduced form (ubiquinol); mainly in its reduced form it is recognized as an effective endogenous antioxidant, although an antioxidant role of the oxidized form cannot be discarded (Pravst et al., 2010; Jankowski et al., 2016). Additionally, it has the ability to recycle α-tocopherol by sparing or regeneration (Pyo, 2010). Due to redox reactions, continuous conver-sion between ubiquinone and ubiquinol takes placein vivoand, more-over, ubiquinone is also reduced during or following the intestinal absorption (Pravst et al., 2010). Therefore, the functions of CoQ10are not affected by the form in which it is consumed (Pravst et al., 2010). Most of the CoQ10in the human body is from endogenous synthesis, but levels decline progressively with increasing age and should be replaced daily by nourishment (Jankowski et al., 2016). In this sense, the EVOO consumption may be a dietary natural source for increasing intake of CoQ10 (Venegas et al., 2011; Žmitek et al., 2014). A wide range of possible benefits for human health has been reported for CoQ10(Pravst et al., 2010; Jankowski et al., 2016; Turunen et al., 2004). The levels of these minor bioactive constituents are variable in EVOO. These varia-tions have been attributed to different factors, including agronomic and technological practices, cultivar, ripening stage, climate conditions and geographic origin (Servili et al., 2009; Laincer et al., 2016). Never-theless, factors influencing the CoQ10content of olive oils have been scarcely investigated (Žmitek et al., 2014).
In recent years, the demand of olive oils is rising over the world, and emerging countries such as Brazil are beginning to produce it. Actually, the Arbequina cultivar is one of the most cultivated in Brazil, and data on physicochemical properties, oxidative stability and fatty acid profile of Arbequina Brazilian oils have been recently published by our re-search group (Borges et al., 2017). However, little is known about how geographic and climate conditions may affect the minor components of the olive oils in Brazil (Ballus et al., 2014, 2015). Also, there is a lack of information about the similarities and differences between the newly introduced and the autochthonous cultivars. Moreover, to our knowl-edge, nothing has been published about CoQ10levels of Brazilian olive oil and very little about specific varieties in Spain (Žmitek et al., 2014). Finally, there is also a lack of information of the relationship between CoQ10with other bioactive constituents such as phenolic compounds and tocopherols. With this background, the aims of this work were: i) to characterize the minor constituents CoQ10, tocopherols and individual phenolic compounds of monovarietal Arbequina olive oil produced in Brazil; (ii) to compare it with the olive oils from the same cultivar produced in different regions of Spain and (iii) to classify the oil
samples according to their geographic origin, on the basis of the ana-lyzed variables and by applying chemometric analysis.
2. Materials and methods
2.1. Chemicals
All chemical products, standards and solvents for the analysis per-formed were analytical reagent grade or higher purity (Sigma-Aldrich, St. Louis, MO, USA) and Milli Q water (Millipore, Bedford, MA) was used throughout the assays. CoQ10from Sigma-Aldrich (code: C9538) was used to prepare standard solutions of different concentrations.
2.2. Samples
EVOO from Arbequina cultivar was analyzed. Nine regions of olive oil production in Spain (Granada, Jaén, Málaga, Cádiz, Sevilla, Albacete, Toledo, Valladolid and Lérida, samples 1 to 9) and two re-gions in Brazil (Rio Grande do Sul and Minas Gerais, samples 10 and 11) were selected to obtain the EVOO samples. The olives were har-vested always at the early stage of harvest; the harvest date was: late October to mid-November of 2014 for Spanish samples and March to early April of 2015 for Brazilian samples. The oil was extracted within 24 h, under a two-phase extraction system. The oils (n = 3 from each producing region) were directly donated by the producers, adequately packaged for preserving from light and high temperatures and sent to CSIC laboratories (Granada, Spain) to perform the analysis. As was shown previously (Borges et al., 2017), samples meet quality standards established by European Union regulation n° 2568/91 for extra virgin olive oil. The geographic coordinates (latitude and longitude), altitude (m), annual mean temperatures (°C), annual rainfalls (mm) and minimum and maximum mean temperatures (°C) of the different pro-ducing areas of Arbequina virgin olive oils are depicted inTable 1.
2.3. Determination of CoQ10
The samples were analyzed according toVenegas et al. (2011). A quantity of 990μL of 1-propanol was mixed with 10μL of the oil, vortex and centrifuged at 11300gfor 5 min at room temperature. The sub-sequent supernatant was diluted 1/500 in 1-propanol prior to HPLC injection. CoQ10present in the oil extract were separated by reversed-phase high-performance liquid chromatography (HPLC, Gilson, WI) with a C18 symmetry column (3.5μm, 4.6 × 150 mm) (Waters Chro-matography, Barcelona, Spain) using a mobile phase consisting of me-thanol, eme-thanol, 2-propanol, acetic acid glacial (500:500:15:15), and 50 mM sodium acetate at a flow rate of 0.9 mL/min. The electro-chemical detector consisted of an ESA Coulochem III with the following setting: guard cell (upstream of the injector) at +900 mV and Table 1
Geographic coordinates (Latitude and Longitude), altitude (m), annual mean temperatures (°C), annual rainfalls (mm) and minimum and maximum mean temperatures (°C) of the different locations of Arbequina virgin olive oils from Spain (1–9) and Brazil (10, 11).
Oil Sample Location Latitude Longitude Altitude Mean Temperatures Rainfall Minimum Temperature Maximum Temperature
1 Granada 37° 03′N 3° 36′W 905 17 385 7 26
2 Jaén 38° 03′N 3° 29′W 580 17 422 9 26
3 Málaga 37° 06′N 4° 22′W 883 20 411 13 27
4 Cádiz 36° 43′N 6° 01′W 47 19 636 13 24
5 Sevilla 37° 17′N 4° 53′W 416 19 598 11 27
6 Albacete 39° 00′N 1° 54′W 677 13 293 6 25
7 Toledo 39° 53′N 4° 28′W 459 14 391 7 26
8 Valladolid 41° 53′N 5° 00′.W 845 13 394 −1 27
9 Lérida 41° 36′N 0° 35′W 168 14 677 6 21
10 Rio Grande do Sul 30° 00′S 52° 52′W 88 16 1691 3 22
11 Minas Gerais 22° 18′S 42° 22′W 1310 17 1330 14 21
conditioning cell at−600 mV (downstream of the column) followed by the analytical cell at +350 mV. While this method is able to detect CoQ10in its reduced (ubiquinol) and oxidized (ubquinone) form, ubi-quinol was not detected in our conditions of extraction and analysis. The CoQ10 concentrations of the oxidized form were estimated by comparison of the peak areas with those of standard solutions of known concentrations (0, 25, 100, 300, and 600 ng/mL). Values of calibration curve are reported in Supplementary Table S1 in the online version at DOI: http://dx.doi.org/10.1016/j.jfca.2017.07.036. The results were expressed in mg per L of sample.
2.4. Determination of tocopherols
The tocopherols isomers were determined as described by Rueda et al. (2016). Briefly, 1 g of oil was dissolved in 25 mL n-hexane. The samples were analyzed by an HPLC system (Water Alliance 2695 se-parations module, Milford, MA) equipped with a silica column (4 mm × 250 mm) and eluted with hexane: isopropanol (99.25:0.75 v/ v) at a flow rate of 1 mL/min during 25 min. The tocopherols were detected byfluorescence (Water 2475) with excitation wavelength at 290 nm and emission wavelength at 330 nm. A calibration curve using external standards (α-,β-,γ-, andδ-tocopherols) was used for quanti-fication. The results were expressed as mg per kg of sample.
2.5. Individual phenolic compounds
The individual phenolic fraction of samples was performed after an extraction with methanol/water (80:20) according to the International Olive Oil Council (IOOC, 2009). The extracts were analyzed by UPLC-TOF-MS following the method validated by Rivas et al. (2013). The UPLC system consisted of a AcQuity UPLC equipped with a binary pump system (Waters, Milford, MA, USA) using a AcQuity UPLC BEH C18 column (1.7 mm, 2.1 mm x 100 mm inner diameter). The column was kept at 40 °C and theflow rate was 0.4 mL/min. The mobile phase was composed by eluent A, MilliQ water with formic acid (0.1%) and eluent B, methanol with formic acid (0.1%). The elution started at 5% of eluent B for 1 min, then was linearly increased to 100% of eluent B in 11 min and kept isocratic for 5 min; then, it got back to initial condi-tions in 0.1 min; the equilibration time was 2.9 min. The injection vo-lume was 7μL, and all samples werefiltered through 0.22 mm before chromatography. The UPLC was coupled to a Micromass/Waters LC-TPremier XE benchtop orthogonal acceleration time-of-flight (oa-TOF) mass spectrometer equipped with an ESI interface. Parameters for analysis were set using negative ion mode with spectra acquired over a mass range fromm/z100 to 1000. The optimum values of the elec-trospray ionization MS parameters were as follows: capillary voltage 2.6 kv; drying gas temperature 200 °C, desolvation gasflow 800 L/h. For optimum detection resolution, a solution was prepared of 1 mg/L
leucine enkephalin in acetotrinile/H2O (1:1, v/v) containing 0.1% formic acid continuously infused at aflow rate of 0.05 mL/min by an external rotary pump. This solution was also used for continuous cali-bration of the equipment, as its perfusion is simultaneous to that of the sample and served as a reference. Mass calibration was performed using a solution of sodium formate (containing 0.05 of formic acid and 5 mM of sodium hydroxide in iso- propanol/H2O 9:1, v/v). Accurate mass data of molecular ions were processed with MassLynxs (Waters).
Analytical parameters of the methods used are shown as Supplementaryfile.
2.6. Statistical analysis
Results were analyzed by analysis of variance (one-way ANOVA), with the geographic origin of oils (regions 1–11) as the main factor. Tukey’s test was used to compare mean values between oils from the different regions, and differences were established atP < 0.05. The relationships of the different variables with the climate characteristics and the altitude of the producing regions were evaluated by Pearson’s coefficient. These statistical calculations were carried out using SPSS version 21.0 (IBM Corporation, New York, USA).
In addition, chemometric analysis was performed including all the minor bioactive compounds evaluated in the present study (CoQ10; tocopherols−α,β,γand phenolic compounds). In afirst explorative step a hierarchical clustering analysis (HCA) was carried out to identify eventual similarities between the olive oils samples of different geo-graphic origin, by calculating multidimensional squared Euclidean distances of scores applying the single linkage-clustering method. Posteriorly, to reduce the variables into a small number of factors and explore the contribution of variables to oil differentiation, a factorial analysis (FA) using a varimax rotation was applied. All the chemo-metric analysis were performed using Stat Graphics Centurion XV software (Stat Point Technologies, Inc., USA, 2006).
3. Results and discussion
3.1. CoQ10
CoQ10 content in monovarietal EVOO. A previous study comparing different cultivars from several countries (Žmitek et al., 2014) showed that CoQ10is greatly driven by genetic factors; the highest content was observed in the cultivar Hojiblanca (98 mg/L), followed by Picual (63 mg/L) and Arbequina (58 mg/L). Values of 77.5 mg/L of CoQ10 content have been found in Spanish EVOO of Picual cultivar (Venegas et al., 2011), similarto the highest levels detected among oils in the present assay (samples from Spanish locations 1, 2, 3 and 6). Higher values, above 90 mg/L, have been observed in commercial Italian EVOO (Cabrini et al., 2001).
These findings support that EVOOs are one of the best natural sources of dietary CoQ10(Žmitek et al., 2014). Since the current intake of CoQ10in developed countries is not sufficient to compensate the age-related decline (Žmitek et al., 2014), promoting the intake of EVOO may be a good alternative to supplementation.
In addition to genetic factors, the CoQ10content of oils may be af-fected by geographic and climate conditions, as was supported by the results of the present assay, in which significant differences were found between oils from the same cultivar. In this sense, statistical correla-tions (P <0.01) were found between CoQ10content and geo climate factors of production areas, positive with altitude (r = 0.461) and maximum temperature (r = 0.484) and negative with rainfalls (r =−0.494). Accordingly, the areas of low rainfall and high altitude (Table 1), such as Granada (region 1), produced the oil with the highest CoQ10 content. In the same line, high rainfall levels in Brazilian growing areas (regions 10 and 11) could have a negative effect on the CoQ10content of oils, although in the case of oil from region 11 this effect seems to be partly counteracted by the positive influence of the high altitude.
3.2. Tocopherols
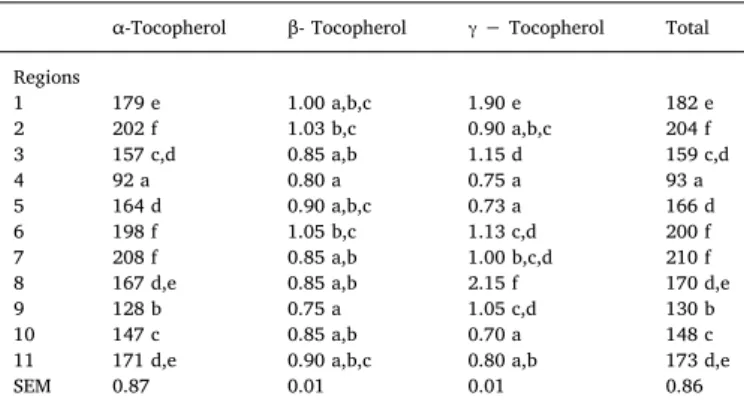
Table 2shows tocopherols content (α,β,γand total) for Arbequina EVOO from Spain (1–9) and Brazil (10–11). The major isomer quanti-fied wasα-tocopherol, representing more than 98% of the total, ranging from 92 to 208 mg/kg of oil, followed by lower amounts of β (0.8–1.9 mg/kg) andγ(0.7–2.15 mg/kg) fractions. No detectable va-lues ofδ- tocopherol were observed.
The content of the tocopherol fractions differed between EVOO samples from the different regions (P <0.05). Values of Brazilian oils were within the range found for Spanish samples, with the only ex-ception of theγ−isomer, which was lower among Brazilian oils. Thus, it was shown that the Arbequina oils newly introduced in Brazil have similar tocopherol content that the oils from the autochthonous Spanish cultivar.
In general,α-tocopherol concentration found in the present assay is similar to the values reported for Arbequina EVOO from Spain and the
introduced from Argentina, Tunisia and Turkey, which vary from 150 to 300 mg/kg (Beltrán et al., 2010;Dabbou et al., 2010;López-Cortés et al., 2013;Torres et al., 2009;Uluata et al., 2016;Yousfiet al., 2012). The lowest contents of α-tocopherol among samples of the present study were found in Spanish locations 4 (Cádiz) and 9 (Lérida). The low tocopherol level in oil of location 4 could be related tothe low oxidative stability (5.32 h, measured by the Rancimat method) previously de-scribed in oils from this region (Borges et al., 2017). Large variations in α-tocopherol content have been observed in Brazilian Arbequina EVOO from Minas Gerais depending on the harvest year (62 and 201 mg/kg for crop years 2010 and 2011, respectively) (Ballus et al., 2014). Thus, values of 147 and 171 mg/kg found in Brazilian samples in the present study (zones of Rio Grande do Sul and Minas Gerais, respectively) were within this wide range.
Some previous data show that tocopherol content of olive oils has a genetic component, i.e. it is highly depending on cultivar, but it may also be affected by climatic conditions, mainly temperature, rainfalls and altitude (Beltrán et al., 2010; Dabbou et al., 2009; Ilyasoglu et al., 2016). Therefore, the growing location area, with different conditions of rainfall and temperature, influence the tocopherol content and composition of the oils (Aguilera et al., 2005), in agreement with pre-sent results. In addition, significant correlations were verified relating geo climate conditions with tocopherol content of the samples (Table 4). In concordance with previous research reporting increased tocopherol levels in dry crop seasons (Beltrán et al., 2010; Ilyasoglu et al., 2016), ourfindings show a negative relationship between rain-falls andγ(P < 0.01) and total tocopherol content (P < 0.05). On the contrary, some authors do not observe a consistent influence of rainfalls on tocopherol levels in Tunisian oils (Dabbou et al., 2009), since the effects of climatic conditions on tocopherols seem to be cultivar-de-pendent (Beltrán et al., 2010).
Relationships between the temperature of the growing area and tocopherols have been scarcely studied. In the present study, conflictive correlations among temperature and tocopherols were found, since they were negative with the mean (forα-,γ- and total) and minimum tem-peratures (forγ-) and positive with maximum temperatures (forα- and total tocopherols) (Table 4). That means that annual mean temperature of the growing zone significantly affects the tocopherol content, but peaks of cold and heat also seem to disturb this variable. Regarding the altitude effects, some authors observe increased tocopherol content in olive oils with increasing the altitude (Dabbou et al., 2009) and, thus, altitude has been proposed as an important factor to be considered in tocopherol level of oils (Kalogeropoulos and Tsimidou, 2014). In this line, positive correlations of altitude with tocopherol concentration of the oils have been found in our study (Table 4). However, oils from areas with the highest altitude were not those with the highest toco-pherol content, which suggests that altitude has not a definitive infl u-ence and could be counteracted by effects of other geo climatic factors. As was reported before, the climate conditions have primarily an effect on biochemical reactions during growth and ripening, mainly in some enzymatic reactions that are essential for the tocopherol synthesis (Beltrán et al., 2010; Ilyasoglu et al., 2016). In this sense, increasing the tocopherol content could be an auto-protection mechanism of plants against some stress conditions, such as water stress (Beltrán et al., 2010). However, there is a maximum level depending on the fruit de-velopment (Georgiadou et al., 2015). In this line, our results show that climate factors are linked to tocopherols content and may impact them, but the influence of other factors providing synergic or antagonist ef-fects, as the maturation index, cannot be discarded.
3.3. Phenolic compounds
The concentration of phenolic compounds (apigenin, luteolin, nar-ingenin, p-coumaric acid, vanillic acid and hydroxytyrosol) of olive oil samples from different geographical areas of Spain and Brazil is shown in Table 3. Statistical differences between samples (P < 0.05) were Table 2
Tocopherols content (mg/kg) of Arbequina olive oils from Spain (1–9) and Brazil (10–11).
α-Tocopherol β- Tocopherol γ−Tocopherol Total
Regions
1 179 e 1.00 a,b,c 1.90 e 182 e
2 202 f 1.03 b,c 0.90 a,b,c 204 f
3 157 c,d 0.85 a,b 1.15 d 159 c,d
4 92 a 0.80 a 0.75 a 93 a
5 164 d 0.90 a,b,c 0.73 a 166 d
6 198 f 1.05 b,c 1.13 c,d 200 f
7 208 f 0.85 a,b 1.00 b,c,d 210 f
8 167 d,e 0.85 a,b 2.15 f 170 d,e
9 128 b 0.75 a 1.05 c,d 130 b
10 147 c 0.85 a,b 0.70 a 148 c
11 171 d,e 0.90 a,b,c 0.80 a,b 173 d,e
SEM 0.87 0.01 0.01 0.86
found in all individual compounds. Strong differences were observed between Brazilian oils, being the content of all phenolic compounds always higher in sample 10 than sample 11. Three main groups of phenolic compounds were identified: flavonoids (apigenin, luteolin), phenolic acids (naringenin, p-coumaric acid, vanillic acid) and phenolic alcohols (hydroxytyrosol). Flavonoids were the major group, ranging from 93 to 36% of the total quantified, followed by phenolic acids (10–30% of the total), with the exception of samples from location 3 (with 14% offlavonoids and only 2% of phenolic acids). The highest levels of hydroxytyrosol were found in oils from Spanish locations 3 (1500μg/kg, contributing 83% to the total phenols examined) and Brazilian region 10 (1050μg/kg, 31% of the total). The Brazilian sample 11 showed a different profile of phenolic compounds in com-parison with the other samples; with equilibrate quantities of the quantified phenolic groups.
Current data show a large variation of phenolic content for EVOO samples, ranging between 50 and 940 mg/kg (Servili et al., 2014). Nevertheless, available data in the literature are very difficult to com-pare, since different methods have been used to separate, identify and quantify the phenolic compounds in EVOO samples around the world (Ballus et al., 2015). Besides, commercial standards are not totally available and some of these compounds are identified and quantified on the basis of other ones with similar structures (Ballus et al., 2015; Bakhouche et al., 2013). In this sense, nowadays there is not an official method able to show a complete profile of phenolic compounds and satisfy the new health claims on olive oil phenols, although the scien-tific community has been working on developing it ( Reboredo-Rodríguez et al., 2016).
In accordance with data of the present study,flavonoids (apigenin,
luteolin) and phenolic acids (p-coumaric acid, vanillic acid) have been previously found in Arbequina cultivar (Bakhouche et al., 2013; Rivas et al., 2013; Yousfiet al., 2012). However, up to our knowledge, nar-ingenin was not reported yet in Arbequina oil, but was recently de-tected in oleaster, leaves, olive barks, wastewater and EVOO of Em-peltre and Arauco cultivars from Argentina (Bouarroudj et al., 2016;De Fernandez et al., 2014;Leouifoudi et al., 2014;Tóth et al., 2015). On the other hand, hydroxytyrosol is one of the most important phenolic compounds in olive oils (Bakhouche et al., 2013) and it has been widely associated with the high antioxidant capacity in EVOO (Servili et al., 2014). Accordingly, Arbequina oils from region 3 (Málaga, Spain) have a high resistance to oxidation (15.85 h of oxidative stability, by the Rancimat method) (Borges et al., 2017). The health beneficial proper-ties of hydroxytyrosol have been recognized by the EFSA (EFSA, 2011). Concerning geographical area and climate conditions, several authors have studied the relationship of phenolic compounds with them (Bakhouche et al., 2013; Dabbou et al., 2009; Ilyasoglu et al., 2016). In this line, positive correlations between altitude and some of the ana-lyzed phenolic compounds such as naringenin (r = 0.458), p-coumaric acid (r = 0.578) and hydroxytyrosol (r = 0.618) were found in our study (Table 4). In agreement,Dabbou et al. (2009)attribute variations of phenolic profile of Tunisian EVOO to the geographic area char-acteristics, particularly to altitude. Furthermore, scientific data have shown that water status also influence the phenolic profile of the olive oils, but the effect may differ depending on the compounds, since the enzymes involved in the biosynthetic pathway of phenolic compounds are affected by water stress conditions in a different way (Ilyasoglu et al., 2010; Stefanoudaki et al., 2009). Thus, correlations between climatic conditions and minor olive oil compounds may be explained Table 3
Phenolic content (μg/kg) of Arbequina olive oils from Spain (1–9) and Brazil (10–11).
Phenolic content
Flavonoids Phenolic acids Phenol alcohols
Apigenin Luteolin Naringenin p-Coumaric acid Vanillic acid Hydroxytyrosol
Regions
1 265 e,f 858 c,d 25.0 a,b 55.0 c 119 c 90.0 a,b
2 309 f,g 1054 d,e 51.5 c,d 59.0 c 59.5 b 287 d,e
3 26.0 a 241 a,b 30.0 b n.d n.d 1500 g
4 204 b,c 773 c 16.5 a 24.5 a,b 28.5 a 3.00 a
5 161 b 463 b 63.5 d 13.5 a n.d 379 e
6 326 g 1257 f,g 50.0 c 97.0 e 124 c 251 c,d,e
7 424 h 1148 e 56.0 c,d 94.0e 121 c 161 b,c,d
8 184 b,c 748 c 16.0 a 91.0 e n.d 204 b,c,d
9 236 d,e 1236 f,g 58.5 c,d 31.0 b 70.0 b 149 b,c
10 398 h 1482 g 133 e 228 f n.d 1050 f
11 15.0 a 92.0 a 21.0 a,b 74.0 d n.d 92.0 a,b
SEM 40.3 133 10.1 18.7 16.2 8.1
Means values in each column with different letters are significantly different between regions or countries (ANOVA and Tukey test,P< 0.05).
Table 4
Pearson’s correlation coefficient (r) between climate variables and altitude and analytical parameters (Coenzyme Q10,Tocopherols and Phenolic content).
Altitude Temperature Rainfalls Minimum temperature Maximum temperature
Coenzyme Q10 0.461** 0.060 −0.494** 0.073 0.484**
αTocopherol 0.543** −0.361* −0.316 −0.219 0.385*
βTocopherol 0.376* −0.074 −0.257 −0.020 0.307
γTocopherol 0.437** −0.396* −0.446** −0.588** 0.309
Total 0.547** −0.365* −0.321* −0.226 0.389*
Apigenin 0.314 −0.390* −0.249 0.097 −0.179
Luteolin 0.315 −0.456** −0.207 0.075 −0.374*
Naringenin 0.458** 0.000 0.286 0.439*
−0.440*
p-Coumaric acid 0.578**
−0.364* 0.417* −0.021 −0.534*
Vanillic acid −0.037 −0.470** −0.511** −0.191 0.066
Hydroxytyrosol 0.618** 0.466** 0.064 0.563** 0.066
mainly by the effects in enzymatic activity reactions during the growth and ripening of olive fruits (Ilyasoglu et al., 2016). Accordingly, re-lationships between climate variables of temperature and rainfalls and phenol composition of oils were found in the present assay (Table 4).
3.4. Chemometric analyses
A hierarchical cluster analysis (HCA) was applied as an initial ap-proach for grouping samples that share common characteristics ac-cording to the analyzed variables. HCA was obtained using the Euclidean distance of scores as a similarity criterion and the results are shown inFig. 2A. The dendogram plot definedfive distinctive clusters. Firstly, three separated cluster were observed for samples from Rio Grande do Sul (10), Valladolid (8) and Málaga (3).The fourth cluster was composed by the oils from Cádiz (4), Lérida (9), Sevilla (5) and Minas Gerais (11). The last one was represented by the samples from Granada (1), Jáen (2), Albacete (6) and Toledo (7). It was observed that
oil from Rio Grande do Sul showed the biggest Euclidean distance (high significance clustering), i.e the lowest similarities comparing with the other groups.
In the factorial analysis, three factors justifying 76% of total var-iance were obtained (F1 33%, F2 29%, F3 14%). F1 was explained mainly by phenolic compounds (apigenin 0.92; luteolin 0.92; nar-ingenin 0.81 and p-coumaric acid 0.77), F2 was composed by CoQ10 (0.84) and tocopherols (α0.83;β0.83 andγ0.36), while F3 was mainly characterized by hydroxytyrosol (−0.87) and vanillic acid (0.66). According to these factors, a spatial representation of the oils was ob-tained (Fig. 2B). A clear separation of sample 10 was observed mainly due to F1 and F3, and thus, related with the different content of poly-phenols in this oils compared with the other samples, particularly lu-teolin, p-coumaric acid and hydroxytyrosol. Also according to F1 and F3, samples from locations 1, 2, 6 and 7 showed evident proximity. The remainder oils were relatively grouped but, among them, samples from Málaga (3) were slightly away from the other locations, which may be Fig. 2. A-Dendrogram plot showing the conglomeration of olive oil samples from Spain (1–9) and Brazil (10–11) obtained by clustering of CoQ10; tocopherols−α,β,γand phenolic
compounds showing.B- PCA 3D plot obtained from CoQ10; tocopherols−α,β,γand phenolic compounds representing the distribution of olive oil samples from Spain (1–9) and Brazil
associated with its high level of hydroxytyrosol. This entirely means that F2 (governed by CoQ10and tocopherols) was not able to diff er-entiate EVOO samples clearly, according to the content of lipophilic compounds in the samples. However, F2 and particularly F3, with a strong impact of hydroxytyrosol, could classify the samples in three separated blocks, as commented. Thus, phenolic compounds were a useful tool to delimitate EVOO samples from different geographic areas. In general terms, HCA was confirmed by the factorial analysis, which in turn showed the weight of the variables in the classification of the oil samples.
4. Conclusions
Findings of the present study contribute to increasing the knowl-edge of the EVOO grown in Brazil, a country with an incipient pro-duction of olive oil but with great potential for its cultivation. In ad-dition, comparative information with the original cultivar produced in Spain is reported. Significant differences in the minor fraction compo-sition (CoQ10, tocopherols and phenolic compounds) were observed not only between Spanish and Brazilian Arbequina oils but also between oils from the different producing areas within each country. A high level of CoQ10content of olive oils was observed, especially among Spanish oils. Climatic and geographic factors of the production zones seem to greatly affect the content of the parameters analyzed; positive relationships of the altitude with the level of CoQ10, tocopherols and phenolics of the oils were observed, whereas negative correlation with rainfalls werealso shown. Chemometric analyses demonstrated that oils were differentiated according to chemical composition and origin area, and that polyphenols (particularly hydroxytyrosol) held the major weight in the oil classification.
The influence of other factors than those considered in the present study, such as the ripeness index of olives, cannot be discarded, and therefore, the lack of this information may be considered as a limitation of the study.
Conflicts of interest
The authors declare no competingfinancial interest.
Acknowledgements
We are grateful to the CAPES Foundation, (Ministry of Education) Brazil, for scholarship support provided to the first author. LCL is supported by the “Ramón y Cajal” National Programme (RYC-2011-07643) and the grants SAF2013-47761-R and SAF2015-65786-R, Ministerio de Economía y Competitividad, Spain, and the European Regional Development Fund (ERDF). This work is part of the doctoral thesis of Thays Helena Borges, Ph.D. student from the Official Doctoral Program“Nutrition and Food Sciences”of the Granada University. The authors also would like to thank Consejo Regulador de Denominación de Origen (DOP) Estepa and DOP Les Garrigues; Casas Hualdo, Castillo Canena, Cortijo de Jara, Quaryat Dilar and Olivas do Sul for the do-nation of samples. We would like to dedicate to the memory of Carmen Cabrera-Vique.
References
Aemet, 2015. Agencia Estadual de Metereologica. (2015) Climate monitoring Spain. Available from:http://www.aemet.es/es/serviciosclimaticos/vigilancia_clima/ resumenes. (Accessed November 2015).
Aguilera, M.P., Beltrán, G., Ortega, D., Fernández, A., Jiménez, A., Uceda, M., 2005. Characterisation of virgin olive oil of Italian olive cultivars:Frantoio'andLeccino', grown in Andalusia. Food Chem. 89 (3), 387–391.
Bakhouche, A., Lozano-Sánchez, J., Beltrán-Debón, R., Joven, J., Segura-Carretero, A., Fernández-Gutiérrez, A., 2013. Phenolic characterization and geographical classifi -cation of commercial Arbequina extra-virgin olive oils produced in southern Catalonia. Food Res. Int. 50 (1), 401–408.
Ballus, C.A., Meinhart, A.D., de Souza Campos, F.A., da Silva, L.F.D.O., de Oliveira, A.F.,
Godoy, H.T., 2014. A quantitative study on the phenolic compound: tocopherol and fatty acid contents of monovarietal virgin olive oils produced in the southeast region of Brazil. Food Res. Int. 62, 74–83.
Ballus, C.A., Quirantes-Piné, R., Bakhouche, A., da Silva, L.F.D.O., de Oliveira, A.F., Coutinho, E.F., Godoy, H.T., 2015. Profile of phenolic compounds of Brazilian virgin olive oils by rapid resolution liquid chromatography coupled to electrospray ioni-sation time-of-flight mass spectrometry (RRLC-ESI-TOF-MS). Food Chem. 170, 366–377.
Beltrán, G., Jiménez, A., del Rio, C., Sánchez, S., Martínez, L., Uceda, M., Aguilera, M.P., 2010. Variability of vitamin E in virgin olive oil by agronomical and genetic factors. J. Food Compos. Anal. 23 (6), 633–639.
Borges, T.H., Pereira, J.A., Cabrera-Vique, C., Lara, L., Oliveira, A.F., Seiquer, I., 2017. Characterization of Arbequina virgin olive oils produced in different regions of Brazil and Spain: physicochemical properties, oxidative stability and fatty acid profile. Food Chem. 215, 454–462.
Bouarroudj, K., Tamendjari, A., Larbat, R., 2016. Quality: composition and antioxidant activity of Algerian wild olive (Olea europaea L. subsp. Oleaster) oil. Ind. Crops Prod. 83, 484–491.
Cabrini, L., Barzanti, V., Cipollone, M., Fiorentini, D., Grossi, G., Tolomelli, B., Landi, L., 2001. Antioxidants and total peroxyl radical-trapping ability of olive and seed oils. J. Agric. Food Chem. 49 (12), 6026–6032.
Dabbou, S., Issaoui, M., Esposto, S., Sifi, S., Taticchi, A., Servili, M., Hammami, M., 2009. Cultivar and growing area effects on minor compounds of olive oil from auto-chthonous and European introduced cultivars in Tunisia. J. Sci. Food Agric. 89 (8), 1314–1325.
Dabbou, S., Brahmi, F., Taamali, A., Issaoui, M., Ouni, Y., Braham, M., et al., 2010. Extra virgin olive oil components and oxidative stability from olives grown in Tunisia. J. Am. Oil Chem. Soc. 87 (10), 1199–1209.
De Fernandez, M.D.L.A., SotoVargas, V.C., Silva, M.F., 2014. Phenolic compounds and antioxidant capacity of monovarietal olive oils produced in argentina. J. Am. Oil Chem. Soc. 91 (12), 2021–2033.
EFSA Panel on Dietetic Products Nutrition and Allergens, Scientific opinion on the sub-stantiation of health claims related to polyphenols in olive and protection of LDL particles from oxidative damage (ID 1333, 1638, 1639, 1696, 2865), maintenance of normal blood HDL cholesterol concentrations (ID 1639), maintenance of normal blood pressure (ID 3781), anti-inflammatory properties (ID 1882), contributes to the upper respiratory tract health (ID 3468), can help to maintain a normal function of gastrointestinal tract(3779), and contributes to body defences against external agents (ID 3467) pursuant to Article 13(1) of Regulation (EC) no. 1924/2006. EFSA J. 2011, 9, 2033–2058.
Georgiadou, E.C., Goulas, V., Manganaris, G.A., Kalaitzis, P., Fotopoulos, V., 2015. Temporal analysis reveals a key role for VTE5 in vitamin E biosynthesis in olive fruit during on-tree development. Front. Plant Sci. 6.
INMET, 2015. Instituto Nacional De Meteorología. Available from:www.inmet.gov.br/ portal/. (Accessed November 2015).
International Olive Oil Council (IOOC), 2009. Document COI/T.20/DOC. 29. International Olive Oil Council, Madrid.
Ignat, I., Volf, I., Popa, V.I., 2011. A critical review of methods for characterisation of polyphenolic compounds in fruits and vegetables. Food Chem. 126 (4), 1821–1835. Ilyasoglu, H., Ozcelik, B., Van Hoed, V., Verhe, R., 2010. Characterization of Aegean olive
oils by their minor compounds. J. Am. Oil Chem. Soc. 87 (6), 627–636. Jankowski, J., Korzeniowska, K., Cieślewicz, A., Jabłecka, A., 2016. Coenzyme Q10–A
new player in the treatment of heart failure? Pharmacol. Rep. 68 (5), 1015–1019. Kalogeropoulos, N., Tsimidou, M.Z., 2014. Antioxidants in Greek virgin olive oils.
Antioxidants 3 (2), 387–413.
López-Cortés, I., Salazar-García, D.C., Velázquez-Martí, B., Salazar, D.M., 2013. Chemical characterization of traditional varietal olive oils in East of Spain. Food Res. Int. 54 (2), 1934–1940.
Laincer, F., Iaccarino, N., Amato, J., Pagano, B., Pagano, A., Tenore, G., Ritieni, A., 2016. Characterization of monovarietal extra virgin olive oils from the province of Béjaïa (Algeria). Food Res. Int. 89, 1123–1133.
Leouifoudi, I., Zyad, A., Amechrouq, A., Oukerrou, M.A., Mouse, H.A., Mbarki, M., 2014. Identification and characterisation of phenolic compounds extracted from Moroccan olive mill wastewater. Food Sci. Technol. (Campinas) 34 (2), 249–257.
Lopez, S., Bermudez, B., Montserrat-de la Paz, S., Jaramillo, S., Varela, L.M., Ortega-Gomez, A., Muriana, F.J., 2014. Membrane composition and dynamics: a target of bioactive virgin olive oil constituents. Biochimica et Biophysica Acta (BBA)-Biomembranes 1838 (6), 1638–1656.
Martín-Peláez, S., Covas, M.I., Fitó, M., Kušar, A., Pravst, I., 2013. Health effects of olive oil polyphenols: recent advances and possibilities for the use of health claims. Mol. Nutr. Food Res. 57 (5), 760–771.
Pravst, I.,Žmitek, K.,Žmitek, J., 2010. Coenzyme Q10 contents in foods and fortification strategies. Crit. Rev. Food Sci. Nutr. 50 (4), 269–280.
Pyo, Y.H., 2010. Coenzyme Q10 and Q9 contents in 6 commercial vegetable oils and their average daily intakes in Korea. Food Sci. Biotechnol. 19 (3), 837–841.
Reboredo-Rodríguez, P., Valli, E., Bendini, A., Di Lecce, G., Simal-Gándara, J., Gallina Toschi, T., 2016. A widely used spectrophotometric assay to quantify olive oil bio-phenols according to the health claim (EU Reg. 432/2012). Eur. J. Lipid Sci. Technol. 118, 1593–1599.http://dx.doi.org/10.1002/ejlt.201500313.
Rivas, A., Sanchez-Ortiz, A., Jimenez, B., García-Moyano, J., Lorenzo, M.L., 2013. Phenolic acid content and sensory properties of two Spanish monovarietal virgin olive oils. Eur. J. Lipid Sci. Technol. 115 (6), 621–630.
Servili, M., Sordini, B., Esposto, S., Urbani, S., Veneziani, G., Di Maio, I., Taticchi, A., 2014. Biological activities of phenolic compounds of extra virgin olive oil. Antioxidants 3 (1), 1–23.
Stefanoudaki, E., Williams, M., Chartzoulakis, K., Harwood, J., 2009. Effect of irrigation on quality attributes of olive oil. J. Agric. Food Chem. 57 (15), 7048–7055. Tóth, G., Alberti, Á., Sólyomváry, A., Barabás, C., Boldizsár, I., Noszál, B., 2015. Phenolic
profiling of various olive bark-types and leaves: HPLC?ESI/MS study. Ind. Crops Prod. 67, 432–438.
Thanatuksorn, P., Kawai, K., Hayakawa, M., Hayashi, M., Kajiwara, K., 2009. Improvement of the oral bioavailability of coenzyme Q 10 by emulsification with fats and emulsifiers used in the food industry. LWT Food Sci. Technol. 42 (1), 385–390. Torres, M.M., Pierantozzi, P., Cáceres, M.E., Labombarda, P., Fontanazza, G., Maestri,
D.M., 2009. Genetic and chemical assessment of Arbequina olive cultivar grown in Córdoba province, Argentina. J. Sci. Food Agric. 89 (3), 523–530.
Turunen, M., Olsson, J., Dallner, G., 2004. Metabolism and function of coenzyme Q. Biochimica et Biophysica Acta (BBA)-Biomembranes 1660 (1), 171–199. Uluata, S., Altuntaş, Ü., Özçelik, B., 2016. Biochemical characterization of Arbequina
extra virgin olive oil produced in Turkey. J. Am. Oil Chem. Soc. 93 (5), 617–626. Venegas, C., Cabrera-Vique, C., García-Corzo, L., Escames, G., Acuña-Castroviejo, D.,
López, L.C., 2011. Determination of coenzyme Q10, coenzyme Q9, and melatonin contents in virgin argan oils: comparison with other edible vegetable oils. J. Agric. Food Chem. 59 (22), 12102–12108.
Yousfi, K., Weiland, C.M., Garcı́a, J.M., 2012. Effect of harvesting system and fruit cold storage on virgin olive oil chemical composition and quality of superintensive cul-tivated 'Arbequina' olives. J. Agric. Food Chem. 60 (18), 4743–4750.