Mercury toxicity in the Amazon: contrast
sensitivity and color discrimination of
subjects exposed to mercury
1Departamento de Fisiologia, 2Serviço de Computação, 3Núcleo de Medicina Tropical, Universidade Federal do Pará,
Belém, PA, Brasil
4Instituto de Psicologia, 5Núcleo de Neurociências e Comportamento,
Universidade de São Paulo, São Paulo, SP, Brasil A.R. Rodrigues1, C.R.B. Souza1,
A.M. Braga1, P.S.S. Rodrigues1,
A.T. Silveira2, E.T.B. Damin1,
M.I.T. Côrtes1, A.J.O. Castro1,
G.A. Mello1, J.L.F. Vieira3,
M.C.N. Pinheiro3, D.F. Ventura4,5
and L.C.L. Silveira1,3
Abstract
We measured visual performance in achromatic and chromatic spatial tasks of mercury-exposed subjects and compared the results with norms obtained from healthy individuals of similar age. Data were obtained for a group of 28 mercury-exposed subjects, comprising 20 Amazonian gold miners, 2 inhabitants of Amazonian riverside com-munities, and 6 laboratory technicians, who asked for medical care. Statistical norms were generated by testing healthy control subjects divided into three age groups. The performance of a substantial proportion of the mercury-exposed subjects was below the norms in all of these tasks. Eleven of 20 subjects (55%) performed below the norms in the achromatic contrast sensitivity task. The mercury-ex-posed subjects also had lower red-green contrast sensitivity deficits at all tested spatial frequencies (9/11 subjects; 81%). Three gold miners and 1 riverine (4/19 subjects, 21%) performed worse than normal subjects making more mistakes in the color arrangement test. Five of 10 subjects tested (50%), comprising 2 gold miners, 2 technicians, and 1 riverine, performed worse than normal in the color discrimination test, having areas of one or more MacAdam ellipse larger than normal subjects and high color discrimination thresholds at least in one color locus. These data indicate that psychophysical assessment can be used to quantify the degree of visual impairment of mercury-exposed subjects. They also suggest that some spatial tests such as the measure-ment of red-green chromatic contrast are sufficiently sensitive to detect visual dysfunction caused by mercury toxicity.
Correspondence L.C.L. Silveira
Universidade Federal do Pará Núcleo de Medicina Tropical Av. Generalíssimo Deodoro 92 66055-240 Belém, PA Brasil
E-mail: [email protected]
Presented at the Symposium on Sensory and Neuropsychological Losses Due to Mercury Intoxication and to Other Neurodegenerative Processes. Studies in Humans and in Animal Models. Águas de Lindóia, SP, Brazil, August 25-29, 2004.
Received October 27, 2005 Accepted November 6, 2006
Key words
•Mercury exposure •Mercury toxicity •Contrast sensitivity •Color vision •Visual dysfunction •Amazon riverside
communities
Research supported by JICA, CNPq-PNOPG (No. 550663/2001-0), CNPq-PRONEX/SECTAM-FUNTEC (No. 1079), CNPq (No. 471815/ 2004-7), CAPES-RENOR (No. 07), and CAPES-PROCAD (No. 0019/01-1).
Introduction
The gold mining activity in the Amazon Region has caused damage to the environment and has exposed the local people to two forms of mercury contamination (1-6). The gold min-ers themselves can be affected directly as a result of exposure to vapors given off during the burning of mercury amalgam. In addition, the elemental mercury released by the burning of amalgam is converted into organic mercury compounds and transferred to the food chain, as indicated by the presence of relatively high concentrations of mercury in fish from regions under the influence of gold mining activity (2, 3,7-9). The analysis of mercury content in hair samples of inhabitants of riverside communi-ties living in regions under the influence of gold mining activity reveals Hg concentra-tions higher than WHO (10,11) tolerance lim-its (2,3,12-16).
Organic mercury compounds are extremely toxic for the nervous system (10,11,17,18) and have caused several environmental catas-trophes in different countries with serious con-sequences for human health (19-22). Several studies have been performed to monitor the health conditions of Amazon inhabitants liv-ing in areas exposed to mercury, includliv-ing the performance of the visual system (23-25). The present study represents the first step in devel-oping norms for different visual tasks, which can be used to assess the visual performance of Amazonian riverines and gold miners. We tested here the visual performance of mer-cury-exposed subjects in chromatic and ach-romatic spatial tasks and compared the results with norms obtained from a number of indi-viduals of similar age without previous mer-cury exposure or any other visual dysfunction.
Material and Methods
Subjects
We evaluated the visual performance of 28 subjects exposed to hazardous mercury
levels. The subjects were recruited when they looked for medical assistance in the Laboratory of Environmental and Human Toxicology (Núcleo de Medicina Tropical, Universidade Federal do Pará), which in-cludes a specialized service for mercury tox-icity. Twenty-seven subjects ranged in age from 18 to 60 years, while the remaining subject was 74 years. Twenty of them were gold miners and 6 were laboratory techni-cians suffering from metallic mercury expo-sure for more than 3 years in their work environment. The remaining 2 subjects were inhabitants of a small village located in the Tapajós River basin, who had high mercury levels in hair samples and who were sus-pected of suffering from methyl mercury intoxication. Differently from the other sub-jects, who were exposed to elemental mer-cury vapor, the riverside inhabitants were suspected of having been exposed to methyl mercury by eating contaminated fish. Since the subjects traveled long distances to per-form the tests, it was not possible to perper-form all tests in all subjects. Only 20 subjects were tested for spatial achromatic contrast sensitivity, 11 were tested for spatial chro-matic contrast sensitivity, 19 performed the Farnsworth-Munsell color arrangement test, and 10 performed the Mollon-Reffin color discrimination test.
con-trast sensitivity; 17-82 for the Farnsworth-Munsell test, and 10-50 for the Mollon-Reffin test. The results obtained with control subjects were used to estimate confidence intervals and upper and lower tolerance lim-its (26,27). Two-tailed tolerance intervals were estimated, encompassing 90% of the population with 95% of certainty.
The study was performed according to the Ethical Norms for Research with Humans, Resolution 164/96 of the Health National Coun-cil, Brazilian Ministry of Health, and was approved by the Research Ethics Committee, Núcleo de Medicina Tropical, Universidade Federal do Pará. The subjects gave written informed consent to participate in the study.
Clinical evaluation
At the time they were tested psycho-physically all subjects had already been re-moved from mercury exposure for a variable amount of time, two of them for more than 6 months. Routine clinical, neurological, and ophthalmologic examination of all subjects was performed prior to psychophysical as-sessment. The ophthalmologic examination comprised ocular refractometry, fundoscopy, Goldmann perimetry, Humphrey automatic campimetry, Snellen visual acuity, and Ishi-hara pseudoisochromatic plate test.
Mercury analysis
Hair and urine samples were analyzed in the Laboratory of Environmental and Human Toxicology (Núcleo de Medicina Tropical, Universidade Federal do Pará) for total Hg by atomic absorption spectrometry with an SP 3-D mercury analyzer (Nippon Corporation, Tokyo, Japan). The precision and accuracy of these measurements were verified in relation to the IAEA 085 International Reference Stand-ard for hair samples, and StandStand-ard Reference Material 2672a of the US Department of Com-merce, National Institute of Standards and Technology (NIST).
Visual tests
The software for the psychophysical tests was written using C++ programming lan-guage, OFS/Motif 1.1, AIX-Windows R4, and IBM-GL graphic library, all for the AIX 3.2.x environment. The software was devel-oped for an IBM POWERStation RISC 6000 (IBM Corporation, New York, NY, USA). The stimuli were displayed on IBM 6091 19i color monitors, 1280 x 1024 pixels, 81.32-kHz horizontal refresh rate, 77-Hz vertical frame rate. They were generated using IBM GT4-3D graphic adapters, 24 bits/8 bits per gun. A dithering routine was used to obtain 10-bits gray level resolution. Luminance and chromaticity coordinates were measured with a CS-100A chroma meter (Konica Minolta, Mahwah, NJ, USA).
The tests consisted of several spatial vision measurements, encompassing contrast sensi-tivity and color discrimination. All measure-ments were performed monocularly, both eyes being alternately tested. The achromatic or chromatic contrast sensitivity was measured at eleven spatial frequencies ranging from 0.2 to 30 cycles/degree. The stimuli consisted of stationary, black-and-white (Commission Internationale de L’Éclerage - CIE 1976 white coordinates: u’ = 0.182, v’ = 0.474), vertical
sine-wave gratings, with a mean luminance of 43.5 cd/m2. The stimuli were placed at 3 m,
measuring 6.5ºx 5º in the visual field. Each threshold estimation was repeated six times and the mean value was taken as representa-tive of the subject’s threshold. The psycho-physical procedure used for the threshold de-terminations was the method of adjustments, in which the contrast value of the grating was continuously changed by the subject until the grating was no longer visible.
were: red, u’ = 0.426, v’ = 0.524; green, u’ =
0.114, v’ = 0.558. The stimuli, measuring 13 x
10 degrees in the visual field, were viewed from a distance of 1.5 m. Chromatic contrast sensitivity was measured at four different spa-tial frequencies, 0.1, 0.2, 0.5, and 1 cycle/ degree. Each measurement was repeated four times and the mean value was taken as repre-sentative of sensitivity. The method of adjust-ments described above was used for threshold determination.
Color discrimination was tested in two different ways. One test was a computer ver-sion of the Farnsworth-Munsell test, in which samples are arranged in a progressive hue order. This test measures the subject’s ability to order colored samples with the same lumi-nance and saturation, but variable hue. The performance in this test is evaluated both by a score based on the number of errors made by the subject in the ordering task and by the type of errors that were made. Errors may concen-trate in one or more of the color confusion axes (protan, deutan and tritan) or they may be diffuse. The stimuli consisted of 85 different hues, all with the same mean purity (30%) and luminance (42 cd/m2), equally spaced on the
CIE 1976 chromaticity diagram. The CIE 1976 coordinates of monitor guns are: red, u’ = 0.427, v’ = 0.523; green, u’ = 0.115, v’ =
0.559; blue, u’ = 0.165, v’ = 0.163. They were presented at 1 m and comprised four sets of 21 colors, 1 deg2 patches. Each measurement was
repeated four times and the mean value was considered to be representative of the score for the subject.
The other test was a self-built version of the Mollon-Reffin test (29,30) used to meas-ure MacAdam color discrimination ellipses centered on five locations of the CIE 1976 chromaticity diagram: Ellipse 1 = (0.215, 0.531); Ellipse 2 = (0.219, 0.481); Ellipse 3 = (0.225, 0.415); Ellipse 4 = (0.175, 0.485); Ellipse 5 = (0.278, 0.472). Stimuli consisted of 20 randomly displayed circular patches with a diameter of 0.2-0.6 degrees and random lumi-nance between 12 and 20 cd/m2. The CIE
1976 coordinates of the monitor guns were: red, u’ = 0.427, v’ = 0.523; green, u’ = 0.115, v’ = 0.559; blue, u’ = 0.165, v’ = 0.163. A subset of the patches forming a Landolt C was displayed in a chromaticity that differed from the remaining patches, which constituted the background. The Landolt C appeared for 1.5 s with its gap in one of four positions: right, left, up and down. The subject’s task was to indi-cate the position of the Landolt C opening during the time that the stimulus remained on the screen plus an additional 3 s after it was switched off. After this, a new trial started. The background chromaticity was kept constant throughout the experiments. The Landolt C chromaticity was varied along a vector con-necting it with the background chromaticity in the CIE color space every time the subject emitted a response. Correct responses de-creased the distance between target and back-ground while wrong responses increased it, following a staircase psychophysical method, until staircase direction reversals oc-curred. The threshold estimation was based on the average of the chromaticities correspond-ing to the peaks and valleys of these staircase reversals. During testing the program ran-domly interspersed catch trials in which the target was presented at maximum distance from the background. These catch trials had the objective of estimating the subject’s re-sponse reliability. For the determination of a color discrimination ellipse the same proce-dure was repeated for 20 vectors around a background chromaticity. Five such ellipses were determined for each eye of each subject. In addition, thresholds along the protan, deutan and tritan cone isolation lines in the CIE color space were determined.
Results
Mercury levels
exposure to mercury vapor, total urine Hg levels were high, reaching 400 µg/L. The levels dropped steadily in the following months, reaching values below 50 µg/L. To-tal Hg levels in hair samples were 14-47 µg/ g by the time of visual evaluation.
Clinical evaluation
Routine clinical and laboratory examina-tion of all subjects included in this study was negative for ophthalmologic or neurological symptoms not related to mercury toxicity. In particular, the results obtained with fundos-copy and Humphrey automatic campimetry showed no alterations in the central retinal
region or central visual field, corresponding to the region subsequently assessed with the psychophysics tests.
Achromatic contrast sensitivity
We evaluated the achromatic contrast sensitivity of 20 mercury-exposed subjects. The results obtained for the exposed subjects were divided into two groups representing their performance with the better or worse eye, respectively. These results can be com-pared with the norms presented in terms of tolerance limits for 90% of the population with 95% probability (Tables 1 and 2). The norms were based on data for non-exposed
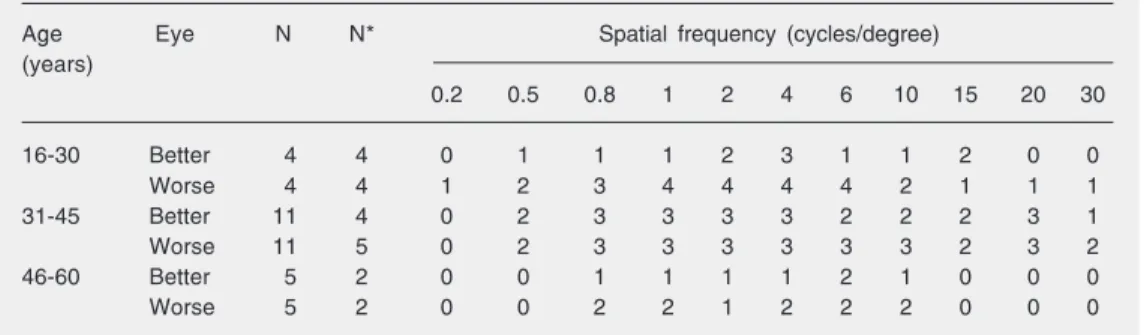
Table 2. Achromatic spatial contrast sensitivity. Hg-exposed subjects.
Age Eye N N* Spatial frequency (cycles/degree)
(years)
0.2 0.5 0.8 1 2 4 6 10 15 20 30
16-30 Better 4 4 0 1 1 1 2 3 1 1 2 0 0
Worse 4 4 1 2 3 4 4 4 4 2 1 1 1
31-45 Better 11 4 0 2 3 3 3 3 2 2 2 3 1
Worse 11 5 0 2 3 3 3 3 3 3 2 3 2
46-60 Better 5 2 0 0 1 1 1 1 2 1 0 0 0
Worse 5 2 0 0 2 2 1 2 2 2 0 0 0
N = number of subjects. N* = number of subjects out of control norms. Table 1. Achromatic spatial contrast sensitivity. Norms for each age group.
Age N Limits Spatial frequency (cycles/degree)
(years)
0.2 0.5 0.8 1 2 4 6 10 15 20 30
16-30 55 Mean 0.89 1.89 2.14 2.25 2.42 2.42 2.34 2.06 1.75 1.26 0.72
SD 0.18 0.27 0.21 0.25 0.21 0.22 0.26 0.30 0.40 0.35 0.30
UTL 1.25 2.42 2.56 2.75 2.85 2.84 2.84 2.65 2.53 1.95 1.31
LTL 0.53 1.35 1.72 1.75 2.00 1.99 1.83 1.48 0.96 0.57 0.12
31-45 20 Mean 0.90 1.84 2.10 2.23 2.43 2.44 2.33 2.02 1.76 1.33 0.81
SD 0.22 0.28 0.27 0.27 0.20 0.23 0.22 0.26 0.36 0.40 0.30
UTL 1.41 2.48 2.72 2.84 2.89 2.98 2.84 2.63 2.59 2.25 1.50
LTL 0.38 1.21 1.47 1.61 1.96 1.90 1.83 1.42 0.94 0.41 0.12
46-60 19 Mean 0.88 1.88 2.12 2.19 2.35 2.35 2.28 2.01 1.68 1.30 0.78
SD 0.15 0.26 0.20 0.18 0.16 0.16 0.17 0.24 0.34 0.32 0.29
UTL 1.22 2.48 2.59 2.60 2.72 2.71 2.68 2.57 2.47 2.05 1.46
LTL 0.53 1.28 1.65 1.77 1.98 1.98 1.88 1.44 0.88 0.55 0.11
Chromatic contrast sensitivity
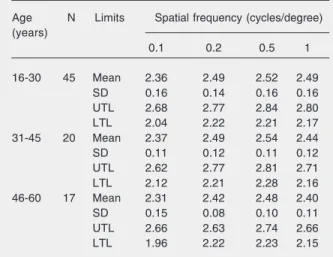
We evaluated the red-green contrast sen-sitivity of 11 mercury-exposed subjects. The results obtained for the exposed subjects were divided into two groups representing their performance with the better or worse eye, respectively, and then compared with the norms presented in terms of tolerance limits for 90% of the population with 95% probability (Tables 3 and 4). Two subjects were tested only with the dominant eye and the results were grouped with the better eye performance of the other nine subjects. The norms were based on data from non-exposed subjects stratified into age groups: 45 aged 16 to 30 years (mean = 21.4 ± 2.6), 20 aged 31 to 45 years (mean = 35.7 ± 4.8), and 17 aged 46 to 60 years (mean = 50.5 ± 3.9). Nine of the 11 (82%) mercury-exposed sub-jects tested (6 gold miners, 2 technicians, and 1 riverine) had lower red-green contrast sensitivity than normal subjects, 5 of them in both eyes. Only the low spatial frequency range was tested. This is the region in which chromatic contrast sensitivity is higher than achromatic contrast sensitivity in human vi-sion (28). The affected subjects had deficits at all tested spatial frequencies, from 0.1 to 1 cycle/degree.
Color arrangement test
We evaluated the ability of 19 mercury-exposed subjects in the Farnsworth-Munsell color arrangement test. The results obtained for the exposed subjects were divided into two groups, representing their performance with the better and worse eye, respectively, and then compared with the norms presented in terms of tolerance limits for 90% of the population with 95% probability (Tables 5 and 6). One subject was tested only with the dominant eye and the results were grouped with the better eye performance of the other ten subjects. The norms were based on data from non-exposed individuals divided into subjects grouped according to age: 55 aged
16 to 30 years (mean = 21.3 ± 3.1), 20 aged 31 to 45 years (mean = 35.7 ± 3.5), and 19 aged 46 to 60 years (mean = 53.9 ± 4.4). Nine mercury-exposed subjects (6 gold min-ers, 1 technician, and 2 riverines) had lower than normal contrast sensitivity in both eyes. An additional technician had lower contrast sensitivity in only one eye. The losses varied among subjects and occurred in spatial fre-quencies extending from 0.5 to 30 cycles/ degree, but very often they were restricted to the intermediate frequencies, between 0.8 and 10 cycles/degree.
Table 4. Red-green spatial contrast sensitivity. Hg-exposed subjects.
Age Eye N N* Spatial frequency (cycles/degree)
(years)
0.1 0.2 0.5 1
16-30 Better 2 1 1 1 1 1
Worse 2 2 2 2 2 2
31-45 Better 5 3 3 3 3 3
Worse 5 4 4 3 3 3
46-60 Better 2 1 1 1 1 1
Worse 4 3 3 3 3 3
N = number of subjects. N* = number of subjects out of control norms.
Table 3. Red-green spatial contrast sensitivity. Norms for each age group.
Age N Limits Spatial frequency (cycles/degree)
(years)
0.1 0.2 0.5 1
16-30 45 Mean 2.36 2.49 2.52 2.49
SD 0.16 0.14 0.16 0.16
UTL 2.68 2.77 2.84 2.80
LTL 2.04 2.22 2.21 2.17
31-45 20 Mean 2.37 2.49 2.54 2.44
SD 0.11 0.12 0.11 0.12
UTL 2.62 2.77 2.81 2.71
LTL 2.12 2.21 2.28 2.16
46-60 17 Mean 2.31 2.42 2.48 2.40
SD 0.15 0.08 0.10 0.11
UTL 2.66 2.63 2.74 2.66
LTL 1.96 2.22 2.23 2.15
age groups: 82 individuals aged 16 to 30 years (20.7 ± 2.7), 33 individuals aged 31 to 45 years (35.5 ± 4.2), and 17 individuals aged 46 to 60 years (49.9 ± 3.9). Only 4 of the 19 subjects (21%; 3 gold miners and 1 riverine) performed worse than normal sub-jects in this test, 3 of them (2 gold miners and 1 riverine) with both eyes.
Color discrimination test
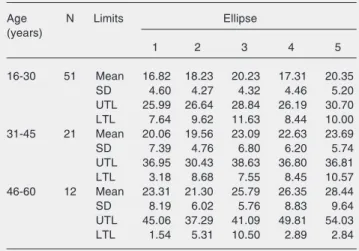
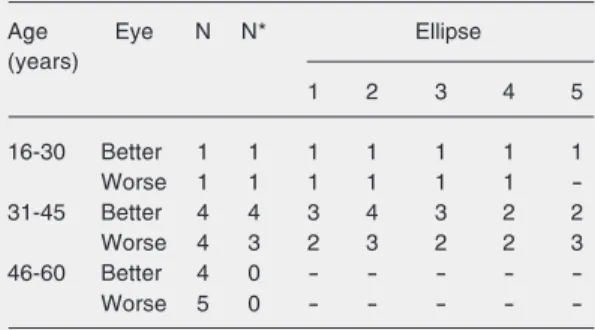
Using the Mollon-Reffin test, we esti-mated the color discrimination thresholds of 9 mercury-exposed subjects. The results ob-tained for the exposed subjects were divided into two groups representing their perfor-mance with the better and worse eye, respec-tively, and then compared with the norms presented in terms of tolerance limits for 90% of the population with 95% probability (Tables 7 and 8). To discriminate between better and worse eyes we used the MacAdam ellipse area of the field located in the center of the CIE 1976 chromaticity diagram (El-lipse 2). One subject was tested only with the dominant eye and the results were grouped with the better eye performance of the other eight subjects. The norms were based on data for non-exposed individuals divided into age groups: 50 individuals aged 16 to 30 years (20.8 ± 3.0), 19 individuals aged 31 to 45 years (37.1 ± 4.5), and 10 individuals aged 46 to 60 years (51.7 ± 3.6). Five sub-jects among the 10 tested (50%; 2 gold min-ers, 2 technicians, and 1 riverine) performed worse than normal subjects in this test, hav-ing areas of one or more MacAdam ellipses larger than normal subjects.
Discussion
The present results showed impairment in chromatic and achromatic contrast sensi-tivity and in color discrimination in subjects exposed to mercury vapor or to methyl mer-cury. All patients studied had initial mercury levels above the current biological threshold
Table 6. Farnsworth-Munsell 100 color arrange-ment test. Hg-exposed subjects.
Age (years) Eye N N*
16-30 Better 4 1
Worse 4 1
31-44 Better 9 2
Worse 10 3
46-60 Better 5 0
Worse 5 0
N = number of subjects. N* = number of subjects out of control norms.
Table 5. Farnsworth-Munsell 100 color arrange-ment test. Norms for each age group.
Age (years) N Limits Log error score
16-30 82 Mean 1.60
SD 0.32
UTL 2.20
LTL 1.00
31-44 33 Mean 1.79
SD 0.20
UTL 2.22
LTL 1.36
46-60 17 Mean 1.86
SD 0.24
UTL 2.44
LTL 1.29
Data are reported as mean, standard deviation (SD), upper tolerance limit (UTL), and lower toler-ance limit (LTL).
Table 7. Mollon-Reffin color discrimination test. Norms for each age group.
Age N Limits Ellipse
(years)
1 2 3 4 5
16-30 51 Mean 16.82 18.23 20.23 17.31 20.35
SD 4.60 4.27 4.32 4.46 5.20
UTL 25.99 26.64 28.84 26.19 30.70
LTL 7.64 9.62 11.63 8.44 10.00
31-45 21 Mean 20.06 19.56 23.09 22.63 23.69
SD 7.39 4.76 6.80 6.20 5.74
UTL 36.95 30.43 38.63 36.80 36.81
LTL 3.18 8.68 7.55 8.45 10.57
46-60 12 Mean 23.31 21.30 25.79 26.35 28.44
SD 8.19 6.02 5.76 8.83 9.64
UTL 45.06 37.29 41.09 49.81 54.03
LTL 1.54 5.31 10.50 2.89 2.84
for occupational exposure (10,11). However, there is evidence that even mercury levels below these values may have damaging con-sequences for sensory and motor functions (23,24).
Our results were consistent with those of Lebel et al. (23,24). These investigators tested
29 inhabitants of Amazonian communities who had been exposed to high levels of organic mercury compounds by eating con-taminated fish and found a decrease of ach-romatic contrast sensitivity and of color dis-crimination in the Lanthony D-15 test. The present results extend their findings by pre-senting evaluations of subjects exposed to elemental mercury in addition to those ex-posed to methyl mercury. We also extend their conclusions to the Mollon-Reffin test, which is more refined than the ordering tests and provides quantitative evaluation of color vision loss (31,32). The arrangement tests used by Lebel et al. (23,24) do not offer a truly quantitative sensory assessment, in ad-dition to being influence by extraneous vari-ables such as learning and motivation. Simi-larly to our own previous results (25) and to those cited in the present paper, there was a wide variability of results, which could be explained by different degrees of individual exposure and the existence of unknown co-factors. Our findings indicate that psycho-physical assessment can be used to quantify
the degree of visual impairment of mercury-exposed subjects and that some spatial tests, such as the measurement of red-green chro-matic contrast, are more sensitive in detect-ing visual dysfunction caused by mercury toxicity.
Although several of the mercury-exposed subjects had mercury levels in their tissues above the maximum acceptable value pro-posed by the WHO (10,11) tolerance limits, we made no attempt to correlate mercury concentration in urine, hair, or blood with the degree of color vision defects or other health effects. We adopted this approach because these subjects had already left their exposure environment for a variable amount of time when they were tested psychophysi-cally. At present we are testing a larger group of individuals living in two communi-ties exposed to mercury and one community far from the mercury-exposed region. This will allow us to correlate the amount of mercury in their tissue with the quantitative psychophysics results. There are a number of other diseases that may impair color vi-sion and/or contrast sensitivity, including chronic alcoholism, diabetic retinopathy, and prolonged use of medicines to treat some diseases such as rheumatic disorders (e.g., chloroquine), tuberculosis (e.g., ethambu-tol), and epilepsy (e.g., vigabatrin). To dis-tinguish the effect of mercury toxicity from possible effects caused by these other fac-tors, a thorough anamnesis was conducted with all subjects. The inclusion criteria re-quired the absence of such factors.
There have been several reports in the literature about the toxic effects of mercury exposure on visual functions of man and other primates. In the later stages of mercury intoxication there is a severe impairment of the peripheral visual field (33). Neverthe-less, there are reports of central vision dys-function, comprising loss of achromatic con-trast sensitivity for spatial and temporal modulations (23,24,31,32,34) and loss of color discrimination (31,32,35-37).
Table 8. Mollon-Reffin color discrimination test. Hg-ex-posed subjects.
Age Eye N N* Ellipse
(years)
1 2 3 4 5
16-30 Better 1 1 1 1 1 1 1
Worse 1 1 1 1 1 1
-31-45 Better 4 4 3 4 3 2 2
Worse 4 3 2 3 2 2 3
46-60 Better 4 0 - - - -
-Worse 5 0 - - - -
The objective of the present study was to evaluate the visual performance of Amazo-nian gold miners and other workers suffer-ing from mercury poisonsuffer-ing ussuffer-ing chromatic and achromatic spatial tasks. The final goal of this project is to suggest specific and sensitive psychophysical protocols that can be used to detect early stages of visual dys-function due to mercury intoxication. The present study showed that visual psycho-physics has a role in the study of mercury toxicity in the Amazon Region. A less ex-pensive and more portable computer is be-ing built to perform visual psychophysics assessment of inhabitants of riverside com-munities in their place of living.
This portable computer has been tested in a medical expedition to communities lo-cated in the Tapajós River basin. We are now expanding our data base to build norms for Amazonian populations of different ages. The results obtained in the Tapajós region and other locations can then be compared against these norms.
Acknowledgments
We thank Ana Laura A. Moura, Carolina T. Pinto, and Ruth Mayanna A. dos Santos, students from the Universidade Federal do Pará who were recipients of CNPq under-graduate fellowships, for help with the tests.
References
1. Pfeiffer WC, de Lacerda LD. Mercury inputs into the Amazon region, Brazil. Environ Technol Lett 1988; 9: 325-330.
2. Palheta D, Taylor A. Mercury in environmental and biological samples from a gold mining area in the Amazon region of Brazil. Sci Total Environ 1995; 168: 63-69.
3. Malm O, Branches FJ, Akagi H, Castro MB, Pfeiffer WC, Harada M, et al. Mercury and methylmercury in fish and human hair from the Tapajós river basin, Brazil. Sci Total Environ 1995; 175: 141-150. 4. Bidone ED, Castilhos ZC, Cid de Souza TM, Lacerda LD. Fish
contamination and human exposure to mercury in the Tapajós River Basin, Pará State, Amazon, Brazil: a screening approach. Bull Environ Contam Toxicol 1997; 59: 194-201.
5. Malm O. Gold mining as a source of mercury exposure in the Brazilian Amazon. Environ Res 1998; 77: 73-78.
6. Lodenius M, Malm O. Mercury in the Amazon. Rev Environ Contam Toxicol 1998; 157: 25-52.
7. Brabo ES, Santos ECO, Jesus IM, Mascarenhas AFS, Faial KF. Mercury contamination of fish and exposures of an indigenous community in Pará State, Brazil. Environ Res 2000; 84: 197-203. 8. dos Santos LS, Muller RC, de Sarkis JE, Alves CN, Brabo ES,
Santos EO, et al. Evaluation of total mercury concentrations in fish consumed in the municipality of Itaituba, Tapajós River Basin, Pará, Brazil. Sci Total Environ 2000; 261: 1-8.
9. Lima APS, Müller RCS, Sarkis JES, Alves CN, Bentes MHS, Brabo ES, et al. Mercury contamination in fish from Santarém, Pará, Brazil. Environ Res 2000; 83: 117-122.
10. WHO (World Health Organization), IPCS (International Program on Chemical Safety). Environmental Health Criteria 101: Methylmer-cury. Geneva: World Health Organization; 1990.
11. WHO (World Health Organization), IPCS (International Program on Chemical Safety). Environmental Health Criteria 118: Inorganic Mer-cury. Geneva: World Health Organization; 1991.
12. Pinheiro MC, Guimaraes GA, Nakanishi J, Oikawa T, Vieira JL, Quaresma M, et al. Total mercury in hair samples of inhabitants of Tapajós River, Pará State, Brazil. Rev Soc Bras Med Trop 2000; 33:
181-184.
13. Pinheiro MC, Nakanishi J, Oikawa T, Guimarães GA, Quaresma M, Cardoso B, et al. Exposição humana ao metilmercúrio em comuni-dades ribeirinhas do Tapajós, Pará, Brasil. Rev Soc Bras Med Trop 2000; 33: 265-269.
14. Pinheiro MC, Harada M, Yasoda E, Nakanishi J, Oikawa T, Vieira JFV, et al. Toxicological and epidemiological data on human expo-sure to mercury in the Tapajós River basin: 1994-1998. Environ Sci 2003; 10: 99-105.
15. Santos EC, Jesus IM, Brabo ES, Loureiro EC, Mascarenhas AF, Weirich J, et al. Mercury exposures in riverside Amazon communi-ties in Pará, Brazil. Environ Res 2000; 84: 100-107.
16. Harada M, Nakanishi J, Yasoda E, Pinheiro MC, Oikawa T, de Assis GG, et al. Mercury pollution in the Tapajós River basin, Amazon: mercury level of head hair and health effects. Environ Int 2001; 27: 285-290.
17. Hunter D, Bomford RR, Russell DS. Poisoning by methyl mercury compounds. Q J Med 1940; 9: 193-213.
18. Hunter D, Russell DS. Focal cerebellar and cerebellar atrophy in a human subject due to organic mercury compounds. J Neurol Neurosurg Psychiatry 1954; 17: 235-241.
19. McAlpine D, Raki S. Minamata disease: an unusual neurological disorder caused by contaminated fish. Lancet 1958; 2: 629-631. 20. Tsubaki T. Organic mercury intoxication along Agano-river. Clin
Neurol 1968; 8: 511-520.
21. Bakir F, Damluji SF, Amin-Zaki L, Murtadha M, Khalidi A, al-Rawi NY, et al. Methylmercury poisoning in Iraq. Science 1973; 181: 230-241.
22. Tamashiro H, Arakaki M, Akagi H, Futatsuka M, Roht LH. Mortality and survival for Minamata disease. Int J Epidemiol 1985; 14: 582-588.
24. Lebel J, Mergler D, Branches F, Lucotte M, Amorim M, Larribe F, et al. Neurotoxic effects of low-level methylmercury contamination in the Amazonian Basin. Environ Res 1998; 79: 20-32.
25. Silveira LCL, Damin ETB, Pinheiro MCN, Rodrigues AR, Moura ALM, Côrtes MIT, et al. Visual dysfunction following mercury expo-sure by breathing mercury vapour or by eating mercury-contami-nated food. In: Mollon JD, Pokorny J, Knoblauch K (Editors), Normal and defective colour vision. Oxford: Oxford University Press; 2003. p 407-417.
26. Dixon WJ, Massey FJ. Introduction to Statistical Analysis. New York: McGraw-Hill; 1969.
27. Salomão SR, Ventura DF. Large sample population age norms for visual acuities obtained with Vistech-Teller Acuity Cards. Invest Ophthalmol Vis Sci 1995; 36: 657-670.
28. Mullen KT. The contrast sensitivity of human colour vision to red-green and blue-yellow chromatic gratings. J Physiol 1985; 359: 381-400.
29. Mollon JD, Reffin JPA. A computer-controlled colour vision test that combines the principles of Chibret and of Stilling. J Physiol 1989; 414: 5P.
30. Regan BC, Reffin JP, Mollon JD. Luminance noise and the rapid determination of discrimination ellipses in colour deficiency. Vision Res 1994; 34: 1279-1299.
31. Ventura DF, Costa MT, Costa MF, Berezovsky A, Salomao SR,
Simoes AL, et al. Multifocal and full-field electroretinogram changes associated with color-vision loss in mercury vapor exposure. Vis Neurosci 2004; 21: 421-429.
32. Ventura DF, Simões AL, Canto-Pereira LHM, Tomaz S, Lago M, Costa MTV, et al. Color vision and contrast sensitivity losses of mercury contaminated industry workers in Brazil. Environ Toxicol Pharmacol 2005; 19: 523-529.
33. Iwata K, Abe H. Neuroophthalmological and pathological studies of organic mercury poisoning, “Minamata Disease” in Japan. In: Tsubaki T, Takahashi H (Editors), Recent advances in Minamata Disease studies. Methylmercury poisoning in Minamata and Niigata, Japan. Tokyo: Kodansha; 1986. p 58-74.
34. Mukuno K, Ishikawa S, Okamura R. Grating test of contrast sensitiv-ity in patients with Minamata disease. Br J Ophthalmol 1981; 65: 284-290.
35. Cavalleri A, Gobba F. Reversible color vision loss in occupational exposure to metallic mercury. Environ Res 1998; 77: 173-177. 36. Cavalleri A, Belotti L, Gobba F, Luzzana G, Rosa P, Seghizzi P.
Colour vision loss in workers exposed to elemental mercury vapour. Toxicol Lett 1995; 77: 351-356.