Assessment of Precipitation Trends in the Sertão Paraibano Mesoregion
Susane Eterna Leite Medeiros
1, Raphael Abrahão
1, Iker García-Garizábal
2,
Idmon Melo B.M. Peixoto
1, Louise Pereira da Silva
11
Departamento de Engenharia de Energias Renováveis, Centro de Energias Alternativas
e Renováveis, Universidade Federal da Paraíba, João Pessoa, PB, Brazil.
2Faculty of Engineering in Earth Sciences, Escuela Superior Politécnica del Litoral,
Campus Gustavo Galindo, Guayaquil, Ecuador.
Received: December 4, 2017 – Accepted: January 19, 2018
Abstract
The state ofParaíba, located in the northeastern region of Brazil, comprises 223 municipalities and covers an area of 56,469 km2.Paraíbais divided into four major mesoregions: Zona da Mata, Agreste, Borborema and Sertão Paraibano.
For this study, the Sertão Paraibano mesoregion, a semiarid area, was chosen to understand vulnerability to climate change, taking into account the region’s economic importance for water and energy supply. The Mann-Kendall non-parametric test was applied to evaluate trends in the historical series of monthly, trimestrial, biannual and annual precipitation data. The series utilized corresponded to the period 1912-2012 and were built from data generated by five meteorological stations distributed throughout the mesoregion. These stations are maintained by the Executive Agency for Water Management (AESA) and National Department of Works Against Drought (DNOCS). The results indicated increasing precipitation trends for the Sertão Paraibano mesoregion, especially in the annual evaluation, for the first se-mester of the year (January to June), for the trise-mester December-January-February and the month of January, with slopes between 2.67 mm/year and 5.45 mm/year. The results evidenced the need to deepen studies on the influence of climate change in the area, to promote prompt adaptation measures.
Keywords:precipitation, climate change, trend analysis, Mann-Kendall test, semiarid, Brazil.
Avaliação de Tendências de Precipitação
na Mesorregião do Sertão Paraibano
Resumo
O estado da Paraíba, localizado na região Nordeste do Brasil, possui 223 municípios, distribuídos numa área de 56.469 km2. A Paraíba é dividida em quatro mesorregiões: Zona da Mata, Agreste, Borborema e Sertão Paraibano. Para este
estudo, a mesorregião semiárida, Sertão Paraibano, foi escolhida, a fim de compreender a vulnerabilidade às alterações climáticas, considerando sua importância econômica para fornecimento de água e energia. O teste não-paramétrico Mann-Kendall foi utilizado com a finalidade de avaliar tendências nas séries históricas de dados de precipitação mensal, trimestral, semestral e anual. As séries utilizadas correspondem ao período de 1912-2012, construídas a partir de dados provenientes de cinco estações meteorológicas, distribuídas pela mesorregião, mantidas pela Agência Executiva de Gestão das Águas (AESA) e Departamento Nacional de Obras Contra a Seca (DNOCS). Os resultados indicam tendência de aumento na precipitação, principalmente nos intervalos de tempo anual, no primeiro semestre de janeiro a junho (J-J), no trimestre dezembro, janeiro e fevereiro (DJF) e no mês de Janeiro, com incrementos anuais entre 2,67 mm/ano e 5,45 mm/ano. Os resultados evidenciam a necessidade de aprofundar estudos sobre influência das mudanças climáticas na mesorregião do Sertão Paraibano, com o intuito de mitigar os seus efeitos ou promover medidas de adaptação.
Palavras-chave:precipitação, mudança climática, análise de tendências, teste de Mann-Kendall, semiárido, Brasil. Artigo
1. Introduction
Climate change can be defined as a set of statistical variations in the mean state of climate or its variability, at-tributed directly or indirectly to human activity or to natural causes as well. These variations persist for long periods of time and can be detected and assessed through historical se-ries of meteorological data (IPCC, 2007). Furthermore, it is understood that climate trends are characterized by a soft or monotonous change (increase or decrease) in the mean val-ues of these series. The occurrence of climate changes for a specific region can be confirmed by time series trends (Blain, 2010).
Among the topics of climate change, some works can be mentioned that approach trend analysis for meteorologi-cal variables in different locations, such as Groisman and Easterling (1993), Easterlinget al.(1997), Karl and Knight (1998), Kheshgi and White (2001), Easterling (2002), Matsuyamaet al.(2002), Modarres and Silva (2007), Fuet al.(2013). For Brazil, the study of Salvianoet al.(2016) an-alyzed trends in precipitation and temperature data for the entire country. Awangeet al.(2016) studied droughts in Brazil over a period of more than 100 years. Moraeset al. (1998), Marengo and Camargo (2008) and Pinheiroet al. (2013) evaluated trends for the South region of Brazil, while Marengo (2003) and Santos and Lucio (2015) studied climatic trends in the North region. Ramos (1975), Silva (2004), Moscati and Gan (2007), Oliveira and Lima (2014) and Costaet al.(2015) studied the dynamics, distribution and trend for precipitation in the Northeast region and Folhes and Fisch (2006), Minuzziet al.(2007) and Blain (2009, 2010, 2012) focused on the Southeast region, spe-cially the São Paulo state.
Lucenaet al.(2009), based on long-term climate pro-jections for the A2 and B2 IPCC emission scenarios, indi-cated that climate change will affect natural resources related to renewable energy, and predicted increases in vul-nerability for all energy sectors in Brazil, especially in the Northeast region, where the worst climatic scenarios are foreseen, with substantial increases in temperature and drought. Changes in precipitation and temperature patterns can cause or accentuate water quantity and quality prob-lems in the region as well (Benito, 2013).
The state ofParaíbais part of the Northeastern region of Brazil and presents semiarid climate in most of its terri-tory, with consequent water scarcity and social issues (Pe-droza, 2009). TheCoremas-Mãe D’águadam complex is located in the semiarid region, belonging to the Piranhas river basin. The Coremas-Mãe D’água dam complex stands out for storing a total of 1,358 billion m3of water, thus composing the greatest water storage potential of the Sertão Paraibano mesoregion (AESA, 2009a). Since 1957, the area has a small hydroelectric power plant, which is supplied from theEstevam MarinhoandMãe D’água res-ervoirs, supplied by thePiancóandAguiarrivers. The hy-droelectric power plant has two generating units, 1,760 kW
each, totalling 3,520 kW (CHESF, 2016). Due to the impor-tance of this region to the water and energy supplies of the State ofParaíba, and the potential impact of changes in the availability of water resources, the present study aims to verify the existence (and understand the behavior) of possi-ble precipitation trends in the area of the Coremas-Mãe D’águadam complex in the Sertão Paraibano mesoregion.
2. Material and Methods
2.1. Characterization of the study area, identification of meteorological stations and organization of data
The state ofParaíbais located in the northeastern re-gion of Brazil. The state presents three types of climate: hu-mid coastal, tropical and semiarid (IBGE, 2002), with a very variable annual regime of precipitations, ranging from 300 mm to 2,000 mm (Cavalcanti, 2009). The state is geo-graphically divided in four mesoregions: Zona da Mata, Agreste, Borborema and Sertão Paraibano (AESA, 2009b); the latter is the main semiarid area and corresponds to the study area chosen for this study (Fig. 1).
The Sertão Paraibano mesoregion presents a semiarid tropical climate characterized by dry landscapes and high temperatures, accompanied by low annual thermal variabil-ity and high rainfall irregularities. In addition, the region is marked by long periods of drought (Cavalcantiet al., 2009; Mendonça and Danni-Oliveira, 2007).
Time series with rainfall information were obtained from 1912 to 2012, to verify rainfall variability and trend analysis. Data were provided by the monitoring networks of the Executive Agency for Water Management (AESA) and National Department of Works Against Drought (DNOCS).
2.2. Statistical methods for the trend analysis
The linear regression method and the non-parametric Mann-Kendall statistical test were applied according to the methodology proposed by Sneyers (1992) to describe the behavior of time series and verify the existence of trends.
The Mann-Kendall test is usually employed to under-stand trends in time series of climate data. One of the main advantages of non-parametric tests is that application is in-dependent of data distribution. A limitation of these tests lies in the need for interdependence between the elements
of the series, that is, sequence of data must occur independ-ently and randomly, characterizing a simple random series whose distribution of probability is homogeneous (Goos-sens and Berger, 1986; Back, 2001; Fechine and Galvíncio, 2010).
The Future Climate and Hydrological Scenarios for Environmental Management and Assessment program (FuCHSIA) was applied to assess rainfall trends for the monthly, trimestrial (December-January-February: DJF, March-April-May: MAM, June-July-August: JJA, Septem-ber-October-November: SON), biannual (January to June: Figure 1- Geographic locations of the mesoregions of the State ofParaíbaand identification of the municipalities with the five meteorological stations studied (Adapted from AESA, 2009b).
Table 1- Meteorological stations used in the study.
Station number Operator Station Range of series (year) Lat. S (°) Lon. W (°) Number of absent years Period (years)
737022 AESA Água Branca 1936-2012 -7.51 -37.62 4 72
AESA -7.51 -37.64
738025 DNOCS Aguiar 1935-2012 -7.08 -38.18 6 71
AESA -7.09 -38.17
737019 DNOCS Coremas 1934-2012 -7.02 -37.97 13 65
AESA -7.03 -37. 94
738013 DNOCS Princesa Isabel
1912-2012 -7.73 -38.02 2 98
AESA - 7.73 -37.99
737002 DNOCS Teixeira 1926-2011 -7.22 -37.27 7 78
J-J and July to December: J-D), and annual precipitation data. FuCHSIA was developed to analyze time-series trends in scenarios of current climate and conditions of cli-mate change (García-Garizábal and Espinoza, 2016; Gar-cía-Garizábalet al., 2017). The program was developed by the private sector and more details and information may be obtained in García-Garizábalet al.(2017). The FuCHSIA program applies the Mann-Kendall test to identify trends in time series and uses the Sen’s linear regression method as a quantifier to define the slope of the line and provide the magnitude of the trend (Mann, 1945; Sen, 1968; Kendall, 1975).
3. Results and Discussion
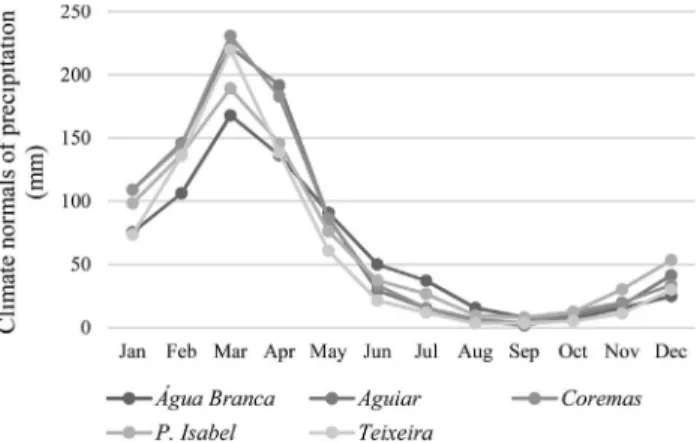
The mean annual precipitation in the area varied be-tween 715.59 mm (Teixeira station) and 879.11 mm (Coremasstation). The monthly distribution of precipita-tion presents similar behavior across the five staprecipita-tions (Fig. 2), with maximum values for February, March and April, and minimum values for August, September and Oc-tober, evidencing when wet and dry periods occur, which are a common characteristic of this area of the Brazilian semiarid.
The intra-annual variability of precipitation in the mesoregion is accentuated. The maximum values of the monthly mean rainfall occur in March for the five stations studied. The minimum values occur in August for the Teixeirastation, in September for three of the five stations (Aguiar,CoremasandPrincesa Isabelstations) and in Oc-tober for the station inÁgua Branca. Significant increases in precipitation were detected for the annual, biannual, tri-mestrial and monthly trends, but with different magnitudes and error probabilities across stations (Table 2). All stations presented positive values with significant trends between 2.67 mm/year and 5.45 mm/year for the total annual precip-itation, except forPrincesa Isabel.
In the biannual intervals, for J-J all trends were signif-icantly positive, between 3.10 mm/year and 3.97 mm/year, indicating precipitation increases in the area. The only
ex-ception was, again, thePrincesa Isabelstation. In the pe-riod J-D, only two stations presented significant trends, which ranged from 0.71 mm/year forTeixeirastation and 1.23 mm/year for Água Branca station. In addition, the slopes in the J-J period were always higher than J-D slopes (Table 2).
Regarding trimestrial analysis, significant trends were detected, with increased precipitation during DJF for four of the five meteorological stations, with values be-tween 1.65 mm/year and 2.44 mm/year. In MAM, the Princesa Isabelstation registered the only significant trend (increase of 1.10 mm/year). In JJA, the results indicated a significant increase trend of 0.59 mm/year and 1.00 mm/year forTeixeiraandÁgua Brancastations, re-spectively. In SON, the only station that presented a signifi-cant trend wasTeixeira, with an increase of 0.06 mm/year. In addition, 25% of slope values were negative, with no sta-tistical significance.
For the monthly assessments, although the month with highest precipitation in the mesoregion is March, the month of January was the most affected of all, presenting values of significant trends between 0.58 mm/year and 0.88 mm/year in four of the five meteorological stations. In the same way, theÁgua Brancastation presented the high-est number of months affected by significant trends, be-tween 0.09 mm/year in December and 0.88 mm/year in January. There was a predominance of positive trend val-ues, and 33.3% presented statistical significance.
The results highlight that the annual cumulative val-ues of precipitation presented stronger significant trends compared to some isolated periods of the year (i.e. bian-nual, trimestrial or monthly). This is due to the characteris-tics of trend tests, where greater variability in data decreases the determination of significant trends.
Four of the five meteorological stations showed sig-nificant increases in precipitation for the annual period, first semester (J-J), first quarter (DJF) and January. The meteorological stations Água Branca and Teixeira pre-sented significant increasing trends for precipitation in higher number of periods. The stations Coremas and Aguiarpresented similar behavior, with significant trends in the same periods, and the station inPrincesa Isabelwas the most different, showing significant increasing trends in only 10.5% of its series (in trimester MAM and the month July).
The differentiated behavior atPrincesa Isabelstation probably occurred due to the climatic factors influencing the flow of heat and humidity locally, such as the relief, which plays an important role as regulator of humidity and temperature by altitude (Princesa Isabelis at 683 m of alti-tude), besides its position, orientation of its slopes and declivity. In addition, rainfall irregularities and high tem-peratures are characteristic features of the Sertão region (Mendonça; Danni-Oliveira, 2007). Therefore, in order to better understand the singular behavior presented at Prin-Figure 2- Monthly climate normals of precipitation for the five stations
cesa Isabel, a more in-depth local study of climatic factors and elements is necessary.
In the stationsÁgua Branca,Aguiar,Coremas and Princesa Isabel, at least one of the intervals (annual, bian-nual, trimestrial or monthly) presented negative trends, which would indicate a decrease in rainfall. However, none presented statistical significance. Other statistical methods could be applied in conjunction with trend analysis to cor-roborate the understanding of the dynamics of climate change in the area, like cluster analysis (Abrahão, 2014; Lyraet al., 2014; Teodoroet al., 2016).
The detected trends indicate that, in 10 years, precipi-tation will be higher when compared to the means observed in 3% (inAguiar) and 7% (inTeixeiraandÁgua Branca), with the highest annual mean inCoremas, above 910 mm, indicating an increase of 4% in 10 years (Table 3). The
ex-pected increases in 30 years forÁgua BrancaandTeixeira are sharper than those ofAguiarandCoremas. While these will increase by 9% and 12%, respectively,Água Branca may reach an annual mean of almost 900 mm, andTeixeira above 850 mm. In 50 years, Água Branca, Aguiar and Coremas may present annual precipitation means above 1000 mm.Teixeiracould increase its annual mean by 33%, reaching more than 950 mm.
From what has been observed by the trends, these fu-ture increases will not be uniform throughout the year. At Água Brancastation, the highest number of monthly series with significant trends (7 in 12 series) were detected. In 10 years, it may rain from 25.8 mm (in December) to 114.5 mm (in February). Keeping this perspective in 50 years, the observed trends indicate a possible increase in Table 2- Precipitation trends (1912-2012) for the meteorological stations Água Branca, Aguiar, Coremas, Princesa Isabel and Teixeira.
Precipitation trends (mm/year)
Period Água Branca Aguiar Coremas Princesa Isabel Teixeira
Annual 5.45 *** 2.67 + 3.43 * 0.61 ns 4.70 **
J-J 3.97 ** 3.37 + 3.10 + 0.92 ns 3.61 **
J-D 1.23 *** -0.19 ns 0.18 ns -0.12 ns 0.71 ***
DJF 2.44 *** 1.65 * 1.77 * -0.24 ns 1.93 **
MAM 1.11 ns 0.86 ns -0.23 ns 1.10 + 1.44 ns
JJA 1.00 *** -0.12 ns 0.10 ns 0.28 ns 0.59 ***
SON 0.05 ns -0.07 ns 0.00 ns -0.20 ns 0.06 *
January 0.88 ** 0.80 + 0.86 * 0.32 ns 0.58 **
February 0.82 * 0.66 ns 0.38 ns -0.18 ns 0.46 ns
March 0.17 ns -0.45 ns -0.76 ns 0.24 ns 0.07 ns
April -0.01 ns 0.54 ns 0.13 ns 0.49 ns 0.75 ns
May 0.83 * 0.46 ns 0.20 ns 0.28 ns 0.31 ns
June 0.33 + -0.08 ns 0.00 ns 0.01 ns 0.14 ***
July 0.30 * -0.01 ns 0.03 ns 0.14 * 0.13 ***
August 0.15 *** 0.00 ns 0.00 ns 0.00 ns 0.00 ns
September 0.00 ns 0.00 ns 0.00 ns 0.00 ns 0.00 ns
October 0.00 ns 0.00 ns 0.00 ns 0.00 ns 0.00 ns
November 0.00 ns 0.00 ns 0.00 ns -0.03 ns 0.00 ns
December 0.09 ** 0.00 ns 0.06 ns -0.01 ns 0.02 ns
ns: not significant; +p <0.10; *p <0.05; *p <0.01; *p <0.001.
Table 3- Projected annual mean precipitation for 10, 20, 30, 40 and 50 years at stations with significant annual trends detected (Água Branca, Aguiar, Coremas and Teixeira).
Station Precipitation means (mm)
Precipitation trends (mm/year)
Projected annual mean precipitation (mm)
10 years 20 years 30 years 40 years 50 years
Água Branca 735.31 5.45 789.81 844.31 898.81 953.31 1007.81
Aguiar 876.02 2.67 902.72 929.42 956.12 982.82 1009.52
Coremas 879.11 3.43 913.41 947.71 982.01 1016.31 1050.61
relation to the mean monthly precipitation between 18% and 58%, in December and January respectively.
The future projections reinforce the notion that it is raining more yearly and monthly in the mesoregion of Sertão Paraibano. However, to better understand this cli-matic dynamics, more detailed studies on the spatial and temporal distribution of precipitation are necessary, as well as the application of robust climate models, along with the observed trends.
The Nucleus of Strategic Affairs of the Brazilian Presidency (NAE, 2005a, b) indicates that Brazilian North-east is one of the most vulnerable regions to climate change due to climate (mostly semiarid), social and economic fac-tors. Therefore, theCoremas-Mãe D’águadam complex is a key infrastructure for supplying water to population and generating electricity. Thus, studies that include analysis of climate variability in theParaíbaregion are necessary to preventively address the issues arising from climate change and its environmental, economic and social impacts. Al-though the Intergovernmental Panel on Climate Change (IPCC) projections indicated an increase in temperatures throughout the Brazilian territory, precipitation analyses did not present conclusive results (IPCC, 2007), evidencing the need to continue developing pluviometric studies that address the dynamics and evolution of this climate compo-nent.
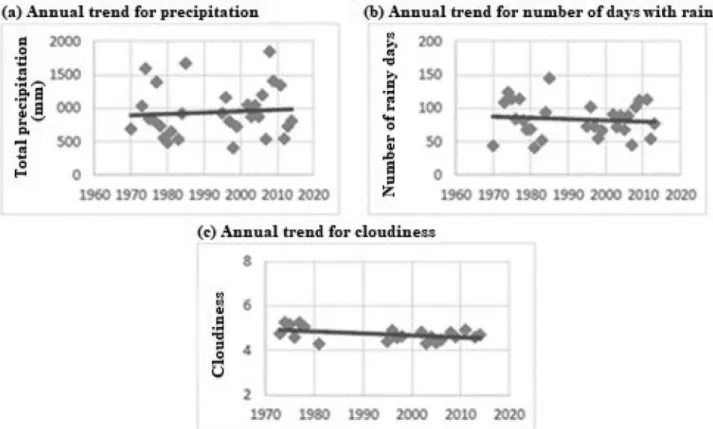
In the present study, trends of increase in the total an-nual rainfall were observed. These results complement those reported by Peixoto and Abrahão (2015) for the mu-nicipalities ofPatosandSão Gonçalo, which also belong to the mesoregion of Sertão Paraibano. Also, decreases were detected in cloudiness and number of rainy days (Figs. 3 and 4), leading one to believe that rainfall intensity is in-creasing in the area. The study of Peixoto and Abrahão therefore detected that recent rainfall events were more in-tense, as a significant decreasing trend was detected for rainy days combined with an increase in total annual rain-fall. Other studies based on climate models also suggest a higher probability of increased frequency of consecutive dry days in the Northeast region of Brazil, correlating with desertification processes, especially in the semiarid portion (Conti, 2005; IPCC, 2007; Nobre, 2011; Costa and Soares, 2012).
A study on extreme precipitation events for the semiarid region of the Brazilian Northeast by Costaet al. (2015) indicated an increase in drought intensity, which corroborates the results found by Peixoto and Abrahão (2015). However, Costaet al.(2015) detected decreasing trends for intense precipitation events and reduction of the annual precipitation in the dry and rainy periods. This high-lights the lack of uniformity in rainfall distribution for this region as the meteorological stations considered were
ferent. The study by Silvaet al.(2004) observed high vari-ability for the spatial distribution of precipitation and num-ber of rainy days in Northeast Brazil. Variability is usually higher during the dry period. In addition, the authors affirm that the Northeastern semiarid region presents the highest coefficient of variation for rainfall and number of rainy days when compared to other areas of Brazil.
According to the Brazilian National Water Agency (ANA), during this century most cities with more than 5,000 inhabitants in the semiarid Northeast will face diffi-culties to supply water for human consumption due to pop-ulation growth and increased water demands (ANA, 2005). Furthermore, it is important to emphasize that the Brazilian electricity grid is based on renewable sources, with hydro-electric being responsible for more than 60% of national electricity generation in 2015 (EPE, 2014; Delgado and Carvalho, 2016). However, for the state ofParaíba, elec-tricity generation in hydroelectric power plants represented only 0.7% of installed capacity although electricity gener-ated by hydroelectric plants in Northeast Brazil represents 49% of its total electricity generation capacity (EPE, 2014; Nogueiraet al., 2014).
Thus, the sustainability of an electricity matrix based on hydropower implies in the need to continue developing studies to better understand the occurrence and distribution of precipitation under climate change influence, to
elabo-rate appropriate plans for the management of water and energy resources.
4. Conclusions
Trend analysis detected significant positive trends for precipitation in four of the five meteorological stations for the annual time interval in the Sertão Paraibano meso-region. The trend values obtained in the different stations and analyzed time intervals were heterogeneous, although four of the five stations showed similar behavior in the evo-lution of precipitation. Trend values for the annual assess-ment were between 2.67 mm/year and 5.45 mm/year; bian-nual (J-J) were between 3.10 mm/year and 3.97 mm/year, trimestrial (DJF) between 1.65 mm/year and 2.44 mm/year and monthly (January) between 0.58 mm/year and 0.88 mm/year.
No significant negative trends were observed, which means that, according to the results obtained, it is possible to perceive significant trends only for the increase of pre-cipitation in the mesoregion of Sertão Paraibano.
The work presented herein represents an important contribution for the comprehension of dynamics of climate evolution in the Brazilian semiarid, providing information that can be applied to the development of environmental measures and management of water resources in this vul-nerable region.
Acknowledgments
This work was carried out with the support of AESA (Executive Agency for Water Management) and CNPq pro-jects 305419/2015-3 and 401687/2016-3.
References
ABRAHãO, R. Compreensão de mudanças climáticas regionais atraves da aplicação de três métodos estatísticos. In: V Congresso Brasileiro de Energia Solar, 2014.
AESA - Agência Executiva de Gestão das Águas do Estado da Paraíba.Plano Estadual de Recursos Hídricos - Relatório
final. João Pessoa, 2009a. Disponível em:
http://www.aesa.pb.gov.br/perh/. Acesso em: 25 nov. 2016. AESA - Agência Executiva de Gestão das Águas do Estado da
Paraíba.Mapa das mesorregiões do Estado da Paraíba.
João Pessoa, 2009b. Disponível em:
http://www.aesa.pb.gov.br/perh/. Acesso em: 25 nov. 2016. ANA - Agência Nacional das Águas. Caderno de Recursos
Hídricos. Disponibilidade e demanda de recursos
hí-dricos no Brasil. 2005. Disponível em:
http://www2.ana.gov.br/Paginas/servicos/planejamento/est udos/cadernoderecursos.aspx. Acesso em: 25 nov. 2016. AWANGE, J.L.; MPELASOKA, F.; GONCALVES, R.M. When
every drop counts: Analysis of Droughts in Brazil for the 1901-2013 period. Science of The Total Environment, v. 566, p. 1472-1488, 2016.
BACK, J.A. Aplicação de análise estatística para a identificação de tendências climáticas. Pesquisa Agropecuária Brasi-leira, v. 36, n. 5, p. 717-726, 2001.
BECKER, C.T.; MELO, M.M.M.S; COSTA, M.N.M.; RIBEIRO, R.E.P. Caracterização Climática das Regiões Pluviometri-camente Homogêneas do Estado da Paraíba.Revista Bra-sileira de Geografia Física, v. 1, p. 286-299, 2011. BENITO, Y.Energy and Climate Change. Capacity Building
Programmed on Renewable Energy. Observatory for
Renewable Energy in Latin America and the Caribean.
2013. Disponível em:
http://www.renenergyobservatory.org/en/capac-ity-building-programme.html. Acesso em: 15 jul. 2016. BLAIN, G.C. Considerações estatísticas relativas à oito séries de
precipitação pluvial da Secretaria de Agricultura e Abas-tecimento do Estado de São Paulo.Revista Brasileira de Meteorologia, v. 24, n. 1, p. 12-23, 2009.
BLAIN, G.C. Tendências e variações climáticas em séries anuais de precipitação pluvial do estado de São Paulo.Bragantia, v. 69, n. 3, p. 765-770, 2010.
BLAIN, G.C. Monthly values of the standardized precipitation in-dex in the State of São Paulo, Brazil: trends and spectral fea-tures under the normality assumption.Bragantia, v. 71, n. 1, p. 122-131, 2012.
CAVALCANTI, I.F.A.; FERREIRA, N.J.; DIAS, M.A.F.S.; SIL-VA, M.G.A.J.S. Tempo e clima no Brasil. São Paulo: Oficina de textos, 2009.
CHESF - CompanhiaHidroelétrica do São Francisco. Curemas.
2016. Disponível em:
https://www.chesf.gov.br/SistemaChesf/Pages/SistemaGer acao/Curemas.aspx. Acesso em: 12 jul. 2016.
CONTI, J.B.A questão climática do nordeste brasileiro e os Processos de desertificação. Revista Brasileira de Climatologia,v. 1, p. 7-14, 2005.
COSTA, A.C.; SOARES, A. Local spatiotemporal dynamics of a simple aridity index a region susceptible to desertification.
Journal of Arid Environments, v. 87, p. 8-18, 2012. COSTA, M.S.; LIMA, K.C.; ANDRADE, M.M.; GONÇALVES,
W.A. Tendências observadas em extremos de precipitação sobre a região Semiárida do Nordeste do Brasil. Revista Brasileira de Geografia Física, v. 08, n. 5, p. 1321-1334, 2015.
DELGADO, D.B.M.; CARVALHO, M. Potencial da energia so-lar fotovoltaica em geração distribuída para manutenção da pegada de carbono do mix elétrico brasileiro. In: Congresso Brasileiro de Gestão Ambiental e Sustentabilidade, João Pessoa, 2016.
EASTERLING, D.R.; HORTON, B.; JONES, P.D.; PETERSON, T.C.; KARL, T.R.; PARKER, D.E.; SALINGER, M.J.; RAZUVAYEV, V.; PLUMMER, N.; JAMASON, P.; FOL-LAND, C.K. Maximum and minimum temperature trends for the globe.Science, v. 277, n. 5324, p. 364-367, 1997. EASTERLING, D.R. United States Historical Climatology
Network Daily Temperature and Precipitation Data (1871-1997). ORNL Oak Ridge National Laboratory, 2002. EPE - Empresa de Pesquisa Energética.Anuário Estatístico de
Energia Elétrica 2014 - ano base 2013. 2014. Disponível em: http://www.epe.gov.br/AnuarioEstatisticode EnergiaEletrica/20130909_1.pdf. Acesso em: 12 ago. 2016. FECHINE, J.A.L.; GALVÍNCIO, J.D. Aplicação do teste de
Mann-Kendall na análise de tendências climáticas - bacia hidrográfica do rio Brigida - estado de Pernambuco. In: SEABRA, G.F.; SILVA, J.A.N.; MENDONÇA, I.T.L. (Or-ganizadores).A conferência da Terra: aquecimento glo-bal, sociedade e biodiversidade. João Pessoa-PB: Editora Universitária da UFPB, 2010.
FOLHES, M.T.; FISCH, G. Caracterização climática e estudo de tendências nas séries temporais de temperatura do ar e preci-pitação em Taubaté (SP).Revista Ambiente e Água - An Interdisciplinary Journal of Applied Science, v. 1, n. 1, 2006.
FU, G.; YU, J.; YU, X.; OUYANG, R.; ZHANG, Y.; WANG, P.; LIU, W.; MIN, L. Temporal variation of extreme rainfall events in China, 1961-2009.Journal of Hydrology, v. 487, p. 48-59, 2013.
García-Garizábal, I.; ESPINOZA, C.C.FuCHSIA: Future Cli-mate and Hydrological Scenarios for Environmental
Management and Assessment. Statistical Climate Change
Program, Guayaquil, 2016.
García-Garizábal, I.; Romero, P.; Jimenez, S.; Jordá, L. Evolución climática en la costa de Ecuador por efecto del cambio climático.DYNA, v. 84, n. 203, P. 37-44, 2017.
GOOSSENS, C.; BERGER, A. Annual and seasonal climatic variations over the northern hemisphere and Europe during the last century. In Annales geophysicae. Series B. Terres-trial and planetary physics, v. 4, n. 4, p. 385-399, 1986. GROISMAN, P.Y.; EASTERLING, D.R. Variability and trends
of total precipitation and snowfall over the United States and Canada.Journal of Climate, v. 7, n. 1, p. 184-205, 1994. IBGE - Instituto Brasileiro de Geografia e Estatística.Atlas
geo-gráfico brasileiro. 2002. Disponível em:
http://atlasescolar.ibge.gov.br/images/at-las/mapas_brasil/brasil_clima.pdf. Acesso em: 04 ago. 2016.
IPCC - Intergovernmental Panel on Climate Change. Climate change 2007: Climate change impacts, adaptation and vulnerability, IPCC Working Group II, 4thAssessment
Re-port.Sumary for Policymakers. Houghton, 2007.
KARL, T.R.; KNIGHT, R.W. Secular trends of precipitation amount, frequency, and intensity in the United States. Bulle-tin of the American Meteorological society, v. 79, n. 2, p. 231-241, 1998.
KENDALL, M.G.Rank Correlation Methods. London: Charles Griffin, 1975.
KHESHGI, H.S.; WHITE, B.S. Testing distributed parameter hy-potheses for the detection of climate change.Journal of cli-mate, v. 14, n. 16, p. 3464-3481, 2001.
LUCENA, A.F.P.; SZKLO, A.S.; SCHAEFFER, R.; SOUZA, R.R.; BORBA, B.S.M.C.; COSTA, I.V.L.; AMARO JÚ-NIOR, O.P.; CUNHA, S.H.F. The vulnerability of renew-able energy to climate change in Brazil. Energy Policy, v. 37, p. 879-889, 2009.
LYRA, G.B.; OLIVEIRA-JÚNIOR, J.F.; ZERI, M. Cluster analy-sis applied to the spatial and temporal variability of monthly rainfall in Alagoas state, Northeast of Brazil.International Journal of Climatology, v. 34, n. 13, p. 3546-3558, 2014. MANN, H.B. Nonparametric tests against trend. Econometric.
The econometric society, v. 13, p. 245-259, 1945. MARENGO, J.A. Condições climáticas e recursos hídricos no
Norte Brasileiro. Clima e Recursos Hídricos no Brasil, Associação Brasileira de Recursos Hídricos FBMC/ANA, 2003.
MARENGO, J.A.; CAMARGO, C.C. Surface air temperature trends in Southern Brazil for 1960-2002. International Journal of climatology, v. 28, n. 7, p. 893-904, 2008. MATSUYAMA, H.; MARENGO, J.A.; OBREGON, G.O.;
NOBRE, C.A. Spatial and temporal variabilities of rainfall in tropical South America as derived from climate predic-tion center merged analysis of precipitapredic-tion.International journal of climatology, v. 22, n. 2, p. 175-195, 2002. MENDONÇA, F.; DANNI-OLIVEIRA, I.M. Climatologia:
noções básicas e climas do Brasil. São Paulo: Oficina de Textos, 2007.
MINUZZI, R.B.; SEDIYAMA, G.C.; BARBOSA, E.D.M.; Melo Júnior, J.C.F.D. Climatologia do comportamento do período chuvoso da região sudeste do Brasil.Revista Brasileira de Meteorologia, v. 22, n. 3, p. 338-344, 2007.
MODARRES, R.; SILVA, V.DPR. Rainfall trends in arid and semi-arid regions of Iran.Journal of Arid Environments, v. 70, n. 2, p. 344-355, 2007.
MOLION, L.C.B.; BERNARDO, S.O. Uma Revisão da Dinâmica das chuvas no Nordeste Brasileiro. Revista Brasileira de Meteorologia, v. 17, n. 1, p. 1-10, 2002.
MORAES, J.M.; PELLEGRINO, G.Q.; BALLESTER, M.V.; MARTINELLI, L.A.; VICTORIA, R.L.; KRUSCHE, A.V. Trends in hydrological parameters of a southern Brazilian watershed and its relation to human induced changes.Water Resources Management, v. 12, n. 4, p. 295-311, 1998. MOSCATI, M.C.L.; GAN, M.A. Rainfall variability in the rainy
season of semiarid zone of Northeast Brazil (NEB) and its relation to wind regime.International Journal of Clima-tology, v. 27, n. 4, p. 493-512, 2007.
NAE - Núcleo de Assuntos Estratégicos da Presidência da Repú-blica.Mudança de clima, v. 1: Negociações internacio-nais sobre a mudança de clima: vulnerabilidade,
impac-tos e adaptação à mudança de clima. Cadernos
NAE-SECOM. Brasília, 2005a.
NAE - Núcleo de Assuntos Estratégicos da Presidência da Repú-blica. Mudança de clima, v. 2: Mercado de carbono. Cadernos NAE-SECOM. Brasília, 2005b.
NOBRE, P. Mudanças climáticas e desertificação: os desafios para o Estado Brasileiro. In: LIMA, R.C.C.; CAVALCAN-TE, A.M.B.; PEREZ-MARIN, A.M. (Ed)Desertificação e
mudanças climáticas no semiárido brasileiro. Campina
Grande: INSA-PB, p. 25-36, 2011.
NOGUEIRA, G.M.F., GIRARD, O.R.S.; PAVAN, R.C.; SOA-RES, L.C.R. Eixos integrados de desenvolvimento da
Paraíba: Uma visão estratégica para o Estado. SEPLAG:
João Pessoa, 2014.
OLIVEIRA, P.T.; LIMA, K.C. Linear trend of occurrence and in-tensity of heavy rainfall events on Northeast Brazil. Atmo-spheric Science Letters, v. 15, n. 3, p. 172-177, 2014. PEDROZA, I.C.B.Estimativa da Climatologia Diária da
Pre-cipitação e Investigação de Possíveis Influências das
Fa-ses da Lua nas Chuvas no Estado da Paraíba.
Disser-tação, Universidade Federal de Campina Grande (UFCG), 2009.
PEIXOTO, I.M.B.M.; ABRAHãO, R. Mudanças climáticas e seus impactos no Nordeste brasileiro, Relatório Final PIBIC, 2015.
PINHEIRO, A.; GRACIANO, R.L.G.; SEVERO, D.L. Análise de tendência das séries temporais de precipitação da região sul do Brasil.Revista Brasileira de Meteorologia, v. 28, n. 3, p. 281-290, 2013.
RAMOS, R.P.L. Precipitation characteristics in the Northeast Brazil dry region.Journal of Geophysical Research, v. 80, n. 12, p. 1665-1678, 1975.
SALVIANO, M.F.; GROPPO, J.D.; PELLEGRINO, G.Q. Trends Analysis of Precipitation and Temperature Data in Brazil.
Revista Brasileira de Meteorologia, v. 31, n. 1, p. 64-73, 2016.
SANTOS, E.B.; LUCIO, P.S. Precipitation regionalization of the Brazilian Amazon. Atmospheric Science Letters, v. 16, n. 3, p. 185-192, 2015.
SEN, P.K. Estimates of the regression coefficient based on Kend-all’s tau.Journal of the American Statistical Association, v. 63, p. 1379-1389, 1968.
SILVA, V.D.P.R. On climate variability in Northeast of Brazil.
Journal of Arid Environments, v. 58, n. 4, p. 575-596, 2004.
SNEYERS, R. On the use of Statistical Analysis for the Objective Determination of Climatic Change. Meteorologische Zeitschrift, v. 1, p. 247-256, 1992.
TEODORO, P.E.; Oliveira-Júnior, J.F., Cunha, E.R., Correa, C.C.G., Torres, F.E., Bacani, V.M., Gois, G.; Ribeiro, L.P. Cluster analysis applied to the spatial and temporal variabil-ity of monthly rainfall in Mato Grosso do Sul State, Brazil.
Meteorology and Atmospheric Physics, v. 128, n. 2,
p. 197-209, 2016.