UNIVERSIDADE ESTADUAL PAULISTA
“JÚLIO DE MESQUITA FILHO”
FACULDADE DE MEDICINA DE BOTUCATU
AVALIAÇÃO DO ESTRESSE OXIDATIVO E INGESTÃO
DIETÉTICA DE ANTIOXIDANTES EM INDIVÍDUOS
PORTADORES DE SÍNDROME METABÓLICA
LIDIANA DE CAMARGO TALON CHIAVERINI
Tese apresentada à Faculdade de Medicina, Universidade Estadual Paulista “Júlio de Mesquita Filho”, Câmpus de Botucatu, para obtenção do título de Doutora em Patologia.
Universidade Estadual Paulista
“Júlio de Mesquita Filho”
Faculdade de Medicina de Botucatu
AVALIAÇÃO DO ESTRESSE OXIDATIVO E INGESTÃO
DIETÉTICA DE ANTIOXIDANTES EM INDIVÍDUOS
PORTADORES DE SÍNDROME METABÓLICA
Doutoranda: Lidiana de Camargo Talon Chiaverini
Orientadora: Profa. Dra. Camila Renata Corrêa Camacho
Co-orientadora: Dra. Vania dos Santos Nunes
Tese apresentada à Faculdade de Medicina, Universidade Estadual Paulista “Júlio de Mesquita Filho”, Câmpus de Botucatu, para obtenção do título de Doutora em Patologia.
Sumário
Síndrome Metabólica, Inflamação e Estresse Oxidativo... 6
Defesa Antioxidante... 8
Biomarcadores do estresse oxidativo... 9
Ingestão dietética, estresse oxidativo e síndrome metabólica... 8
Considerações Finais... 9
Referências bibliográficas... 13
Evaluation of the redox state in women with and without metabolic syndrome and the influence of patterns of dietary intake on body mass index and DNA damage17 Abstract... 18
Introduction... 19
Material and methods... 20
Study population... 20
Definition of metabolic syndrome... 20
Assessment for components of metabolic syndrome... 21
Evaluation of total antioxidant capacity (TAP)... 21
Evaluation of malondialdehyde (MDA)... 22
Extraction of lymphocytes... 22
Comet assay... 22
Plasma evaluation of carotenoids, retinol and -tocopherol... 24
Assessment of dietary intake... 24
Statistical analysis... 24
Results... 25
Discussion... 28
Conclusion... 33
Tabelas
Table1. Anthropometric data, blood pressure and plasmatic biochemistry profile in G1,
G2 and G3... 25
Table 2. DNA damage and oxidative stress in G1, G2 and G3. ... 26
Table 3. Dietary intake of macronutrients in G1, G2 and G3... 26
Table 4. Dietary intake of micronutrients in G1, G2 and G3. ... 27
Table 5: Plasma levels of carotenoids, -tocopherol, uric acid and retinol in G1, G2 and G3. ... 27
Table 6. Final linear regression model relating DNA damage with consumption of macro- and micronutrients and plasmatic variants. ... 28
Lista de siglas e abreviações
SM - síndrome metabólica RI – resistência à insulina
NCEP - ATPIII – National Cholesterol Education Program – Adult Treatment Pannel III
IDF – International Diabetes Federation OMS – Organização Mundial da Saúde DM – diabetes melitus
EO – estresse oxidativo IL-1 – interleucina-1 IL-6 – interleucina-6
TNF- – fator de necrose tumoral- MDA – malondialdeído
HNE – 4-hidroxi-nonenal
AGEs – produtos finais de glicação ALEs – produtos finais de lipoxidação TBA – ácido tiobarbitúrico
HPLC – cromatografia líquida de alta precisão TAP – capacidade antioxidante total
AUC – área sobre a curva
AAPH – azobis-amidinopropane dihydrochloride ENDO III – endonuclease III
FPG – fosfatidil-pirimidina glicosilase MetS – metabolic syndrome
BMI – body mass index CVD – cardiovascular disease T2D – type 2 diabetes
WC – waist circumference OS – oxidative stress
SBP – systolic blood pressure DBP – diastolic blood pressure TAP – total antioxidant capacity
HPLC – high pressure liquid chromatography MDA – malondialdehyde
SÍNDROME METABÓLICA, INFLAMAÇÃO E ESTRESSE OXIDATIVO
A síndrome metabólica (SM), também conhecida como síndrome X, síndrome da resistência à insulina (RI), ou síndrome plurimetabólica, é caracterizada pelo agrupamento de fatores de risco cardiovasculares como hipertensão arterial, resistência à insulina, obesidade central e dislipidemia aterogênica (LDL-colesterol alto, triglicerídeos altos e HDL-colesterol baixo) e apresenta elevada prevalência na população mundial (1).
Para o diagnóstico da SM existem pelo menos 3 critérios empregando os cinco componentes: circunferência da cintura, pressão arterial, glicemia, trigliceridemia e HDL-colesterol. O National Cholesterol Education Program – Adult Treatment Pannel III (NCEP -ATP III) (2) utiliza pelo menos 3 componentes alterados. O International Diabetes Federation (IDF) (3) considera o perímetro abdominal mais 2 componentes alterados e a Organização Mundial da Saúde (OMS) (4) utiliza a relação cintura/quadril, a presença de diabetes melitus (DM) tipo 2 ou a resistência à insulina, a microabuminúria, hipertensão arterial e trigliceridemia.
Observando esses componentes que classificam o indivíduo como portador de SM, pode-se notar que todos eles são complicações que comumente acometem indivíduos obesos, mostrando que existe uma ligação direta entre essas duas doenças (5). Em geral, essas duas doenças se iniciam com o aumento do tecido adiposo abdominal, o qual é metabolicamente mais ativo, contendo uma quantidade maior de macrófagos residentes comparado a outros depósitos de gordura (6). Essa condição favorece a inflamação e o estresse oxidativo (EO), que são fatores precursores de diversas complicações, mas principalmente de componentes que envolvem SM, como RI, hipertensão arterial e hiperlipidemia (7)(8).
que é caracterizada pela hipertrigliceridemia , baixos níveis de HDL-colesterol e aumento de LDL-colesterol (13). A RI diminui a função do hormônio, levando a uma alteração na estocagem de lipídeos, que é um mecanismo insulino- dependente (14).
Outra causa da inflamação é o EO, que pode ser desencadeado pela necrose dos adipócitos. Quando a massa adiposa aumenta, a irrigação insuficiente pode levar à falta de oxigênio e, assim, à necrose celular. O processo de fagocitose para eliminação dessas células mortas resulta em maior infiltrado inflamatório e também em EO, pela liberação de radicais livres, como óxido nítrico e peróxido de hidrogênio (15, 16), condições que acarretam consequências no desenvolvimento dos componentes da SM (17).
O EO é classicamente definido como um evento resultante do desequilíbrio entre substâncias oxidantes e antioxidantes (18, 19), geradas em um cenário de reações de óxido-redução, onde a oxidação implica em perda de elétron e a redução, em ganho. Visto que a geração e a ação dessas substâncias dependem desse sistema de óxido-redução, autores têm usado o termo desequilíbrio do sistema redox para se referir ao EO (20, 21). Popularmente denominados radicais livres, os produtos oxidantes incluem espécies reativas de oxigênio e nitrogênio, que realizam a oxidação de lipídeos (lipoxidação) e glicose (glicação), substâncias que se encontram em excesso na obesidade, seja por um consumo excessivo de alimentos, o qual aumenta a quantidade de nutrientes energéticos na circulação, bem como pelo processamento desses nutrientes dentro das células (22). Os produtos gerados na lipoxidação são o malondialdeído (MDA), glioxal, acroleína, 4-hidroxi-nonenal (HNE) e os gerados na glicação são o glioxal e o metil glioxal. Esses compostos se ligam ao grupamento amino dos aminoácidos, resultando em produtos finais de glicação (AGEs) e de lipoxidação (ALEs) (23) que são altamente reativos e participam do desenvolvimento de outros componentes da SM.
O EO desempenha um papel importante na patogênese da RI por desregular a liberação de adipocinas pelo tecido adiposo como TNF- e IL-6 as quais podem desencadear inflamação, um mecanismo já descrito acima (28-30). Assim, pode-se observar que as complicações da obesidade são fatores que quando associados, determinam a SM e que a inflamação o EO são fatores diretamente relacionados e presentes nas duas patologias.
Defesa Antioxidante
O EO é controlado pelo sistema de defesa antioxidante endógeno, que inclui enzimas antioxidantes, como a superóxido dismutase, a catalase, glutationa peroxidase, glutationa redutase e compostos não enzimáticos como ferritina, transferrina, bilirrubina, ceruloplasmina, e albumina e os captadores de baixo peso molecular, como o ácido úrico e ácido lipoico (31). Existem, também, os antioxidantes exógenos, oriundos de frutas e hortaliças, dentre eles os hidrofílicos como vitamina C e os flavonoides e os lipofílicos, como a vitamina E os carotenoides. Os carotenoides são distribuídos em um grupo de pigmentos que dão cor amarelo-alaranjado às plantas, animais e microorganismos. Mais de 700 carotenoides foram descobertos, porém a luteína, zeaxantina, criptoxantina, alfa-caroteno, beta-caroteno e licopeno representam 95% dos carotenoides no plasma humano (32).
Os antioxidantes são capazes de interceptar os radicais livres gerados pelo metabolismo celular ou por fontes exógenas por meio da doação de átomos de hidrogênio a estas moléculas, interrompendo a reação em cadeia, o que impede o ataque sobre os lipídeos, os aminoácidos das proteínas, a dupla ligação dos ácidos graxos poliinsaturados e as bases do DNA, evitando a formação de lesões e perda da integridade celular (33). Outro papel dos antioxidantes é no mecanismo de proteção, o qual age no reparo das lesões causadas pelos radicais livres, um processo relacionado à remoção de danos da molécula de DNA e à reconstituição das membranas celulares danificadas (34).
maneira constante e regrada e que a ingestão de vitaminas em forma de suplemento pode resultar em efeito pró-oxidante, chamado estresse antioxidativo (37).
Biomarcadores do estresse oxidativo
As espécies reativas são muito instáveis e possuem uma meia vida muito curta, o que torna um grande desafio a avaliação precisa dessas espécies. Para isso, foram desenvolvidos métodos para medir marcadores de produtos que refletem o estado redox em amostras biológicas; são produtos de oxidação de lipídeos, DNA e proteínas (38). Dentre os mais comuns estão os produtos de peroxidação lipídica pelo fato dos ácidos graxos poliinsaturados (como fosfolipídeos e glicolipídos) e colesterol serem as moléculas mais vulneráveis às espécies reativas. Quando esses lipídeos são oxidados, ocorre a formação de dois produtos classicamente aferidos em amostras biológicas, o MDA e o isoprostrano (39, 40).
O MDA é formado pela peroxidação de ácidos graxos poliinsaturados e pode interagir com proteínas. Ele pode ser detectado através do ácido tiobarbitúrico (TBA), por um método colorimétrico baseado na reação MDA e TBA, formando uma cor rosa, aferindo, assim, o MDA e todas as espécies que reagem com esse ácido (41). O MDA, especificamente, pode ser avaliado pela cromatografia líquida de alta precisão (HPLC). A mesma reação entre MDA e TBA acontece, mas devido ao detector de fluorescência do aparelho, somente o MDA é identificado, tornando esse teste mais específico (42).
O isoprostano é um produto estável de peroxidação lipídica e pode ser aferido tanto nos tecidos como nos fluidos biológicos, incluindo urina, plasma e líquor. O nível desse composto no plasma e na urina correlaciona-se com os níveis de espécies reativas e EO em estudos experimentais em humanos (43). Contudo, em indivíduos saudáveis com risco de obesidade e hiperlipidemia seus níveis estão aumentados, sugerindo ser um bom marcador para riscos cardiovasculares (40).
Capacidade total antioxidante (TAP) também pode ser considerada um marcador de EO, uma vez que afere o estado da capacidade antioxidante em fluidos biológicos. Esse método obtém uma visão mais profunda sobre o envolvimento do EO em várias condições fisiopatológicas, mas também monitora a eficácia das intervenções antioxidantes (44). Nesse método, a capacidade antioxidante da amostra é quantificada comparando a área sobre a curva (AUC) relativa à cinética de oxidação do BODIPY
lipofílico fluorescente oxidável, frente ao iniciador de radical 2,20 -azobis-(2-amidinopropane) dihydrochloride (AAPH) em relação à oxidação de fosfatidilcolina usada como uma referência de matriz lipídica (45).
Outra abordagem para aferir a capacidade antioxidante é medir os antioxidantes individualmente. No entanto, existem muitos e isso demandaria em tempo de dosagem e exigiria uma variedade de técnicas analíticas, instrumentos e procedimentos. Além do que esta abordagem também é pobre em informações sobre a possível sinergia e cooperação entre os antioxidantes hidrofílicos e lipofílicos (45).
Proteínas e DNA também são moléculas altamente suscetíveis a modificações por alterações no estado redox (46). A oxidação de proteínas acontece quando aminoácidos das proteínas (prolina, arginina, treonina, lisina, histidina e cisteína) se ligam a produtos de lipoxidação e glicoxidação, formando grupos carbonil. Essa reação chamada carbonilação pode ser irreversível e levar a alterações na sua função biológica. (23). A detecção desses produtos tóxicos (carbonil) pode ser feita pelo espectrofotômetro de massa (47).
Quanto à lesão do DNA, pode ser feito o teste do cometa, uma técnica de eletroforese celular em microgel, muito útil e largamente empregada para avaliação de danos e reparos de DNA em células individuais. Seu princípio básico é o da lise de membranas celulares, seguida pela indução da migração eletroforética do DNA liberado em matriz de agarose. Quando vista ao microscópio, a célula migrada adquire a forma aparente de um cometa, com cabeça, região nuclear e cauda, que contém fragmentos ou fitas de DNA que migraram na direção do ânodo. A análise dos cometas baseia-se no grau de fragmentação do DNA e sua migração pela microeletroforese (48). Medidas como o comprimento total da cauda e a densidade de DNA fornecem dados indiretos sobre o estado do DNA da amostra. Para detectar os danos oxidativos utilizam-se as enzimas de reparo endonuclease III (ENDOIII) e a fosfatidil-pirimidina de DNA glicosilase (FPG), pelas quais podemos detectar a oxidação nas bases de purina e pirimidinas (49), respectivamente.
Ingestão dietética, estresse oxidativo e síndrome metabólica
Corroborando esse fato, a literatura aponta que indivíduos portadores de SM e obesos possuem um alto consumo de gorduras e açúcares oriundos de alimentos industrializadoscom alto teor de sódio (50-52) e têm uma baixa ingestão de antioxidantes. Dietas com alto teor de antioxidantes como a conhecida dieta do Mediterrâneo, a qual é composta por óleo de oliva, frutas, vegetais, cereais, castanhas e uma quantidade menor de carnes vermelhas e alimentos ricos em açúcar, também são maneiras de controlar o EO e a inflamação (53, 54). Pesquisadores mostraram que indivíduos portadores de SM e obesos retardaram e atenuaram as complicações como RI, hipertensão arterial e hiperlipidemia, quando tiveram uma intervenção e passaram a consumir esse tipo de dieta. Um dos mecanismos apontados para essa melhora foi a diminuição do EO e inflamação (54-58).
Dentre esses estudos, Mitjavila e colaboradores (59) observaram a diminuição de alguns marcadores de EO após um ano de intervenção dietética. Nesse mesmo estudo, indivíduos com SM que consumiram a dieta do mediterrâneo foram comparados a um grupo que consumiu uma dieta apenas com níveis baixos de gordura e foi mostrado que a dieta mais rica em antioxidante foi a que mais resultou em melhora dos marcadores de EO e diminuiu os danos no DNA. Isso mostra a importância da qualidade e da regularidade da dieta e a eficácia dos antioxidantes na sua composição.
Contudo, além da investigação do hábito alimentar desses indivíduos, é de extrema importância examinar os indicadores de EO e inflamação, para que haja uma ferramenta a mais na conduta de tratamento dessas enfermidades.
Considerações Finais
De acordo com a abordagem dessa revisão, pode-se ressaltar o envolvimento da inflamação e, principalmente, do EO na patogênese da SM. Foi salientado que a obesidade pode ser um evento chave no desenvolvimento da síndrome; por isso, uma das estratégias de tratamento é controlar e atenuar o EO, para evitar o desenvolvimento de complicações que levam à SM.
REFERÊNCIAS BIBLIOGRÁFICAS
1. Ford ES, Giles WH, Dietz WH. Prevalence of the metabolic syndrome among US adults: findings from the third National Health and Nutrition Examination Survey. Jama 2002;287:356-9.
2. Executive Summary of The Third Report of The National Cholesterol Education Program (NCEP) Expert Panel on Detection, Evaluation, And Treatment of High Blood Cholesterol In Adults (Adult Treatment Panel III). Jama 2001;285:2486-97.
3. Alberti KG, Zimmet P, Shaw J. The metabolic syndrome--a new worldwide definition. Lancet 2005;366:1059-62.
4. World Health Organization (WHO). Diet, nutrition and the prevention of chronic diseases. Geneva: WHO/FAO. Expert consultation on diet, nutrition and the prevention of chronic diseases. 2002.
5. Dupuy AM, Jaussent I, Lacroux A, Durant R, Cristol JP, Delcourt C. Waist circumference adds to the variance in plasma C-reactive protein levels in elderly patients with metabolic syndrome. Gerontology 2007;53:329-39.
6. Luna-Luna M, Medina-Urrutia A, Alarcon G, Coss-Rovirosa F, Vargas-Barron J, Perez-Mendez O. Adipose Tissue in Metabolic Syndrome: Onset and Progression of Atherosclerosis. Arch Med Res 2015.
7. Yao L, Herlea-Pana O, Heuser-Baker J, Chen Y, Barlic-Dicen J. Roles of the Chemokine System in Development of Obesity, Insulin Resistance, and Cardiovascular Disease. J Immunol Res 2014;2014:181450.
8. Francisqueti F V.; Nascimento A F; Corrêa C R. Obesidade, inflamação e complicações metabólicas. 2015;40(1),81-89.
9. Kloting N, Bluher M. Adipocyte dysfunction, inflammation and metabolic syndrome. Rev Endocr Metab Disord 2014;15:277-87.
10. Cotillard A, Poitou C, Torcivia A, et al. Adipocyte size threshold matters: link with risk of type 2 diabetes and improved insulin resistance after gastric bypass. J Clin Endocrinol Metab 2014;99:E1466-70.
11. Skurk T, Alberti-Huber C, Herder C, Hauner H. Relationship between adipocyte size and adipokine expression and secretion. J Clin Endocrinol Metab 2007;92:1023-33.
12. Andrade-Oliveira V, Câmara NOS, Moraes-Vieira PM. Adipokines as Drug Targets in Diabetes and Underlying Disturbances. Journal of diabetes research 2015.
13. Grundy SM. Hypertriglyceridemia, atherogenic dyslipidemia, and the metabolic syndrome. Am J Cardiol 1998;81:18B-25B.
14. Borer KT. Counterregulation of insulin by leptin as key component of autonomic regulation of body weight. World J Diabetes 2014;5:606-29.
15. Bhattacharya I, Dominguez AP, Dragert K, Humar R, Haas E, Battegay EJ. Hypoxia potentiates tumor necrosis factor-alpha induced expression of inducible nitric oxide synthase and cyclooxygenase-2 in white and brown adipocytes. Biochem Biophys Res Commun 2015;461:287-92.
16. Kosacka J, Kern M, Kloting N, et al. Autophagy in adipose tissue of patients with obesity and type 2 diabetes. Mol Cell Endocrinol 2015;409:21-32.
18. Ferreira AL, Yeum KJ, Matsubara LS, et al. Doxorubicin as an antioxidant: maintenance of myocardial levels of lycopene under doxorubicin treatment. Free Radic Biol Med 2007;43:740-51.
19. Yeum KJ, Russell RM, Krinsky NI, Aldini G. Biomarkers of antioxidant capacity in the hydrophilic and lipophilic compartments of human plasma. Arch Biochem Biophys 2004;430:97-103.
20. Grant CM. Metabolic reconfiguration is a regulated response to oxidative stress. J Biol 2008;7:1.
21. Poli G, Schaur RJ, Siems WG, Leonarduzzi G. 4-hydroxynonenal: a membrane lipid oxidation product of medicinal interest. Med Res Rev 2008;28:569-631. 22. Dandona P, Ghanim H, Chaudhuri A, Dhindsa S, Kim SS. Macronutrient intake
induces oxidative and inflammatory stress: potential relevance to atherosclerosis and insulin resistance. Exp Mol Med 2010;42:245-53.
23. Aldini G, Dalle-Donne I, Facino RM, Milzani A, Carini M. Intervention strategies to inhibit protein carbonylation by lipoxidation-derived reactive carbonyls. Med Res Rev 2007;27:817-68.
24. Montezano AC, Dulak-Lis M, Tsiropoulou S, Harvey A, Briones AM, Touyz RM. Oxidative stress and human hypertension: vascular mechanisms, biomarkers, and novel therapies. Can J Cardiol 2015;31:631-41.
25. Wong WT, Tian XY, Huang Y. Endothelial dysfunction in diabetes and hypertension: cross talk in RAS, BMP4, and ROS-dependent COX-2-derived prostanoids. J Cardiovasc Pharmacol 2013;61:204-14.
26. Hernanz R, Briones AM, Salaices M, Alonso MJ. New roles for old pathways? A circuitous relationship between reactive oxygen species and cyclo-oxygenase in hypertension. Clin Sci (Lond) 2014;126:111-21.
27. Ward NC, Hodgson JM, Puddey IB, Mori TA, Beilin LJ, Croft KD. Oxidative stress in human hypertension: association with antihypertensive treatment, gender, nutrition, and lifestyle. Free Radic Biol Med 2004;36:226-32.
28. Tangvarasittichai S. Oxidative stress, insulin resistance, dyslipidemia and type 2 diabetes mellitus. World J Diabetes;6:456-80.
29. Houstis N, Rosen ED, Lander ES. Reactive oxygen species have a causal role in multiple forms of insulin resistance. Nature 2006;440:944-8.
30. Hotamisligil GS. Inflammation and metabolic disorders. Nature 2006;444:860-7. 31. Poljsak B, Suput D, Milisav I. Achieving the balance between ROS and antioxidants: when to use the synthetic antioxidants. Oxid Med Cell Longev;2013:956792.
32. Maiani G, Caston MJ, Catasta G, et al. Carotenoids: actual knowledge on food sources, intakes, stability and bioavailability and their protective role in humans. Mol Nutr Food Res 2009;53 Suppl 2:S194-218.
33. Sies H. Strategies of antioxidant defense. Eur J Biochem 1993;215:213-9.
34. Sies H. Oxidative stress: from basic research to clinical application. American Journal of Medicine 1991;91:315-85.
35. Mangge H, Becker K, Fuchs D, Gostner JM. Antioxidants, inflammation and cardiovascular disease. World J Cardiol 2014;6:462-77.
36. Fiedor J, Burda K. Potential role of carotenoids as antioxidants in human health and disease. Nutrients 2014;6:466-88.
38. Petramala L, Pignatelli P, Carnevale R, et al. Oxidative stress in patients affected by primary aldosteronism. J Hypertens 2014;32:2022-9; discussion 2029.
39. Petramala L, Pignatelli P, Carnevale R, et al. Oxidative stress in patients affected by primary aldosteronism. J Hypertens;32:2022-9; discussion 2029. 40. Basu S. Bioactive eicosanoids: role of prostaglandin F(2alpha) and
F(2)-isoprostanes in inflammation and oxidative stress related pathology. Mol Cells;30:383-91.
41. Reis GS, Augusto VS, Silveira AP, et al. Oxidative-stress biomarkers in patients with pulmonary hypertension. Pulm Circ 2013;3:856-61.
42. Davies SS, Roberts LJ, 2nd. F2-isoprostanes as an indicator and risk factor for coronary heart disease. Free Radic Biol Med 2011;50:559-66.
43. Fraga CG, Oteiza PI, Galleano M. In vitro measurements and interpretation of total antioxidant capacity. Biochim Biophys Acta 2014;1840:931-4.
44. Fraga CG, Oteiza PI, Galleano M. In vitro measurements and interpretation of total antioxidant capacity. Biochim Biophys Acta;1840:931-4.
45. Beretta G, Aldini G, Facino RM, Russell RM, Krinsky NI, Yeum KJ. Total antioxidant performance: a validated fluorescence assay for the measurement of plasma oxidizability. Anal Biochem 2006;354:290-8.
46. Shacter E. Quantification and significance of protein oxidation in biological samples. Drug Metab Rev 2000;32:307-26.
47. Prado RP, dos Santos BF, Pinto CL, de Assis KR, Salvadori DM, Ladeira MS. Influence of diet on oxidative DNA damage, uracil misincorporation and DNA repair capability. Mutagenesis 2010;25:483-7.
48. Prado RP, dos Santos BF, Pinto CL, de Assis KR, Salvadori DM, Ladeira MS. Influence of diet on oxidative DNA damage, uracil misincorporation and DNA repair capability. Mutagenesis;25:483-7.
49. Collins AR, Gedik CM, Olmedilla B, Southon S, Bellizzi M. Oxidative DNA damage measured in human lymphocytes: large differences between sexes and between countries, and correlations with heart disease mortality rates. FASEB J 1998;12:1397-400.
50. Novak EM, Keller BO, Innis SM. Dietary lipid quality and long-term outcome. Nestle Nutr Workshop Ser Pediatr Program 2011;68:17-27; discussion 27-32. 51. Johnson RJ, Nakagawa T, Sanchez-Lozada LG, et al. Sugar, uric acid, and the
etiology of diabetes and obesity. Diabetes 2013;62:3307-15.
52. Keller U. Dietary proteins in obesity and in diabetes. Int J Vitam Nutr Res 2011;81:125-33.
53. Castro-Quezada I, Roman-Vinas B, Serra-Majem L. The Mediterranean diet and nutritional adequacy: a review. Nutrients 2014;6:231-48.
54. Casas R, Sacanella E, Estruch R. The immune protective effect of the Mediterranean diet against chronic low-grade inflammatory diseases. Endocr Metab Immune Disord Drug Targets 2014;14:245-54.
55. Kastorini CM, Milionis HJ, Esposito K, Giugliano D, Goudevenos JA, Panagiotakos DB. The effect of Mediterranean diet on metabolic syndrome and its components: a meta-analysis of 50 studies and 534,906 individuals. J Am Coll Cardiol 2011;57:1299-313.
57. Domenech M, Roman P, Lapetra J, et al. Mediterranean diet reduces 24-hour ambulatory blood pressure, blood glucose, and lipids: one-year randomized, clinical trial. Hypertension 2014;64:69-76.
58. Vincent-Baudry S, Defoort C, Gerber M, et al. The Medi-RIVAGE study: reduction of cardiovascular disease risk factors after a 3-mo intervention with a Mediterranean-type diet or a low-fat diet. Am J Clin Nutr 2005;82:964-71. 59. Mitjavila MT, Fandos M, Salas-Salvado J, et al. The Mediterranean diet
Evaluation of the redox state in women with and without metabolic syndrome and
the influence of patterns of dietary intake on body mass index and DNA damage
Lidiana C. Talon1, Fabiane V. Francisqueti1, Damiana T. Pierine1, Igor O. Minatel1, Maria E. L.
Navarro1, Cláudia D. L. Oliveira1, Klinsmann C. Santos1, Vânia S. Nunes2, Ana L. A. Ferreira2,
Dijon H. S. Campos2, José E. Corrente3, Camila R. Corrêa1
1Department of Pathology, Botucatu Medical School, Sao Paulo State University (UNESP),
Botucatu, Sao Paulo, Brazil
2Department of Internal Medicine, Botucatu Medical School, Sao Paulo State University
(UNESP), Botucatu, Sao Paulo, Brazil
3Department of Biostatistics, Botucatu Institute of Biosciences, Sao Paulo State University
(UNESP), Botucatu, Sao Paulo, Brazil
Keywords: Metabolic Syndrome, body mass index, comet assay, micronutrients,
macronutrients, women
Acknowledgments
The authors wish to acknowledgments Bruno Luperini for his technical assistance in
comet assay, FAPESP (11/08373-5) for financial support and Proof reading service by
correcting the English.
Corresponding Author:
Camila Renata Corrêa
Botucatu School of Medicine, São Paulo State University- UNESP
Distrito de Rubião Jr s/n, Botucatu, SP, Brazil. CEP: 18618-000
Telephone: (55) 14 3880 1656
Fax: (55) 14 3881 6424
E-mail: ccorrea@fmb.unesp.br
Conflicts of Interest
Evaluation of the redox state in women with and without metabolic syndrome and
the influence of patterns of dietary intake on body mass index and DNA damage
Introduction
Material and methods
Study population
To compose the groups with and without MetS were evaluated all women of reproductive age attended the Endocrinology Clinic of Botucatu Medical School from February 2012 to February 2013 with a BMI (body mass index) > 25 kg/m².Were excluded women who consumed more than 60 g/day alcohol, used antioxidant supplements during the sixty days prior to the study, with altered hematological parameters and albumin, with changed liver and kidney function, cancer, smokers, those who used statins, those with diabetes, with changes in thyroid function, menopausal and those who refused to participate in the study. Thus, we selected 57 women, who were divided according to the presence or absence of MetS which was defined according to International Diabetes Federation (IDF) definitions (5). The control group consisted of healthy women volunteers also of reproductive age with a BMI in the range of normal weight (18,5- 24.9 kg/m²). Thus, they participated in the study 80 women, who were divided into 3 groups, control group (G1, n = 36); group IMC 25 kg / m² without MetS (G2, n = 21) and the group with a BMI 25 kg/m² with MetS (G3, n = 23).
Definition of metabolic syndrome
The diagnosis of MetS was made when at least three of the following criteria, proposed by the IDF (5) were present: WC 80 cm; fasting glucose 110 mg/dL; blood pressure 130/85 mmHg; triglyceride levels 150 mg/dL; HDL-cholesterol < 50 mg/dL; or abnormal WC more two changed components above.
Assessment for components of metabolic syndrome
Body weight was measured using plat form-type digital Filizola anthropometric scales, accurate to 0.1 kg, with the subject barefoot and in minimal attire (6). Height was determined using a mobile stadiometer with a precision of 0.5 cm (6). The BMI was calculated by dividing the current body weight expressed in kilograms by the square of heighten meters. The WC was measured at the midpoint between the last rib and the iliac crest, following recommendations in the literature (7). The systolic (SBP) and diastolic (DBP) blood pressure were measured according to the procedures described by the VI Brazilian Guidelines on Hypertension (8). Plasma concentrations of fasting glucose, triglycerides, total cholesterol and fractions, uric acid were obtained from the records of the Clinical Hospital, Faculty of Medicine of Botucatu, UNESP. Records from no more than 30 days previously were used. In cases where there was no medical record from the previous 30 days, a new collection was made.
Evaluation of total antioxidant capacity (TAP)
Serum TAP was determined by the method reported by Aldini and collaborators (9) and validated by Beretta and collaborators (10) for application to high throughput
values, which represent the percent inhibition of BODIPY oxidation in human serum with respect to that occurring in a control sample consisting of BODIPY 581/591 in phosphatidylcholine liposomes.
Evaluation of malondialdehyde (MDA)
Plasma MDA was measured by high pressure liquid chromatography (HPLC) with fluorometric detection (11) with the data expressed as mol/L.
Extraction of lymphocytes
To evaluate the levels of DNA damage (comet assay) peripheral blood lymphocytes. Blood samples (3 mL) were placed into tubes containing 3 mL of RPMI 1640 medium (Sigma- Aldrich) and then placed carefully on 3 mL Histopaque®1077(sigma-Aldrich). After centrifugation at 2500 rpm for 30 minutes at 10°C, the layer of lymphocytes was removed and mixed with 3 mL RPMI 1640 medium and centrifuged again at 1500 rpm for 15 minutes. After this procedure, the supernatant was discarded and lymphocytes were resuspended to be used for the evaluation of DNA damage by comet assay.
Comet assay
Plasma evaluation of carotenoids, retinol and -tocopherol
Carotenoids, retinol and -tocopherol were measured in 100 µL of plasma by reversed-phase HPLC (Waters Alliance 2695 Separation Module, Waters, Wilmington, MA,USA). The column used was C30 (Waters Alliance, YMC carotenoid: 4.6 x 150 mm; 3.0 m). The measurements were performed as previously described by Yeum and collaborators (13).
Assessment of dietary intake
To determine the habitual diet of the participants, women recorded their dietary intake over three 24-hour periods on non-consecutive days. These data were collected in the period prior to blood collection. To calculate the dietary intake was used Dietpro software (14).
Statistical analysis
Results
Table 1 shows the anthropometric, blood pressure and biochemical profile of these women included in the study and the comparison between groups. It is observed that the G1 group is younger than the G2 and G3 which has a higher body weight, increased BMI, WC and higher SBP. The G3 has a higher DBP to G1 and G2. Weight, BMI, WC and SBP were significantly different among the groups, and were all higher in G3 than the other groups. Height was not different among groups and DBP was significantly greater in G3. With respect to biochemical determinations total cholesterol did not differ among groups; HDL-cholesterol was lower in G3 in comparison with the other groups; and LDL-cholesterol showed increased levels in G2 and G3 compared withG1. Triglycerides were higher in G2 and G3 than in G1. The glycemia variable also differed among the groups, being higher in G3.
Table1. Anthropometric data, blood pressure and plasmatic biochemistry profile in G1, G2 and G3.
Variable G1 (n=36) G2 (n=21) G3 (n=23)
Age (years) 27.08 ± 4.69 a 33.76 ± 8.54 b 35.13 ± 8.57 b
Weight (kg) 55.49 ± 5.01 a 75.25 ± 6.95 b 95.80 ± 21.04 c
Height (m) 1.62 ± 0.05 a 1.65 ± 0.07 a 1.63 ± 0.07 a
BMI (kg/m2) 21.10 ± 1.67 a 27.69 ± 1.76 b 36.10 ± 7.34 c
WC (cm) 70.38 ± 5.47 a 89.17 ± 6.66 b 108.93 ± 17.27 c
SBP (mmHg) 109.17 ± 8.74 a 116.19 ± 9.73 b 126.09 ± 11.58 c
DBP (mmHg) 71.67 ± 7.75 a 76.19 ± 6.50 a 84.35 ± 7.12 b
Cholesterol (mg/dL) 184.56 ± 31.48 a 203.71 ± 30.90 a 198.04 ± 24.94 a
HDL-cholesterol (mg/dL) 68.08 ± 16.94 a 61.43 ± 15.00 a 46.00 ± 10.74 b
LDL-cholesterol (mg/dL) 98.64 ± 31.83 a 117.35 ± 36.27 ab 122.30 ± 26.06 b
Triglycerides(mg/dL) 88.39 ± 31.12 a 122.29 ± 63.34 b 148.70 ± 59.65 b
Glucose (mg/dL) 73.19 ± 4.71 a 78.95 ± 6.78 b 85.50 ± 7.66 c
G1= control group, G2= BMI 25 kg/m² without metabolic syndrome, G3= BMI 25 kg/m² with metabolic syndrome, BMI = body mass index, WC waist circumference, SBP = systolic blood pressure, DBP = diastolic blood pressure. Results are expressed as means and standard deviations. Means followed by different letter superscripts differ significantly among groups (ANOVA followed by Tukey’s test at p = 0.05).
Oxidative stress biomarker and DNA damage
the G3 was higher than the control group. The TAP was higher in G3, but did not differ from G2. MDA was also higher in G3, and not different from G2.
Table 2. DNA damage and oxidative stress in G1, G2 and G3.
Variable G1 (n=36) G2 (n=21) G3 (n=23)
DNA damage (%) ** 49.92 ± 9.01a 76.71 ± 13.33b 76.09 ± 9.85b
Oxidative damage to purines (%)** 60.82 ± 10.27 a 81.42 ± 11.28 b 76.72 ± 9.94 b
Oxidative damage to pyrimidines (%)** 54.16 ± 10.56 a 84.84 ± 4.65 b 71.75 ± 10.72 c
TAP * 37.76 ± 12.36 a 44.03 ± 14.42 ab 51.26 ± 10.07 b
MDA (umol/L)* 12.65 ± 8,42 a 34.47 ± 17.96 b 41.18 ± 20.0b
G1= control group, G2= BMI 25 kg/m² without metabolic syndrome, G3= BMI 25 kg/m² with metabolic syndrome, TAP= total antioxidant capacity, MDA = malondialdehyde. Results are expressed as mean and standard deviation. Means followed by different letter superscripts differ at a significance level of p = 0.05. ** Generalized linear model with gamma distribution followed by Wald multiple comparison tests. * ANOVA followed by Tukey's multiple comparison tests.
Macronutrients intake
Dietary intake of macronutrients did not differ among groups, except for protein intake, which was greater in G3 (Table 3).
Table 3. Dietary intake of macronutrients in G1, G2 and G3.
Variable G1 (n=36) G2 (n=21) G3 (n=23)
Carbohydrate (g) 206.74 ± 76.20 a 214.76 ± 80.74 a 207.60 ± 64.25 a
Cholesterol (mg) 176.54 ± 90.25 a 183.65 ± 76.00 a 194.75 ± 117.35 a
Fiber (g) 14.11 ± 6.67 a 12.20 ± 5.03 a 11.79 ± 3.84 a
Monounsaturated fat (g) 13.39 ± 6.64 a 14.31 ± 7.13 a 14.12 ± 6.46 a
Polyunsaturated fat (g) 9.89 ± 5.19 a 9.90 ± 9.05 a 8.89 ± 4.03 a
Saturated fat (g) 13.15 ± 7.17 a 14.34 ± 6.30 a 12.67 ± 6.03 a
Total fat (g) 59.36 ± 19.36 a 65.60 ± 30.70 a 56.98 ± 20.88 a
Protein (g) 70.72 ± 20.32 a 75.31± 20.91 ab 105.19 ± 133.14 b
G1= control group, G2= BMI 25 kg/m² without metabolic syndrome, G3= BMI 25 kg/m² with metabolic syndrome. Results are expressed as means with standard deviations. Means followed by the same letter do not differ significantly (ANOVA followed by Tukey’s test at p = 0.05).
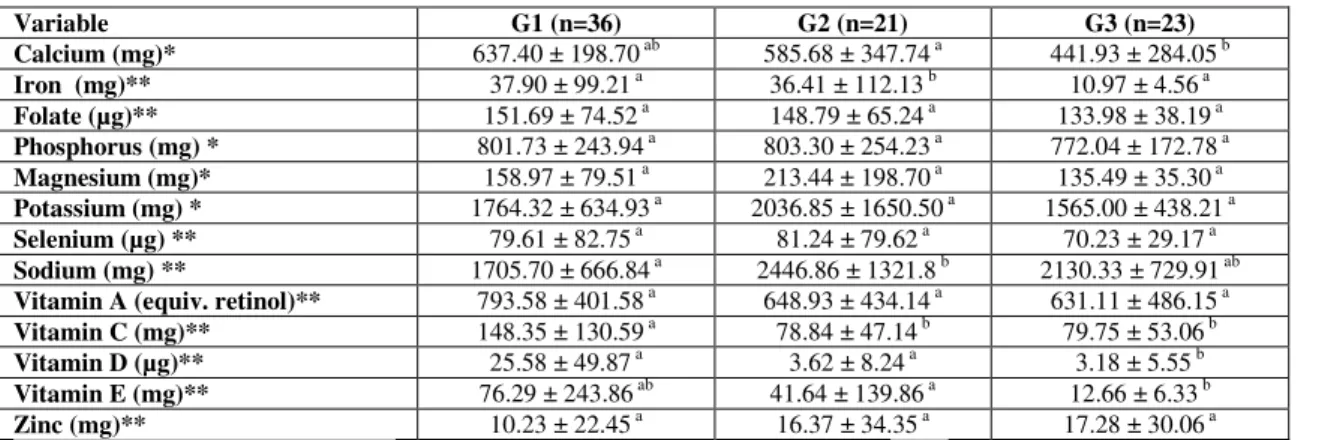
Micronutrients intake
Table 4. Dietary intake of micronutrients in G1, G2 and G3.
Variable G1 (n=36) G2 (n=21) G3 (n=23)
Calcium (mg)* 637.40 ± 198.70 ab 585.68 ± 347.74 a 441.93 ± 284.05 b
Iron (mg)** 37.90 ± 99.21 a 36.41 ± 112.13 b 10.97 ± 4.56 a
Folate (µg)** 151.69 ± 74.52 a 148.79 ± 65.24 a 133.98 ± 38.19 a
Phosphorus (mg) * 801.73 ± 243.94 a 803.30 ± 254.23 a 772.04 ± 172.78 a
Magnesium (mg)* 158.97 ± 79.51 a 213.44 ± 198.70 a 135.49 ± 35.30 a
Potassium (mg) * 1764.32 ± 634.93 a 2036.85 ± 1650.50 a 1565.00 ± 438.21 a
Selenium (µg) ** 79.61 ± 82.75 a 81.24 ± 79.62 a 70.23 ± 29.17 a
Sodium (mg) ** 1705.70 ± 666.84 a 2446.86 ± 1321.8 b 2130.33 ± 729.91 ab
Vitamin A (equiv. retinol)** 793.58 ± 401.58 a 648.93 ± 434.14 a 631.11 ± 486.15 a
Vitamin C (mg)** 148.35 ± 130.59 a 78.84 ± 47.14 b 79.75 ± 53.06 b
Vitamin D (µg)** 25.58 ± 49.87 a 3.62 ± 8.24 a 3.18 ± 5.55 b
Vitamin E (mg)** 76.29 ± 243.86 ab 41.64 ± 139.86 a 12.66 ± 6.33 b
Zinc (mg)** 10.23 ± 22.45 a 16.37 ± 34.35 a 17.28 ± 30.06 a
G1= control group, G2= BMI 25 kg/m² without metabolic syndrome, G3= BMI 25 kg/m² with metabolic syndrome. Results are expressed as means with standard deviations. * ANOVA followed by Tukey’s multiple comparison test ** Generalized linear model with gamma distribution followed by Wald multiple comparison test. Means followed by different letter superscripts differ significantly at p = 0.05.
Antioxiants concentration in plasma
The amounts of antioxidants such as carotenoids, -tocopherol, retinol and uric acid in plasma of three groups of women are shown in Table 6. There was no difference among groups in plasma concentrations of lutein, lycopene and -tocopherol. G3 had lower plasma concentrations of cryptoxanthin and beta-carotene compared to G1 which had higher plasma concentrations of -carotene. Uric acid concentrations increased across the groups, with lowest concentrations in G1 and highest concentrations in G3. Plasma retinol was higher in G3, differing only from G2 (Table 5).
Table 5: Plasma levels of carotenoids, -tocopherol, uric acid and retinol in G1, G2 and G3.
Variable G1 (n=36) G2 (n=21) G3 (n=23)
Lutein (µg/dL) 8.35 ± 6.13 a 5.13 ± 3.10 a 7.72 ± 6.54 a
Cryptoxanthin (µg/dL) 18.86 ± 18.42 a 10.15 ± 9.18 ab 7.86 ± 8.45 b
-carotene (µg/dL) 5.75 ± 4.57 b 2.63 ± 1.49 a 2.76 ± 1.69 a
-carotene (µg/dL) 12.24 ± 11.53 a 6.32 ± 3.99 ab 5.22 ± 3.36 b
Lycopene (µg/dL) 5.87 ± 6.94 a 6.09 ± 5.26 a 6.06 ± 5.86 a
-tocopherol (µg/dL) 491.26 ± 254.46 a 461.93 ± 241.79 a 625.69 ± 255.47 a
Uric acid (mg/dL) 3.75 ± 0.77 a 4.39 ± 1.09 b 5.32 ± 1.14 c
Retinol (µg/dL) 80.20 ± 34.57 ab 68.40 ± 29.57 a 106.18 ± 76.86 b
Relation between DNA damage, consumption of macro- and micronutrients and
plasmatic variants
There was a positive correlation between the consumption of sodium and protein and DNA damage (Table 6). Women who consumed the greatest amount of these nutrients had greater DNA damage. There was a negative correlation between polyunsaturated fat intake, plasma levels of -carotene and DNA damage (Table 6).
Table 6. Final linear regression model relating DNA damage with consumption of macro- and micronutrients and plasmatic variants.
Variable Estimate EP P – value
Intercept 57.67351 4.83736 < 0.0001
- carotene (µg/dL) -1.13616 0.45101 0.0139
Polyunsaturated fat (g) -1.16142 0.31356 0.0004
Protein (g) 0.05391 0.02171 0.0153
Sodium (mg) 0.00898 0.00206 < 0.0001
Relation between BMI and plasmatic variants
There was a negative correlation between BMI and vitamin D intake and plasma -carotene levels, and a positive correlation between BMI and plasma levels of retinol (Table 7).
Table 7. Final linear regression model relating BMI with consumption of micronutrients and plasmatic variants.
Variable Estimate EP P – value
Intercept 26.18853 1.74965 < 0.0001
- carotene (µg/dL) -0.63645 0.20538 0.0027
Vitamin D (µg) -0.05532 0.02072 0.0093
Retinol (µg/dL) 0.05065 0.01455 0.0008
Discussion
generally aggravate OS and damage (28, 29). Karbownik-Lewinska and collaborators (30) found that the concentration of 8-oxo-7,8-dihydro-2'-deoxyguanosine (8-oxodG) in peripheral blood lymphocytes in overweight and obese patients was an indicator of DNA damage. Further, there was a positive correlation with BMI, WC and triglycerides. These data are consistent with our study, where we observed the greatest DNA damage in women with higher BMI, WC and triglycerides.
We observed no differences in macronutrient intake among the groups, except that women with MetS (G3) had a higher protein intake than the control group (G1); however, consumption by G2 group did not differ from G1 or G3. The literature shows that subjects with MetS consume a large amount of protein, primarily in the form of meat (31, 32). We also found high sodium consumption in G2 and G3. Other studies that have analyzed the sodium intake in overweight and obese people observed the same result, confirming that this micronutrient is consumed in large quantities in this population (33, 34). This high consumption may be a factor in the development of hypertension, which is one of the features of MetS. We found that women of G2 and G3 ingested smaller amounts of vitamin E, D and calcium than women in G1. These data are consistent with several studies that have reported deficiency of these micronutrients in obese and overweight people (35-37).
observed in all groups that the higher the level of serum -carotene, the lower the damage to DNA, but not the damage to purine and pyrimidine bases. Therefore, we conclude that this carotenoid also has a protective effect for non-oxidative damage. The literature shows that carotenoid antioxidants can prevent OS and DNA damage (38, 39). We also observed the same protection ratio to DNA damage when the consumption of polyunsaturated fats increases. The main sources of omega-3 fatty acids are cold water fish and seafood (40) and omega-6 fatty acids are found in soy and sunflower oils and oilseeds (41). Their consumption has several advantages including helping to increase the levels of HDL-cholesterol and decrease LDL-cholesterol (41). They also prevent DNA damage (38). The literature is sparse regarding the association of obese individuals, consumption of n-3 and n-6 polyunsaturated fatty acids (PUFAs), and DNA damage. It is also reported that n-3 PUFAs have a protective role in autoimmune diseases, T2D, rheumatoid arthritis and cancer, while n-6 PUFAs have a pro-inflammatory effect (42). In addition, the same study (42) showed that one of these two fatty acids had a positive effect on the prevention of DNA damage in an experimental study of colon cancer.
respect to protein consumption, studies show that these can increase DNA damage by the presence of additives for their conservation (heterocyclic aromatic amines) (43). Thus, a diet rich in fruits and vegetables and reduced in processed foods can protect oxidative DNA damage (4).
Conclusion
We conclude that worsened nutritional status influences various parameters including metabolic and OS, and DNA damage. Diet quality (consumption of fruit and vegetables, intake of salt and fat) and BMI are the factors that most influenced changes in these parameters.
Acknowledgments
The authors wish to acknowledgments Bruno Luperini for his technical assistance in comet assay, FAPESP (11/08373-5) for financial support and Proof reading service by correcting the English. The authors’ contributions were as follows: L.C.T. and C.R.C. designed the research; L.C.T.; D.T.P.; F.V.F.; I.O.M.; M.E.L.N.; C.O.L.D.; S.K.C.; C.D.H.S.; V.S.N.; A.L.F. conducted the research; J.E.C. and C.R.C. analyzed the data; L.C.T. and C.R.C. wrote the paper.
Conflicts of Interest
The authors declare no conflict of interest.
References
1. Moratoya, E. E.; Carvalhaes, G. C.; Wander, A. E.; Almeida, L. M. M. C., Mudanças no padrão de consumo alimentar no Brasil e no mundo. Revista de Política Agrícola Ano XXII Jan./Fev./Mar. 2013, 1, 72-84.
2. Damms-Machado, A.; Weser, G.; Bischoff, S. C., Micronutrient deficiency in obese subjects undergoing low calorie diet. Nutr J 2012, 11, 34.
3. Al-Habsi, A.; Kilani, H., Lifestyles of Adult Omani Women: Cross-sectional study on physical activity and sedentary behaviour. Sultan Qaboos Univ Med J 2015, 15, (2), e257-65.
4. Prado, R. P.; dos Santos, B. F.; Pinto, C. L.; de Assis, K. R.; Salvadori, D. M.; Ladeira, M. S., Influence of diet on oxidative DNA damage, uracil misincorporation and DNA repair capability. Mutagenesis 2010, 25, (5), 483-7.
5. Clinical Practice Guidelines. In: International Diabetes Federation (IDF). Disponível em: http: // www.idf.org. Acesso em: 18 ago 2010.
7. Pollock, M. L.; Wilmore, J. H., Exercícios na Saúde e na Doença - Avaliação e Prescrição para Prevenção e Reabilitação 2ed.; MEDSI: Rio de Janeiro, 1993.
8. Sociedade Brasileira de Cardiologia. Sociedade Brasileira de Hipertensão. Sociedade Brasileira de Nefrologia. VI Diretrizes Brasileiras de Hipertensão. Arq Bras Cardiol 2010, 95 (1 supl. 1), 1-51.
9. Aldini, G.; Yeum, K. J.; Russell, R. M.; Krinsky, N. I., A method to measure the oxidizability of both the aqueous and lipid compartments of plasma. Free Radic Biol Med 2001, 31, (9), 1043-50.
10. Beretta, G.; Aldini, G.; Facino, R. M.; Russell, R. M.; Krinsky, N. I.; Yeum, K. J., Total antioxidant performance: a validated fluorescence assay for the measurement of plasma oxidizability. Anal Biochem 2006, 354, (2), 290-8.
11. Fukunaga, K.; Yoshida, M.; Nakazono, N., A simple, rapid, highly sensitive and reproducible quantification method for plasma malondialdehyde by high-performance liquid chromatography. Biomed Chromatogr 1998, 12, (5), 300-3.
12. Collins, A. R.; Gedik, C. M.; Olmedilla, B.; Southon, S.; Bellizzi, M., Oxidative DNA damage measured in human lymphocytes: large differences between sexes and between countries, and correlations with heart disease mortality rates. FASEB J 1998, 12, 1397-400.
13. Yeum, K. J.; Taylor, A.; Tang, G.; Russell, R. M., Measurement of carotenoids, retinoids, and tocopherols in human lenses. Invest Ophthalmol Vis Sci 1995, 36, (13), 2756-61.
14. Esteves, E. A.; Monteiro, J. B. R., Sistema de suporte à avaliação nutricional e prescrição de dietas. Dietpro [programa computacional], 4.0; Viçosa, MG. 2002.
15. Knoops, K. T.; de Groot, L. C.; Kromhout, D.; Perrin, A. E.; Moreiras-Varela, O.; Menotti, A.; van Staveren, W. A., Mediterranean diet, lifestyle factors, and 10-year mortality in elderly European men and women: the HALE project. JAMA 2004, 292, (12), 1433-9.
16. Dehghan, M.; Mente, A.; Teo, K. K.; Gao, P.; Sleight, P.; Dagenais, G.; Avezum, A.; Probstfield, J. L.; Dans, T.; Yusuf, S., Relationship between healthy diet and risk of cardiovascular disease among patients on drug therapies for secondary prevention: a prospective cohort study of 31 546 high-risk individuals from 40 countries. Circulation 2012, 126, (23), 2705-12.
17. Birch, L. L.; Davison, K. K., Family environmental factors influencing the developing behavioral controls of food intake and childhood overweight. Pediatr Clin North Am 2001, 48, (4), 893-907.
18. Nguyen, T.; Lau, D. C., The obesity epidemic and its impact on hypertension. Can J Cardiol 2012, 28, (3), 326-33.
19. Weiss, R.; Dziura, J.; Burgert, T. S.; Tamborlane, W. V.; Taksali, S. E.; Yeckel, C. W.; Allen, K.; Lopes, M.; Savoye, M.; Morrison, J.; Sherwin, R. S.; Caprio, S., Obesity and the metabolic syndrome in children and adolescents. N Engl J Med 2004, 350, (23), 2362-74.
20. Goldberg, I. J.; Eckel, R. H.; McPherson, R., Triglycerides and heart disease: still a hypothesis? Arterioscler Thromb Vasc Biol 2011, 31, (8), 1716-25.
21. Skalicky, J.; Muzakova, V.; Kandar, R.; Meloun, M.; Rousar, T.; Palicka, V., Evaluation of oxidative stress and inflammation in obese adults with metabolic syndrome. Clin Chem Lab Med 2008, 46, (4), 499-505.
23. Johnson, R. J.; Segal, M. S.; Sautin, Y., Potential role of sugar (fructose) in the epidemic of hypertension, obesity and the metabolic syndrome, diabetes, kidney disease, and cardiovascular disease. Am J Clin Nutr 2007, 86, 899-906.
24. Glantzounis, G. K.; Tsimoyiannis, E. C.; Kappas, A. M.; Galaris, D. A., Uric acid and oxidative stress. Curr Pharm Des 2005, 11, (32), 4145-51.
25. Yu, Z. F.; Bruce-Keller, A. J.; Goodman, Y.; Mattson, M. P., Uric acid protects neurons against excitotoxic and metabolic insults in cell culture, and against focal ischemic brain injury in vivo. J Neurosci Res 1998, 53, 613-25.
26. Simao, A. N.; Dichi, J. B.; Barbosa, D. S.; Cecchini, R.; Dichi, I., Influence of uric acid and gamma-glutamyltransferase on total antioxidant capacity and oxidative stress in patients with metabolic syndrome. Nutrition 2008, 24, (7-8), 675-81.
27. Venturini, D.; Simao, A. N.; Scripes, N. A.; Bahls, L. D.; Melo, P. A.; Belinetti, F. M.; Lozovoy, M. A.; Dichi, I., Evaluation of oxidative stress in overweight subjects with or without metabolic syndrome. Obesity (Silver Spring) 2012, 20(12), 2361-6. 28. Pilger, A.; Germadnik, D.; Riedel, K.; Meger-Kossien, I.; Scherer, G.; Rudiger, H. W., Longitudinal study of urinary 8-hydroxy-2'-deoxyguanosine excretion in healthy adults. Free Radic Res 2001, 35, (3), 273-80.
29. Collins, A. R.; Raslova, K.; Somorovska, M.; Petrovska, H.; Ondrusova, A.; Vohnout, B.; Fabry, R.; Dusinska, M., DNA damage in diabetes: correlation with a clinical marker. Free Radic Biol Med 1998, 25, (3), 373-7.
30. Karbownik-Lewinska, M.; Szosland, J.; Kokoszko-Bilska, A.; Stepniak, J.; Zasada, K.; Gesing, A.; Lewinski, A., Direct contribution of obesity to oxidative damage to macromolecules. Neuro Endocrinol Lett 2012, 33, (4), 453-61.
31. Bernstein, A. M.; Sun, Q.; Hu, F. B.; Stampfer, M. J.; Manson, J. E.; Willett, W. C., Major dietary protein sources and risk of coronary heart disease in women. Circulation 2010, 122, (9), 876-83.
32. Ley, S. H.; Sun, Q.; Willett, W. C.; Eliassen, A. H.; Wu, K.; Pan, A.; Grodstein, F.; Hu, F. B., Associations between red meat intake and biomarkers of inflammation and glucose metabolism in women. Am J Clin Nutr 2013, 1-9.
33. Chen, J.; Gu, D.; Huang, J.; Rao, D. C.; Jaquish, C. E.; Hixson, J. E.; Chen, C. S.; Lu, F.; Hu, D.; Rice, T.; Kelly, T. N.; Hamm, L. L.; Whelton, P. K.; He, J., Metabolic syndrome and salt sensitivity of blood pressure in non-diabetic people in China: a dietary intervention study. Lancet 2009, 373, (9666), 829-35.
34. Kim, B. K.; Lim, Y. H.; Kim, S. G.; Kim, Y. M.; Shin, J., Relationship between sodium intake and blood pressure according to metabolic syndrome status in the Korean National Health and Nutrition Examination Survey Blood Press Monit 2012, 12, 120-7. 35. Kamycheva, E.; Joakimsen, R. M.; Jorde, R., Intakes of calcium and vitamin d predict body mass index in the population of Northern Norway. J Nutr 2003, 133, (1), 102-6.
36. Ernst, B.; Thurnheer, M.; Schmid, S. M.; Schultes, B., Evidence for the necessity to systematically assess micronutrient status prior to bariatric surgery. Obes Surg 2009, 19, (1), 66-73.
37. Wannamethee, S. G.; Lowe, G. D.; Rumley, A.; Bruckdorfer, K. R.; Whincup, P. H., Associations of vitamin C status, fruit and vegetable intakes, and markers of inflammation and hemostasis. Am J Clin Nutr 2006, 83, (3), 567-74; quiz 726-7.
39. Mullner, E.; Brath, H.; Toferer, D.; Adrigan, S.; Bulla, M. T.; Stieglmayer, R.; Wallner, M.; Marek, R.; Wagner, K. H., Genome damage in peripheral blood lymphocytes of diabetic and non-diabetic individuals after intervention with vegetables and plant oil. Mutagenesis 2013, 28, (2), 205-11.
40. Kris-Etherton, P. M.; Harris, W. S.; Appel, L. J., Fish consumption, fish oil, omega-3 fatty acids, and cardiovascular disease. Arterioscler Thromb Vasc Biol 2003, 23, (2), e20-30.
41. Martin, C. A.; Almeida, V. V.; Ruiz, M. R.; Visentainer, J. E. L.; Matshushita, M.; Souza, N. E.; Visentainer, J. V., Ácidos graxos poliinsaturados ômega-3 e ômega-6: importância e ocorrência em alimentos. Rev. Nutr. (Campinas) Nov./Dec. 2006, 19(6). 42. Sarotra, P.; Kansal, S.; Sandhir, R.; Agnihotri, N., Chemopreventive effect of different ratios of fish oil and corn oil on prognostic markers, DNA damage and cell cycle in colon carcinogenesis. Eur J Cancer Prev 2012, 21, (2), 147-54.
43. Ferguson, L. R., Natural and human-made mutagens and carcinogens in the human diet. Toxicology 2002, 181-182, 79-82.
44. Taylor, E. N.; Curhan, G. C., Body size and 24-hour urine composition. Am J Kidney Dis 2006, 48, (6), 905-15.
45. Hoffmann, I. S.; Cubeddu, L. X., Salt and the metabolic syndrome. Nutr Metab Cardiovasc Dis 2009, 19, (2), 123-8.
46. Fellner, R. C.; Cook, A. K.; O'Connor, P. M.; Zhang, S.; Pollock, D. M.; Inscho, E. W., High-salt diet blunts renal autoregulation by a reactive oxygen species-dependent mechanism. Am J Physiol Renal Physiol 2014, 307, (1), F33-40.
47. Yu, A.; Kim, J.; Kwon, O.; Oh, S. Y.; Kim, J.; Yang, Y. J., The association between serum 25-hydroxyvitamin d concentration and consumption frequencies of vitamin d food sources in korean adolescents. Clin Nutr Res 2013, 2, 107-14.
48. Mansour, A.; Ahadi, Z.; Qorbani, M.; Hosseini, S., Association between dietary intake and seasonal variations in postmenopausal women. J Diabetes Metab Disord
2014, 13, 1-6.
49. Zhao, L. M.; Tian, X. Q.; Ge, J. P.; Xu, Y. C., Vitamin D intake and type 2 diabetes risk: a meta-analysis of prospective cohort studies. Afr Health Sci 2013, 13, (4), 1130-8.
50. Dwyer, J. T.; III, V. L. F.; Clemens, R. A.; Schmidt, D. B.; Freedman, M. R., Symposium: Is “Processed” a 4-letter word? The Role of Processed Foods in Achieving Dietary Guidelines and Nutrient Recommendations in the US Is “Processed” a Four-Letter Word? The Role of Processed Foods in Achieving Dietary Guidelines and Nutrient Recommendations. Adv Nutr 2012, 3 536-48.
51. Ben Slama, F.; Boujmil, A.; Dekhil, I.; Trimeche, A.; Gaouar, C.; Ben Rayana, M. C.; Achour, N.; Zouari, B.; Achour, A.; Bel Hadj, O., [Vitamins A, E and leptin in obese and non-insulin-dependent diabetes]. Tunis Med 2009, 87, (11), 726-30.
52. Singh, R. B.; Ghosh, S.; Niaz, M. A.; Singh, R.; Beegum, R.; Chibo, H.; Shoumin, Z.; Postiglione, A., Dietary intake, plasma levels of antioxidant vitamins, and oxidative stress in relation to coronary artery disease in elderly subjects. Am J Cardiol
1995, 76, (17), 1233-8.