Rev Bras
Cineantropom
Hum
DOI: http://dx.doi.org/10.5007/1980-0037.2018v20n3p258
original article
Factors associated to mortality in adults and
elderly residents in the city of Rio Claro - SP:
a cohort study
Fatores associados à mortalidade de adultos e idosos
residentes no município de Rio Claro - SP: um estudo de
coorte
Ana Elisa Messetti Christofoletti¹ Guilherme Stefano Goulardins¹ Diego Orcioli-Silva¹
Deisy Terumi Ueno¹ Inaian Pignatti Teixeira² Eduardo Kokubun¹ Priscila Missaki Nakamura¹,³
Abstract – The factors associated to mortality may be distinct in each region and iden-tifying them can contribute to develop public policies related to health promotion and prevention. Thus, the aims of this study were verify the factors associated with mortality and the influence of physical activity on the mortality rates of adults and elderly living in the city of Rio Claro, SP. The first moment of the cohort study was conducted in 2008 and the second in 2014. Participants answered questions about socio-demographic level, level of physical activity (PA), health and eating habits variables. In the case of individuals who were not found after three attempts, neighbors and relatives were questioned about whether they had the contact with that person or if he/she had passed away. To analyze factor associated to mortality, three independent Logistic Regression models for complex samples were used (total PA; commuting PA; leisure PA), as well as the SPSS software version 21.0, considering p<0.05. The variables that were associated with mortality in the three models were: “male sex”, “elderly” and “poor/very poor health perception”. Further, individuals who spent 150 min/week of physical activity did not showed any protection against mortality when compared with those who did not achieve the recommendation. These results can guide public policies, mainly, to the health of the elderly, people with poor health perception and men.
Key words: Adults; Aged; Brazil; Mortality.
Resumo – Os fatores associados à mortalidade podem ser distintos em cada região e identificá-los contribuem para o desenvolvimento de políticas públicas voltadas à promoção e prevenção de saúde. Assim, os objetivos do estudo foram verificar fatores associados à mortalidade e analisar a influência da atividade física na mortalidade em adultos e idosos, residentes no município de Rio Claro - SP. Foi realizado um estudo de coorte em que o primeiro momento ocorreu no ano de 2008 e o segundo em 2014. Os participantes responderam questões sociodemográficas, nível de atividade física (NAF), variáveis de saúde e hábitos alimentares. No caso dos sujeitos que não foram encontrados após três tentativas, vizinhos e parentes foram questionados se tinham o contato daquela pessoa ou se a mesma havia falecido. Para analisar os fatores associados à mortalidade, foram utilizados três modelos de Regressão Logística para amostras complexas independentes (NAF total; NAF no transporte; NAF no lazer), por meio do programa SPSS versão 21.0, adotado um p<0,05. As variáveis que tiveram associação com a mortalidade nos três modelos foram: “sexo masculino”, “idoso” e “percepção de saúde ruim/muito ruim”. Além disso, não houve uma proteção para pessoas que praticavam 150 minutos ou mais de atividade física por semana quando comparados com indivíduos insuficientemente ativos e inativos. Estes achados podem nortear políticas públicas voltadas, principalmente, para a saúde de idosos, pessoas com
1 São Paulo State University. Institute of Biosciences. Postgradu-ate Program in Science Movement. Department of Physical Education. Rio Claro, SP. Brazil
2 University of São Paulo. Graduate Program in Transport Engineering. São Carlos, SP. Brazil.
3 Federal Institute of Education, Science and Technology of Southern Minas Gerais. Muzambinho, MG. Brazil.
INTRODUCTION
Mortality can be considered an indicator of living conditions and de-velopment1,2, in which possible risk factors in a given population can be
identified. These factors can be mutable and/or treatable, such as malnutri-tion, lack of basic sanitamalnutri-tion, alcohol consumpmalnutri-tion, smoking, inadequate nutrition, physical inactivity, high blood pressure, high body mass index, cholesterol and blood glucose. Thus, it becomes important to understand and investigate health conditions and new forms of prevention and health promotion3 to reduce the mortality rate of a region.
Data from the World Bank Group4 showed low mortality rate due to
chronic and non-communicable diseases in adults from high-income coun-tries, with Iceland (8%) having the lowest, and medium- and low-income countries with higher mortality rates, with Papua New Guinea (36%) hav-ing the highest rate. In Brazil, the mortality rate among adults is 14.7%5.
Several studies have sought to understand and investigate new forms of prevention and health promotion to reduce mortality rates3 and within
this perspective, regular practice of physical activity has been an important ally in reducing mortality6. Lee et al.7 in a systematic review, showed that
regular practice of physical activity is associated with improved health and reduced mortality from cardiovascular diseases, type 2 diabetes, certain cancers, hypertension, obesity, depression, and other chronic diseases. However, studies involving the level of physical activity and mortality rate should consider unmodified factors, such as age and sex.
The prevalence of physical inactivity increases with age8 and the
protective effect of physical activity for mortality is sex dependent, be-ing beneficial for both, especially for men9. In this way, a study on the
factors associated with mortality of adults and elderly in medium-sized municipalities becomes important, since different regions have different characteristics and behaviors10. The findings of this study may contribute
to future public policies in order to minimize the number of deaths, con-sidering that the mortality rate in 2014 corresponds to approximately 7.46 (deaths/thousand inhabitants)11.
In view of the above, the aims of the present study were: i) to describe the mortality rate and its associated factors in a 6-year interval; and ii) to analyze the influence of physical activity on mortality in adults and elderly living in the municipality of Rio Claro. The hypotheses of this study are: i) the highest number of deaths is related to inadequate lifestyle (smok-ing, physically inactive, among others) and ii) regular practice of physical activity presents a protective factor to mortality.
METHODOLOGICAL PROCEDURES
The study was carried out in the city of Rio Claro – SP12 (urban area) with
region of Campinas, SP, with territorial area of 498,422 km², population density of 373.69 (pop/km²) and population estimated in 2016 of 201,473 thousand inhabitants, Human Development Index of 0.80312 and per capita income of R$ 1,049.1613.
The present cohort study began in 2008 and was developed by the Department of Physical Activity, Sport and Health (NAFES) and the Laboratory of Physical Activity and Aging (LAFE), belonging to the “Júlio de Mesquita Filho” State University of São Paulo - Rio Claro - SP, with support from the Municipal Health Department of Rio Claro and Regional Council of Physical Education (CREF4/SP).
For sample size calculation, sample error of 5% and prevalence of 50% of physical inactivity were considered in the adult population of Rio Claro - SP. The sample estimate was of 764 participants; however, as the sample was selected by clusters, a design effect (deff) equal to 2 was adopted, doubling the number of participants, totaling 1,528 participants: n= (N.z².P.(1-P))/(d².(N-1)+z².P(1-P)). Where n = sample size, N = population of Rio Claro - SP aged 20 years or older, approximately 128,000 people14,
z = significance level (established in 95%), P = expected prevalence of the phenomenon to be investigated (based on previous studies and aiming to obtain the largest possible number of participants, was defined as 50%, i.e., 0.5), and d = tolerable sample error (defined as 5%).
The random sample process occurred as follows: the city of Rio Claro - SP contains 200 census tracts, so 100 odd sectors were selected aiming at reaching the sample number with a balanced spatial distribution. The exclusion criteria of census tracts were: a) to be exclusively an industrial area; b) prison area; c) rural area and d) hospital and nursing home areas. Thus, three odd sectors were excluded, as these were hospitals or nursing homes, so the even sectors 50, 100 and 150 were included due to their equidistances to compose the 100 sectors. Then, eight households were drawn from each sector, totaling 800 households. All residents 20 years of age or older were interviewed, except individuals with severe and intel-lectual motor disabilities.
In order to collect data, questionnaires were used on personal and sociodemographic issues (Brazilian Association of Research Companies - ABEP)15, International Physical Activity Questionnaire (IPAQ - long
version)16 translated into Portuguese to verify the level of physical activity,
quality of life questionnaire (SF-36)17, questionnaires of barriers to physical
activity18 and questionnaire on nutrition (INCA)19. All questionnaires used
have a validation study for the Brazilian population.
undergraduate Physical Education student, all familiar with the subject. After the end of the training course, data collections began, in which both interviewers and students involved in the research divided the sectors for better logistics. In 2008, questionnaires were applied through paper and in 2014, collection was done through tablets and postgraduate students were responsible for training the interviewers in the use of this tool. The use of tablets has reduced the collection time from 60 to 38.9 minutes, as well as enabling fast data tabulation and paper economy.
Dependent variable
In 2014, all cases confirmed by neighbors, friends or relatives who died were recorded as deaths. In addition, these people were questioned about the cause of death. After confirmation of the death and its cause, the in-terviewer completed the loss questionnaire where for the question ”cause of loss”, “death” alternative was selected. Thus, as a dependent variable, all-cause mortality was adopted.
Independent variables
The characteristics of the subjects who died were obtained through self-reported questions about sex (male and female), age (60 years or more, 40 to 59 years, 20 to 39 years), weight and height for the calculation of the Body Mass Index, considering: malnutrition (<18.5 kg/m²), eutrophic (18.5 to 24.9 kg/m²), overweight (25 to 29.9 kg/m²) and obese (≥ 30 kg/m²)20,
marital status (widowed/divorced, married, single), perception of current health status (poor, very poor, good, very good and excellent), smoking (smoker; not smoker, former smoker), schooling (complete high school / higher education, incomplete high school, up to 4th grade), economic
class (A, B, C, D and E) (ABEP), level of physical activity, considering separately total PA, commuting and leisure, classified as active (> 150 min/ wk), insufficiently active (10 to 149 min/wk) and inactive (<10 min/wk) (IPAQ – long version). For the total PA, all physical activities performed in the four domains (work, domestic, leisure and commuting) were con-sidered. It was considered vigorous physical activity, those that require a great physical effort, causing the individual to breathe much stronger than the resting levels16.
Statistical analysis
All statistical analyses were performed using the Statistical Package for the Social Sciences (SPSS®) software version 21.0 and adopting p <0.05. A descriptive analysis of data was performed (absolute frequency, relative and their respective 95% confidence intervals).
variables. After this, data from the present sample were compared with the 2010 Census data, and sample weighting values were created. Finally, after the creation of groupings and the sample weighting values, a Logistic Regression analysis was performed for complex samples.
To analyze factors associated with mortality, mortality was consid-ered as outcome and gender, age, BMI, marital status, health perception, smoking, schooling, economic class and physical activity were considered as exposure.
Specifically in relation to physical activity, three independent models were elaborated: a) total PA, b) commuting PA and c) leisure PA. These last two models were created to evaluate the specific effects of physical activity on commuting and leisure, respectively. Thus, it was necessary to correct for physical activities performed in the other three domains. For example, in the commuting PA model, specific physical activity time was recorded in the commuting domain and categorized into three groups: active (> 150 min/wk), insufficiently active (10 to 149 min/wk) and inactive (< 10 min/ wk). In order to isolate the effect of only physical activity in the commut-ing domain, the commutcommut-ing PA model was adjusted by physical activity performed in the other three domains (work, domestic and leisure). The analysis for leisure PA was performed in an analogous way.
Ethical aspects
The research was approved by the Research Ethics Committee Involving Human Beings of the Institute of Biosciences of the State University of São Paulo - UNESP, Campus of Rio Claro (process: 8592).
RESULTS
The sample studied in 2008 and 2014 is described in Table 1. In the year 2014, after the attempt of contact with the 1,588 participants, 693 subjects were located and information was collected, being recorded 895 sample losses, among them 81 deaths. This result indicates a mortality of 10.5% in 6 years of follow-up, and for females this value was 8.6% and for males 13.4%.
Regarding factors associated with mortality, the results indicate that, regardless of proposed model (total PA, commuting PA and leisure PA), men and older adults presented higher mortality risks. Higher mortality risk was also identified for individuals with poor/very poor health percep-tion when compared with the group with good/very good/excellent health perception in the total PA and leisure PA models (Table 3). Moreover, in the leisure PA model, people aged 40-59 years presented higher risk when compared to those aged 20-39 years.
Table 1. Socio-demographic characteristics, level of physical activity, health perception and smoking habits of the adult population of Rio Claro in the two research moments.
Characteristics
2008 2014
n total = 1,588 n total = 693
n % n %
Sex Female 918 57.8 430 62
Male 670 42.2 263 38
Age 20 to 39 years 638 40.2 134 19.3
40 to 59 years 593 37.4 289 41.7
60 years or older 356 22.4 270 39
Malnutrition 21 3.1 12 1.8
BMI Eutrophic 292 43.1 239 35.3
Overweight 235 34.7 241 35.6
Obese 130 19.2 185 27.3
Marital status Married 999 62.9 459 66.2
Divorced / Widowed 283 17.8 137 19.8
Single 306 19.3 97 14
Schooling Up to 4th grade 586 36.9 273 39.4
Incomplete high school 296 18.7 105 15.2
Complete high school /higher education 705 44.4 315 45.5
Smoking Smoker 110 15.9 100 14.4
Former smoker 121 17.5 148 21.4
Not smoker 462 66.7 445 64.2
Health perception Excellent 175 11.5 450 64.9
Very good 249 16.4 83 12
Good 935 61.4 106 15.3
Poor 98 6.4 43 6.2
Very poor 10 0.7 9 1.3
Economic class D and E 280 18.1 29 4.3
C 728 47.2 289 42.8
A, B 535 34.7 358 53
Leisure PA >150 min/wk 414 26.1 196 28.3
10 to 149 min/wk 186 11.7 114 16.5
<10 min/wk 988 62.2 383 55.3
Commuting PA >150 min/wk 577 36.3 137 19.8
10 to 149 min/wk 546 34.4 308 44.4
<10 min/wk 465 29.3 248 35.8
Total PA >150 min/wk 414 26.1 593 85.6
10 to 149 min/wk 186 11.7 54 7.8
<10 min/wk 988 62.2 46 6.6
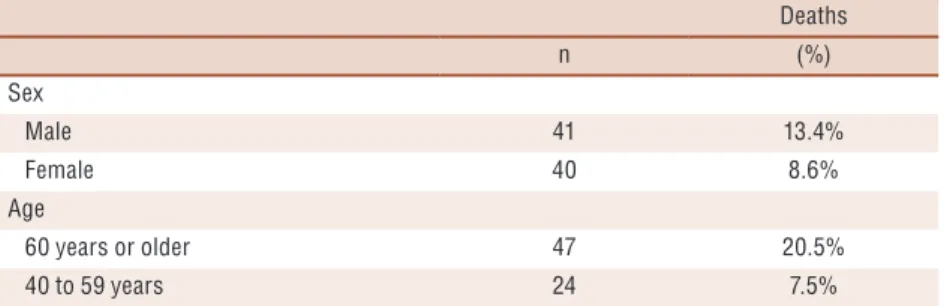
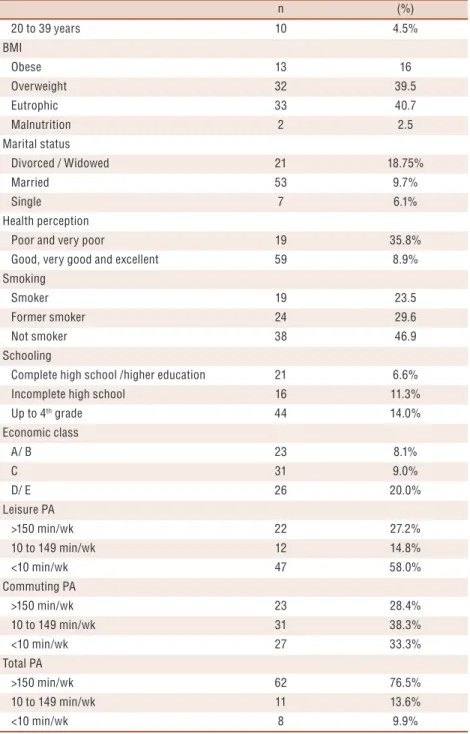
Table 2. Prevalence of deaths stratified by personal and sociodemographic characteristics in the
city of Rio Claro - SP.
Deaths
n (%)
Sex
Male 41 13.4%
Female 40 8.6%
Age
60 years or older 47 20.5%
Deaths
n (%)
20 to 39 years 10 4.5%
BMI
Obese 13 16
Overweight 32 39.5
Eutrophic 33 40.7
Malnutrition 2 2.5
Marital status
Divorced / Widowed 21 18.75%
Married 53 9.7%
Single 7 6.1%
Health perception
Poor and very poor 19 35.8%
Good, very good and excellent 59 8.9%
Smoking
Smoker 19 23.5
Former smoker 24 29.6
Not smoker 38 46.9
Schooling
Complete high school /higher education 21 6.6%
Incomplete high school 16 11.3%
Up to 4th grade 44 14.0%
Economic class
A/ B 23 8.1%
C 31 9.0%
D/ E 26 20.0%
Leisure PA
>150 min/wk 22 27.2%
10 to 149 min/wk 12 14.8%
<10 min/wk 47 58.0%
Commuting PA
>150 min/wk 23 28.4%
10 to 149 min/wk 31 38.3%
<10 min/wk 27 33.3%
Total PA
>150 min/wk 62 76.5%
10 to 149 min/wk 11 13.6%
<10 min/wk 8 9.9%
Table 3. Factors associated with mortality considering sociodemographic variables, health perception and level of physical activity
in all domains.
Total PA Commuting Leisure
OR 95% CI OR 95% CI OR 95% CI
Sex
Male 1.76 1.09 2.86 * 1.87 1.09 3.21 * 1.91 1.06 3.45 *
Female 1 1 1
Age
60 years or older 5.21 3.26 8.33 * 5.15 2.77 9.57 * 5.62 3.45 9.17 *
Total PA Commuting Leisure
OR 95% CI OR 95% CI OR 95% CI
40 to 59 years 1.42 0.90 2.23 1.45 0.90 2.35 1.60 1.04 2.45 *
20 to 39 years 1 1 1
BMI
Obese 2.74 0.25 29.55 2.58 0.24 27.19 2.77 0.26 29.29
Overweight 0.87 0.22 3.37 0.88 0.22 3.45 0.84 0.22 3.21
Eutrophic 1.25 0.60 2.58 1.20 0.58 2.51 1.11 0.57 2.17
Malnutrition 1 1 1
Marital status
Divorced /Widowed 0.39 0.04 3.80 0.36 0.04 3.41 0.30 0.02 3.73
Married 0.86 0.25 2.94 0.83 0.24 2.89 0.71 0.21 2.38
Single 1 1 1
Health perception
Poor and very poor 4.21 1.08 16.43 * 4.28 0.94 19.42 4.51 1.06 19.17 *
Good, very good and excellent
1 1 1
Smoking
Smoker 1.65 0.96 2.83 1.64 0.97 2.78 1.55 0.99 2.45
Former smoker 2.71 0.52 14.23 2.59 0.45 15.04 2.84 0.50 16.22
Not smoker 1 1 1
Schooling
Complete high school / higher education
0.68 0.28 1.63 0.67 0.28 1.61 0.81 0.33 2.00
Incomplete high school 1.30 0.40 4.26 1.37 0.46 4.04 1.66 0.64 4.29
Up to 4th grade 1 1 1
Economic class
A/ B 0.28 0.07 1.08 0.29 0.07 1.17 0.26 0.06 1.04
C 0.41 0.17 0.96 0.41 0.16 1.01 0.39 0.15 1.00
D/ E 1 1 1
Total PA
≥ 150 min/wk 0.70 0.18 2.70
De 10 to 149 min/wk 1.27 0.15 11.00
< 10 min/wk 1
Commuting PA #
≥ 150 min/wk 0.89 0.37 2.13
De 10 to 149 min/wk 1.10 0.63 1.92
< 10 min/wk 1
Leisure PA €
≥ 150 min/wk 2.67 0.75 9.51
De 10 to 149 min/wk 1.47 0.65 3.30
< 10 min/wk 1
* There was difference between groups, # - Adjusted for other physical activity domains, € - Adjusted for other physical activity domains.
DISCUSSION
The main findings showed that being male, having advanced and middle age and having poor health perception presented high mortality rates. Un-expectedly, there was no protection for those who practiced 150 minutes or more of physical activity per week when compared to insufficiently active and inactive individuals.
It is known that mortality is linked to several factors and being male is associated with higher prevalence of mortality (13.4%) when compared to women (8.6%). These results are compatible with study conducted by Brasil10, who indicates that noncommunicable diseases are predominant
in men (19.3%) when compared with women (5.4%), and the highest dif-ference occurs in the ages of 10 to 40 years. Another factor responsible for the premature death of men is alcohol intake, with males being the more prevalent (3.8%) when compared with females (0.7%), brown color / race and age between 50 and 59 years are the most susceptible groups10,21.
Moreover, mortality from traffic accidents is also more frequent among men (81.5%) than among women (18.5%)10.
Regarding age, mortality risk is higher with increasing years of life10,
which was confirmed in the present study. Being 60 years old or older represented 20.5% of cases of death, while being between 40 to 59 years old, represented 7.5% of cases and being between 20 to 39 years old only 4.5%. The literature is consistent in demonstrating that the aging process causes several physiological changes in the nervous, cognitive and muscu-loskeletal systems10. In addition, the aging process is also associated with
an increased risk of chronic conditions and diseases, such as cognitive decline, cardiovascular diseases, neurodegenerative diseases, and metabolic syndromes10. Thus, the association between these factors together with the
aging process increases the mortality rate in the elderly population. Also, poor health perception (poor/very poor) also presented a higher risk for mortality than people who considered their health to be good. This finding is consistent with the findings of Kaplan et al.22, who followed
2,512 middle-aged men from Kuopio, eastern Finland, and found that risk factors for mortality were substantially higher among participants who reported poor or very poor health perception. The study by Menec, Chipperfield and Perry23 developed with 1,178 elderly people from the
province of Manitoba in Canada, also demonstrated that older adults who perceived their health as poor/very poor were 3.4 times more likely to die than those who perceived their health as excellent.
An interesting finding that goes against the results of other studies is that there was no difference between physically active individuals when compared to insufficiently or inactive individuals. Practicing physical activity is generally a protective factor for mortality24, but it should be remembered
that questionnaires may overestimate levels of physical activity25, but it is a
widely used method when there is no possibility of using direct measures26.
period between the beginning of the physical activity practice and the mortality outcome, and on the other hand, the habits of physical activity practice may have changed during the period in which data were collected.
A limitation of the study was the non-control of the causes of death; however, the present article brings data about the lifestyle and character-istics of participants, and it is possible to estimate the causes of death in this population. In addition, it is relevant to say that mortality data are from the year 2014 and behaviors and habits may have changed over six years, such as moving from physically active to physically inactive. Another limitation was the sample loss due to refusals, change of domicile and city, hospitalized and bedridden people and problems in data tabulation.
This article is important for the area of epidemiology. The findings of this study confirm some results of literature and present the possible causes of mortality in the city of Rio Claro - SP, which can contribute to the reflection of new public policies and forms of interventions to minimize the number of deaths in the population.
CONCLUSION
Higher mortality risks for the municipality of Rio Claro - SP were ob-served in men, individuals with poor / very poor health perception, and people with advanced and middle age. In addition, there was no influence of the level of physical activity on mortality. In this way, the present study provides information for the creation of public policies aiming to increase the life expectancy of the population of Rio Claro - SP and of cities that have similar characteristics.
Acknowledgments
To the Foundation for Research Support of the State of São Paulo - FAPESP 2012/18795-7, National Council for Scientific and Technologi-cal Development - CNPq, Coordination for the Improvement of Higher Education Personnel - CAPES, Foundation for the Development of UNESP - FUNDUNESP, Federal Institute of Education, Science and Technology of Southern Minas Gerais - IFSULDEMINAS, Regional Council of Physical Education of the 4th Region - CREF4-SP.
REFERENCES
1. Wood CH, Carvalho JAM. The Demography of Inequality in Brazil. Cambridge: Cambridge University Press, 1988.
2. Aune D, Sen A, Prasad M, Norat T, Janszky I, Tonstad S, et al. BMI and all cause mortality: systematic review and non-linear dose-response meta-analysis of 230 cohort studies with 3·74 million deaths among 30·3 million participants. BMJ 2016; 353: i2156.
3. World Health Organization. Mortality. Available from: <http://www.who.int/ topics/mortality/en/> [2016 dec 09].
CORRESPONDING AUTHOR
Ana Elisa Messetti Christofoletti Avenida 24A, 1515
Bela Vista - CEP 13506-900 Rio Claro - SP - Brasil
E-mail: anaelisamchr@hotmail.com 5. World Health Organization. Global health Observatory data repository. Available
from: <http://apps.who.int/gho/data/node.main.11> [2016 dec 09].
6. Samitz G, Egger M, Zwahlen M. Domains of physical activity and all-cause mortality: systematic review and dose-response meta-analysis of cohort studies. Int J Epidemiol 2011;40(5):1382–1400.
7. Lee I-M, Shiroma EJ, Lobelo F, Puska P, Blair SN, Katzmarzyk PT, et al. Effect of physical inactivity on major non-communicable diseases worldwide: an analysis of burden of disease and life expectancy. Lancet 2012; 380(9838):219-29.
8. Hallal PC, Victora CG, Wells JC, Lima RC. Physical inactivity: prevalence and as-sociated variables in Brazilian adults. Med Sci Sports Exerc 2003;35(11):1894-1900.
9. Ramalho JRO, Mambrini JVM, César CC, de Oliveira CM, Firmo JOA, Lima-Costa MF, et al. Physical activity and all-cause mortality among older Brazilian adults: 11-year follow-up of the Bambuí. Health and Aging Study. Clin Interv Aging 2015;10:751-8.
10. Brasil. Ministério da Saúde. Saúde Brasil 2014: uma análise da situação de saúde e das causas externas. Brasília: Ministério da Saúde, 2015. 462 p: il.
11. Sistema IBGE de Recuperação Automática - SIDRA. Available from: <https:// sidra.ibge.gov.br/territorio> [2018 jan 15].
12. Instituto Brasileiro de Geografia e estatística. Cidades, 2015. Available from: <http://www.cidades.ibge.gov.br/xtras/perfil.php?lang=&codmun=354390&se arch=sao-paulo|rio-claro|infograficos:-informacoes-completas> [2016 dec 09].
13. Atlas do Desenvolvimento Humano no Brasil. Available from: <http://www. atlasbrasil.org.br/2013/pt/perfil_m/rio-claro_sp > [2017 jun 14].
14. Datasus. Sistema de informações. Available from: <www.datasus.gov.br> [2016 may 15].
15. Associação Brasileira de Empresas de Pesquisa. Critérios de classificação econômica Brasil. Available from: <http://www.abep.org/criterio-brasil> [2017 dec 22].
16. 16. Matsudo S, Timóteo A, Matsudo V, Andrade D, Andrade E, Oliveira LC, et al. Questionário Internacional de Atividade Física (IPAQ ): estudo de validade e reprodutibilidade no Brasil. Rev Bras Ativ Fis Saúde 2001;6(2): 5–18.
17. Ciconelli RM, Ferraz MB, Santos WS, Meinã IM, Quaresma MR. Tradução para a língua portuguesa e validação do questionário genérico de avaliação de qualidade de vida SF-36 (Brasil SF-36). Rev Bras Reumatol 1999;39(3):143–50.
18. Hirayama MS. Atividade física e Doença de Parkinson: Mudança de comporta-mento, auto-eficácia, barreiras percebidas e qualidade de vida. 2005. Dissertação (Mestrado em Ciências da Motricidade) – Universidade Estadual Paulista Júlio de Mesquita Filho, Rio Claro, 2005.
19. Instituto Nacional do Câncer. Available from: <http://www.inca.gov.br> [2017 dec 22].
20. World Health Organization. Physical Status: The Use and Interpretation of An-thropometry: Report of a World Health Organization Expert Committee. Geneva, Switzerland: World Health Organization; 1995.
21. Gawryszewski VP, Monteiro MG. Mortality from diseases, conditions, and in-juries where alcohol is a necessary cause in the Americas, 2007–2009. Addiction 2014;109(4):570–7.
22. Kaplan, GA., Goldberg DE., Everson SA., Cohen RD, Salonen R, Tuomilehto J, et al. Perceived Health Status and Morbidity and Mortality: Evidence from the Kuo-pio Ischaemic Heart Disease Risk Factor Study. Int J Epidemiol 1996;25(2):259-65.
23. Menec VH, Chipperfield JG, Perry RP. Self-perceptions of health: A prospec-tive analysis of mortality, control, and health. J Gerontol B Psychol Sci Soc Sci 1999;54B(2): 85-93.
24. Woodcock J, Franco OH, Orsini N, Roberts I. Non-vigorous physical activity and all-cause mortality: systematic review and meta-analysis of cohort studies. Int J Epidemiol 2010;40(1):121–38.
25. Lee PH, Macfarlane DJ, Lam TH, Stewart SM. Validity of the international physical activity questionnaire short form (IPAQ-SF): A systematic review. Int J Behav Nutr Phys Activ 2011;8:115.