Submitted: December 30, 2017
Accepted for publication: February 27, 2018 Last revision: March 09, 2018
Effect of grinding and aging on subcritical
crack growth of a Y-TZP ceramic
Abstract: This study aimed to investigate slow crack growth (SCG) behavior of a zirconia ceramic after grinding and simulated aging with low-temperature degradation (LTD). Complementary analysis of hardness, surface topography, crystalline phase transformation, and roughness were also measured. Disc-shaped specimens (15 mm Ø × 1.2 mm thick, n = 42) of a full-contourY-TZP ceramic (Zirlux FC, Amherst) were manufactured according to ISO:6872-2008, and then divided into: Ctrl – as-sintered condition; Ctrl LTD – as-sintered after aging in autoclave (134°C, 2 bar, 20 h); G – ground with coarse diamond bur (grit size 181 μm); G LTD – ground and aged. The SCG parameters
were measured by a dynamic biaxial flexural test, which determines
the tensile stress versus stress rate under four different rates: 100, 10, 1 and 0.1 MPa/s. LTD led to m-phase content increase, as well as grinding (m-phase content: Ctrl - 0%; G – 12.3%; G LTD – 59.9%; Ctrl LTD – 81%). Surface topography and roughness analyses showed that grinding created an irregular surface (increased roughness) and aging did not promote any relevant surface change. There was no statistical difference on surface hardness among different conditions. The control group presented the lowest strength values in all tested rates. Regarding SCG, ground conditions were less susceptible to SCG, delaying its occurrence. Aging (LTD) caused an increase in SCG susceptibility for the as-sintered condition (i.e. G < G LTD < Ctrl < Ctrl LTD).
Keywords: Yttrium Stabilized Zirconia; Hydrothermal Degradation; Stress Ratio; Fracture Mechanics; Biaxial Flexural Test
Introduction
The long term clinical behavior of zirconia especially with post-sintering alterations is still a concern. The literature reports ceramic degradation and decrease in strength after air-abrasion, grinding or aging,1,2,3 however, studies have also reported an enhance in fatigue
limits and strength after those procedures.4,5 The different findings
might be caused by the different conditions and parameters used for grinding and aging. A compression layer is created by transformation of the zirconia crystals from the tetragonal to the monoclinic phase when mechanical or chemical stimuli are applied to the ceramic.6,7 The
transformed layer is responsible for the increased strength and fatigue bearing ability of the material.5,6,7
Marina AMARAL(a)
Isabela Sandim Souza Leite WEITZEL(b)
Tais SILVESTRI(c)
Luis Felipe GUILARDI(c)
Gabriel Kalil Rocha PEREIRA(d)
Luiz Felipe VALANDRO(c)
Declaration of Interest: The authors certify that they have no commercial or associative interest that represents a conflict of interest in connection with the manuscript.
Corresponding Author:
Luiz Felipe Valandro
E-mail: lfvaland[email protected]
https://doi.org/10.1590/1807-3107bor-2018.vol32.0032 (a) Universidade de Taubaté – Unitau,
Department of Dentistry, Taubaté, SP, Brazil.
(b) Universidade de Taubaté – Unitau,
Department of Dentistry, Post Graduation Program in Dentistry, Taubaté, SP, Brazil.
(c) Universidade Federal de Santa Maria –
UFSM, Prosthetic Dentistry Unit, Post Graduation Program in Dental Science, Santa Maria, RS, Brazil.
(d) Faculdade Meridional – IMED,
Despite the continuous accuracy evolution of CAD/CAM systems, occlusal, proximal and marginal adjustments of the restorations are commonly performed in clinical situations.8 Procedures such
as grinding and polishing of the zirconia surface produce cracks and scratches on the surface and core of the restoration2,9 and may lead to degradation and
decreased strength of the material2,6. Depending on
the depth of defects (deeper or shallower) in relation to the depth of the transformed layer, failure might occur or not if the material is submitted to loads smaller than its characteristic strength.10,11
Also, the exposure of zirconia to water and humidity triggers spontaneous crystals’ phase transformation, reducing the toughening capacity of the material1,2 and creating a residual compression
stress layer, even without any mechanical surface alteration or load application2. As this mechanism
of phase transformation develops, it may result in a degradation process called “low temperature deg radation” (LTD). In LTD, defects around transformed grains arise,1,2 and may act as fracture
origins, decreasing strength, fracture toughness, and density of zirconia ceramic.1,12,13
However, in vitro studies have shown that zirconia samples subjected to surface treatment followed by fatigue test, despite showing higher strength and fatigue resistance, presented a higher decrease in strength when comparing initial (before fatigue)
to final values (after fatigue)5. This outcome may
be caused by slow crack growth of the defects
created during surface modification or fatigue. It is
hypothesized that, after longer times in function, these alterations may indeed decrease the load bearing capability of the material.1
Ceramic restorations are known to undergo slow crack growth (SCG), i.e., slow and stable growth of defects as a result of stress and environment effects,14
when there is a decrease in surface energy at the crack tip, promoting crack propagation18; SCG may occur in
different ways and periods of time19. This phenomenon
depends on the composition of the material15 and
affect all ceramic materials, but materials with a glassy boundary phase are more susceptible14. The growth
of defects will lead to failure of the material when the stress intensity factor (KI) at the crack tip reaches a
critical level (KIc) either by the crack length, increased
stress, or the shape factor “Y” - based on the type of stress, material dimension, and crack geometry.16,17
Thus, the present study aimed to investigate the slow crack growth behavior of zirconia ceramic after grinding with diamond bur and simulated LTD. The surface topography and roughness, as well as hardness were measured. The null hypothesis was that grinding and LTD do not interfere on SCG behavior of zirconia ceramic.
Methodology
Disc-shaped specimens were manufactured according to ISO:6872-200820, following the methodology
previously described by Pereira et al.6 Discs of
full-contourzirconia (LOT 637328 Rev.2, Zirlux FC, Amherst, NY, EUA; 100 mm diameter) were manually sliced with a diamond disc (Diamond Disc #7045 - Macro total double faced with holes, KG Sorensen, Cotia, Brazil) coupled to an electric motor (perfecta 300, W&H Dentalwerk Burmoos GmbH, Burmoos, Austria) under 12,000 rpm/min, into smaller rectangular blocks (20 mm long × 20 mm wide).
Then, the blocks were shaped into cylinders (18 mm diameter) using 600–1200 grit SiC paper (3M, St. Paul, MN, USA) under water-cooling; slices were obtained with 1.6 mm thickness using a precision saw (ISOMET 1000, Buehler, Lake Bluff, IL, USA).
The surfaces were fine-ground with 1200 grit SiC
paper and sintered (Zyrcomat T, Vita Zahnfabrik, Bad Sackingen, Germany) according to the manufacturer’s
instructions resulting in discs with final dimensions
of approximately 15 mm × 1.2 mm.
After sintering, the specimens were carefully inspected and those presenting discrepancies in thickness (1.2 ± 0.2 mm) above the standard variation preconized by ISO:6872-200820 were discarded. The
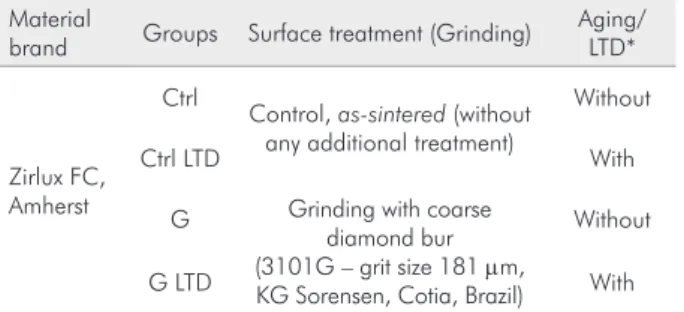
samples (n = 42) were randomly assigned into groups according to the factors “grinding” (two levels) and “aging” (two levels), as shown in Table 1.
Surface treatment
Grinding
Grinding (G) was performed by a single trained operator using diamond burs (#3101G grit size 181 μm) in a slow-speed motor (Kavo Dental, Biberach, Germany) coupled to a contra-angle handpiece (T2 REVO R170 up to 170,000 rpm, Sirona, Bensheim,
Germany) under constant water-cooling (≈30 mL/min).
A new bur was used for each specimen.
For standard wear and grinding uniformity, the specimens were marked with a permanent marker
(Pilot, São Paulo, Brazil) and affixed to a device to
assure parallelism between specimen and diamond bur, which allowed horizontal movements only. Then, the surface was grinded until the marking was eliminated. This procedure improved the reproducibility of the grinding treatment, although this level of control is not possible in a clinical setting.7
Low-temperature aging
Low-Temperature Degradation (LTD) was simulated in an autoclave (Sercon HS1-0300 n11560389/1) at 134°C, under 2-bar pressure, over a period of 20 h.7
Phase analysis
Quantitative analysis of phase transformation was conducted (n = 2) to determine the relative amount of m-phase and depth of the transformed layer under each condition. The analysis was performed using an x-ray diffractometer (Bruker AXS, D8 Advance, Karlsruhe, Germany). Spectra were collected in the 2θ range of 25–35° at a step interval of 1 s and step size of 0.03°. The amount of m-phase (Xm) was calculated using the method developed by Garvie and Nicholson:21
Xm = (-111)M + (+111)M
(-111)M + (+111)M + (+101)T
Eq. (1)
where M represent the monoclinic peaks (2θ=28° and 2θ=31.2°, respectively) and T indicates the intensity of the respective tetragonal peak (2θ=30°). The volumetric fraction (Fm) of the m-phase was calculated according to Toraya et al.:22
F m =
1.311X m 1 + 0.311X
m
Eq. (2)
The depth of the transformed layer (TZD) was calculated based on the amount of m-phase, considering that a constant fraction of grains had symmetrically transformed to m-phase along the surface, as described by Kosmac et al.:23
TZD = ln
sin θ
2µ
1
1 - Fm Eq. (3)
where θ=15° (the angle of reflection), µ=0.0642 is
the absorption coefficient, and Fm is the amount of
m-phase obtained using Eqs. (1) and (2).
Surface topography and roughness analysis
Specimens were subjected to surface roughness test (n=10, Mitutoyo SJ-410, Mitutoyo Corporation, Takatsu-ku, Kawasaki, Kanagawa, Japan), and scanning electron microscopy (SEM) (n=2, JSM-6360, JEOL, Tokyo, Japan).
Six measurements were made for each specimen (3 along the grinding direction, 3 in the opposite direction), according to the ISO:4287-199724 parameters
(Ra – arithmetical mean of the absolute values of peaks and valleys measured from a medium plane (mm)
and Rz – average distance between the five highest peaks and five major valleys found in the standard
(mm)) with a cut-off (n=5), λC 0.8 mm and λS 2.5 μm. Arithmetic mean values of all measurements from each specimen were obtained.
For SEM, two specimens from each group we r e sub m it t e d to sput t e r- co at i ng w it h a gold-palladium alloy, and images were obtained
with a 500× magnification.
Table 1. Experimental design.
Material
brand Groups Surface treatment (Grinding)
Aging/ LTD*
Zirlux FC, Amherst
Ctrl
Control, as-sintered (without any additional treatment)
Without
Ctrl LTD With
G Grinding with coarse
diamond bur (3101G – grit size 181 μm, KG Sorensen, Cotia, Brazil)
Without
G LTD With
Prior to the surface topography analysis, all specimens were submitted to a cleaning protocol in an ultrasonic bath with 78% isopropyl alcohol.
Vickers Hardness test
Two samples from each group (Ctrl, Ctrl/LTD, G, G/LTD) were mirror-polished (Aropol E, Arotec, Cotia, Brazil) with SiC paper (600, 800, 1200, 2000, 2500 grit) and cleaned in an ultrasonic bath (1440 D – Odontrobras, Ribeirão Preto, Brazil) using 78% isopropyl alcohol for 10 min. Each sample was positioned on a microhardness tester (HMV-G20, Shimadzu, Kyoto, Japan), equipped with a Vickers
test-tip. The parameters for indentations were defined
as time of 25 s, load of 19.61 N, and elastic modulus of 209.3 GPa.25 Both diagonals were measured (for
each respective specimen) and values of Vickers hardness were calculated according to the equation:
HV =
0.0018544P
d2 Eq. (4)
where “P” is the applied load (N) and “d” is the mean value of the two diagonal lengths (mm).
Dynamic biaxial flexural test
The slow crack growth parameters were determined
by a dynamic flexural test, according to ASTM C
1368/2017,26 which determines the tensile stress
according to the stress rate dσ/dt:
fn+1 =2 · (n + 1) · K
2 IC · c
n-2
(n - 2) · A · Y2
d dt
· Eq. (5)
where σf is the maximum applied stress for failure, σc is the initial load with the highest load rate, n and A are slow crack growth parameters, Y is a geometry
factor related to flaw shape and its orientation with
respect to the direction of applied stress, KIC is the
fracture toughness, dσ is a parameter related to the crack length, and dt is a parameter related to time.
All assumed parameters were consulted according to the literature.18,26
The test was conducted in a universal testing machine (EMIC DL 3000, Sao Jose dos Pinhais, Brazil) under four different loading rates: 100, 10, 1 and 0.1 MPa/s. Fifteen samples were tested for the
highest and lowest loading rates, and five samples
for the intermediary rates. Samples were tested immersed in water at room temperature using an incremental loading under the pre-determined loading rate until fracture. Due to the long time required for the test at the lowest stress rate (0.1 MPa/s), we assumed a starting pre-load of 30% of
the flexural strength,26 recorded on the previous
loading rates, which resulted in approximately 2 hours testing per sample.
The biaxial flexural strength data were calculated
according to ISO:6872-2008,20 determining the stress
rate for each sample. The value of Poison’s ratio was assigned as 0.31 according to the literature.25
The SCG “n” parameter, which characterizes the
growth rate of flaws in ceramics (degree of slow crack
growth susceptibility of a material - derived from the slope of the curve ‘log fracture stress’ vs. ‘log stress rate’), was calculated according to ASTM C-1368.26
Data analyses
All collected data were submitted to a descriptive analysis to obtain mean and standard deviation and then to distribution and homoscedasticity tests (Shapiro-Wilk and Levene, respectively), which allowed the selection of the adequate statistical approach for each outcome. Thus, roughness and hardness data were submitted to one-way ANOVA and post-hoc Tukey tests.
Results
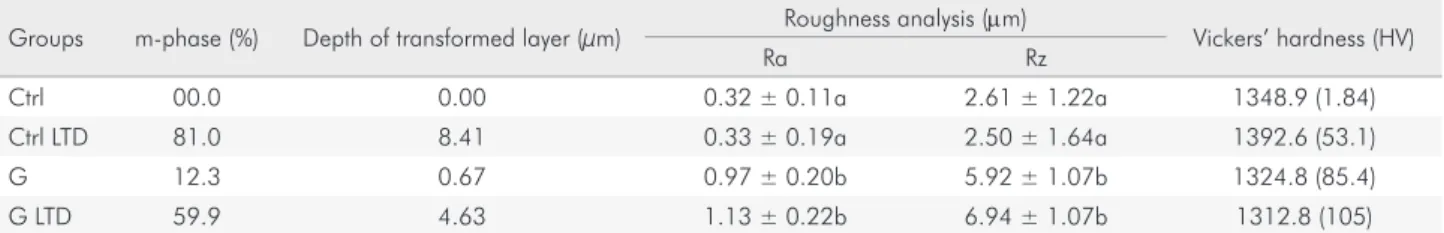
Phase analysis
Control group (Ctrl) had no monoclinic phase, followed by ground group (G), while the groups subjected to the degradation in autoclave (Ctrl LTD and G LTD) presented the highest content of monoclinic phase (Table 2). The depth of transformed layer follows
the aforementioned findings for phase transformation
(Table 2).
Surface topography and roughness analysis
SEM images (Figure 1) show that grinding created an irregular topography surface and that aging did not promote any relevant surface changes.
Roughness analysis (Ra and Rz parameters)
roughness and aging did not change the roughness (Table 2).
Vickers Hardness
Hardness values were not affected by grinding and/or LTD (p = 0.595) (Table 2).
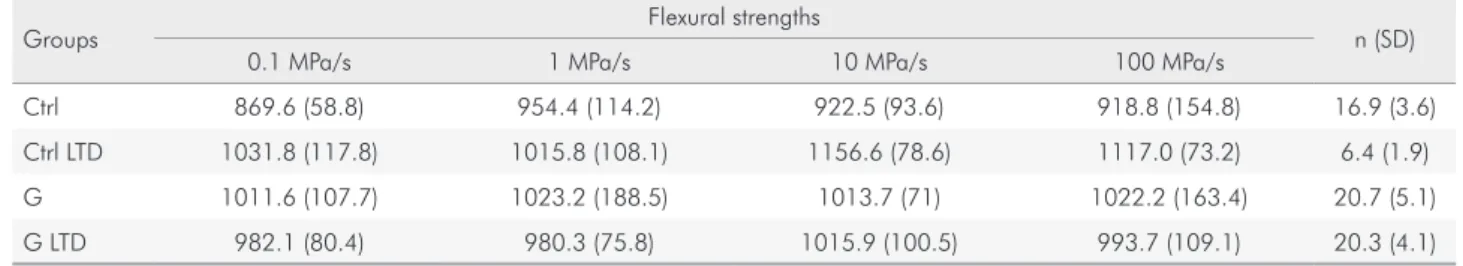
Dynamic biaxial flexural test
Table 3 shows the mean values of fracture strength for every group in each stress rate applied. Control group presented the lowest strength values in all rates.
The LTD caused a well-defined decrease in “n” value for
as-sintered samples (Ctrl LTD), and did not impacted on
Table 2. Percentage of monoclinic phase, depth of transformed layer, roughness data (mean ± SD) for Ra and Rz parameters, Vickers hardness.
Groups m-phase (%) Depth of transformed layer (µm) Roughness analysis (μm) Vickers’ hardness (HV)
Ra Rz
Ctrl 00.0 0.00 0.32 ± 0.11a 2.61 ± 1.22a 1348.9 (1.84)
Ctrl LTD 81.0 8.41 0.33 ± 0.19a 2.50 ± 1.64a 1392.6 (53.1)
G 12.3 0.67 0.97 ± 0.20b 5.92 ± 1.07b 1324.8 (85.4)
G LTD 59.9 4.63 1.13 ± 0.22b 6.94 ± 1.07b 1312.8 (105)
*Different letters indicate statistical differences in the same column.
C D
A B
10kV 500 50µm 10kV 500 50µm
10kV 500 50µm 10kV 500 50µm
the ground condition (G LTD) (Table 3). Figure 2 presents the graph of logarithmic function ‘strength’ vs. ‘stress rate’ and the slopes of each group. The curves show that every group presented decrease in strength as the stress rate decreased, but with different slopes – the higher slope, the higher susceptibility to slow crack growth.
Discussion
This study evaluated the slow crack growth (SCG) behavior of monolithic zirconia after grinding with diamond bur and aging (LTD simulation) on autoclave. Since the investigated factors (i.e. grinding and aging)
influenced SCG behavior, with the highest n-value
reported after grinding and after grinding+aging (LTD), the null hypothesis was rejected.
Crystalline phase transformation from tetragonal to monoclinic was induced by grinding and LTD (Table 2). As-sintered group (Ctrl) presented 81% of monoclinic phase after LTD, and 0% after aging. The
accelerated degradation in Ctrl LTD is attributed to the absence of compressive stress after sintering. Sintering of samples after disc fabrication promotes contraction of the material (transformation of the crystals from
monoclinic to tetragonal state), restoring handling flaws
and relieving compressive stresses,27 which showed
to facilitate t-m phase transformation during LTD simulation. Samples that were ground (G) presented
12.3% of monoclinic phase (0.67 µm of transformed
layer); this increase in m-phase content results in a residual compression stress layer on the surface of the material in response to the increased volume of the crystals during transformation (~4%). The compressive layer present on abrased samples slows down the LTD process, thus ground-aged samples (G LTD) presented lower m-phase content (59.9%) than Ctrl LTD group, which is in accordance with previous results.2
In summary, grinding affects the Y-TZP surface by two mechanisms: a) introduction of residual stresses from elastic/plastic damages caused by the diamond bur
Table 3. Flexural strength means and respective standard deviations in each stress rate and slow crack growth susceptibility (n).
Groups Flexural strengths n (SD)
0.1 MPa/s 1 MPa/s 10 MPa/s 100 MPa/s
Ctrl 869.6 (58.8) 954.4 (114.2) 922.5 (93.6) 918.8 (154.8) 16.9 (3.6)
Ctrl LTD 1031.8 (117.8) 1015.8 (108.1) 1156.6 (78.6) 1117.0 (73.2) 6.4 (1.9)
G 1011.6 (107.7) 1023.2 (188.5) 1013.7 (71) 1022.2 (163.4) 20.7 (5.1)
G LTD 982.1 (80.4) 980.3 (75.8) 1015.9 (100.5) 993.7 (109.1) 20.3 (4.1)
2,92 2,94 2,96 2,98 3 3,02 3,04 3,06 3,08
-2 -1 0 1 2 3
Log Fracture Strength
Log Stress Rate
CTRL
CTRL LTD
G
G LTD
on zirconia surface, and the formation of a compressive layer formed by crystalline transformation, which is
beneficial for LTD resistance;28 and b) introduction of
superficial defects and increase in roughness (Table 2). It
seems that the balance between these two mechanisms
define the mechanical properties of this material.
We found that both evaluated factors (grinding and
aging) had no influence on Vickers hardness (Table 2).
Previous studies reported that aging28 and grinding30
did not affect hardness of zirconia. Measuring hardness by Vickers indentation requires that samples are mirror-polished to enable the performance and reading of the indentation diagonals. Thus, after grinding and LTD, samples were polished. Despite corroborating with the literature, authors believe that polishing might have promoted a standard compression layer for all tested samples, resulting in similar hardness values.
Regarding dynamic flexural strength findings (Figure 2), the Ctrl LTD group presented the highest strength values while the Ctrl group presented the lowest strength values, although no statistics were performed since few samples were tested under intermediate loading rates (Table 3). Strength was directly related to the amount of monoclinic phase: the higher the monoclinic phase content, the higher the flexural strength. The compression layer formed by volume expansion during the transformation of the crystals from tetragonal to monoclinic phase increases the strength of the material5,7.
However, Ctrl LTD was also the group with lower n-value (Table 3). The n-value is the parameter related to the material’s susceptibility to stable crack growth when loads bellow the critical value are applied; it is obtained by the inclination of the slope in the graph ‘log fracture strength’ vs ‘log loading rate’ (Figure 2).
Groups submitted to grinding present intermediate strength values and lower trend to suffer SCG (Table 3, Figure 2). The presence of some amount of monoclinic phase seems to protect the material against phase transformation and SCG. A similar study that performed staircase fatigue approach reported that the fatigue limit (20,000 cycles) of samples submitted to grinding with diamond bur followed by LTD was higher than Ctrl, Ctrl LTD, and G.32
The present study was performed with samples immersed in water – the H2O ions break the oxide
bonds and promote corrosion at the crack tip, which was
kept open by the application of the constant load. The capacity of the material to resist crack growth (fracture
toughness property) is defined by the shape and size of
the crack, the loading condition, and the stress applied at the moment of fracture.17 In the lowest stress rate (0.1
MPa/s), there was more time for water corrosion and crack growth, since critical stress took longer to occur than in the other tested rates. In this scenario, the size
of the critical flaw, which causes the material to fail, also increases, decreasing the final strength of the sample.
The contrary occurs in the fastest loading rate (100 MPa/s): the time for crack growth and water
corrosion is small, and flexural strength is the highest
in each group. A decrease in strength was found for all groups from 100 to 0.1 MPa/s (Figure 2), but the decrease was more pronounced in the Ctrl LTD group (lowest n-value, Table 3). The mechanism of zirconia toughening (phase transformation) occurred in 81% of the Ctrl surface (Table 2), with small amount of crystals in tetragonal phase. Thus, the toughening mechanism against the SCG (i.e. lower loading rates) was not enough to hold cracks and keep the strength high.
It is important to emphasize that as an in vitro study simulating a clinical condition of full contour zirconia restorations it has inherent limitations. The long-term behavior of these restorations must be clinically evaluated
for a more conclusive finding. Additionally, adjustments
(grinding) performed clinically vary depending on the case and with varying hand pressure from the operator, followed by different post-processing treatments (e.g. polishing, glazing), which also may influence outcomes. In addition, hardness values may have been underestimated due to the employed methodology.
Conclusion
Grinding of zirconia surface promotes t-m phase transformation, topography alteration (insertion of defects), and increased roughness.
Grinding decreased the susceptibility to phase transformation during aging (LTD) of the evaluated Y-TZP. Samples in as-sintered condition after LTD presented the highest m-phase percentage.
Neither grinding nor aging (LTD simulation)
influenced the surface hardness of the evaluated
Ground surfaces presented lower susceptibility to crack propagation while as-sintered+aged (LTD
simulation) samples presented a well-defined increase
on slow crack growth susceptibility.
1. Kim HT, Han JS, Yang JH, Lee JB, Kim SH. The effect of low temperature aging on the mechanical property & phase stability of Y-TZP ceramics. J Adv Prosthodont. 2009 Nov;1(3):113-7. https://doi.org/10.4047/jap.2009.1.3.113 2. Kim JW, Covel NS, Guess PC, Rekow ED, Zhang Y. Concerns of
hydrothermal degradation in CAD/CAM zirconia. J Dent Res. 2010 Jan;89(1):91-5. https://doi.org/10.1177/0022034509354193 3. Zhang Y, Lawn BR. Fatigue sensitivity of Y-TZP to microscale
sharp-contact flaws. J Biomed Mater Res B Appl Biomater. 2005 Feb;72(2):388-92. https://doi.org/10.1002/jbm.b.30174 4. Scherrer SS, Cattani-Lorente M, Vittecoq E, Mestral F,
Griggs JA, Wiskott HW. Fatigue behavior in water of Y-TZP zirconia ceramics after abrasion with 30 μm silica-coated alumina particles. Dent Mater. 2011 Feb;27(2):e28-42. https://doi.org/10.1016/j.dental.2010.10.003P
5. 5. Amaral M, Cesar PF, Bottino MA, Lohbauer U, Valandro LF. Fatigue behavior of Y-TZP ceramic after surface treatments. J Mech Behav Biomed Mater. 2016 Apr;57:149-56. https://doi.org/10.1016/j.jmbbm.2015.11.042 P 6. Pereira GK, Amaral M, Simoneti R, Rocha GC, Cesar PF,
Valandro LF. Effect of grinding with diamond-disc and -bur on the mechanical behavior of a Y-TZP ceramic. J Mech Behav Biomed Mater. 2014 Sep;37:133-40. https://doi.org/10.1016/j.jmbbm.2014.05.010
7. Pereira G, Amaral M, Cesar PF, Bottino MC, Kleverlaan CJ, Valandro LF. Effect of low-temperature aging on the mechanical behavior of ground Y-TZP. J Mech Behav Biomed Mater. 2015 May;45:183-92. https://doi.org/10.1016/j.jmbbm.2014.12.009 8. Aboushelib MN, Feilzer AJ, Kleverlaan CJ. Bridging
the gap between clinical failure and laboratory fracture strength tests using a fractographic approach. Dent Mater. 2009 Mar;25(3):383-91. https://doi.org/10.1016/j.dental.2008.09.001
9. Quinn JB, Quinn GD, Kelly JR, Scherrer SS. Fractographic analyses of three ceramic whole crown restoration failures. Dent Mater. 2005 Oct;21(10):920-9. https://doi.org/10.1016/j.dental.2005.01.006
10. Zhang Y, Lawn BR, Malament KA, Van Thompson P, Rekow ED. Damage accumulation and fatigue life of particle-abraded ceramics. Int J Prosthodont. 2006 Sep-Oct;19(5):442-8. 11. Kosmač T, Oblak C, Marion L. The effects of
dental grinding and sandblasting on ageing and fatigue behavior of dental zirconia (Y-TZP) ceramics. J Eur Ceram Soc. 2008;28(5):1085-90. https://doi.org/10.1016/j.jeurceramsoc.2007.09.013
12. Zhang Y, Pajares A, Lawn BR. Fatigue and damage tolerance of Y-TZP ceramics in layered biomechanical systems. J Biomed Mater Res B Appl Biomater. 2004 Oct;71(1):166-71. 13. Ban S, Sato H, Suehiro Y, Nakanishi H, Nawa M. Biaxial
flexure strength and low temperature degradation of Ce-TZP/ Al2O3 nanocomposite and Y-TZP as dental restoratives. J Biomed Mater Res B Appl Biomater. 2008 Nov;87(2):492-8. https://doi.org/10.1002/jbm.b.31131
14. Quinn GD. Fractography of ceramics and glasses. [S. l.]: National Institute of Standards and Technology; 2007. (Special Publiction, 960-16).
15. Ramos NC, Campos TM, Paz IS, Machado JP, Bottino MA, Cesar PF et al. Microstructure characterization and SCG of newly engineered dental ceramics. Dent Mater. 2016 Jul;32(7):870-8. https://doi.org/10.1016/j.dental.2016.03.018 16. Gonzaga CC, Cesar PF, Miranda WG Jr, Yoshimura HN. Slow
crack growth and reliability of dental ceramics. Dent Mater. 2011 Apr;27(4):394-406. https://doi.org/10.1016/j.dental.2010.10.025 17. Quinn GD. Guide to practice for fractography of ceramics and
glasses. [S. l.]: National Institute of Standards and Technology; 2007. 18. Mitov G, Gessner J, Lohbauer U, Woll K, Muecklich F, Pospiech
P. Subcritical crack growth behavior and life data analysis of two types of dental Y-TZP ceramics. Dent Mater. 2011 Jul;27(7):684-91. https://doi.org/10.1016/j.dental.2011.03.010 19. Anusavice KJ, Jadaan OM, Esquivel-Upshaw JF. Time-dependent
fracture probability of bilayer, lithium-disilicate-based, glass-ceramic, molar crowns as a function of core/veneer thickness ratio and load orientation. Dent Mater. 2013 Nov;29(11):1132-8. https://doi.org/10.1016/j.dental.2013.08.206
20. International Organization for Standards. ISO 6872:2008. Dentistry: ceramic materials. Geneva: International Organization for Standards; 2008.
21. Garvie RC, Nicholson PS. Phase analysis in zirconia systems. J Am Ceram Soc. 1972;55(6):303-5. https://doi.org/10.1111/j.1151-2916.1972.tb11290.x 22. Toraya H, Yoshimura M, Somiya S. Calibration curve for
quantitative analysis of the monoclinic-etragonal ZrO2 system by x-ray diffraction. J Am Ceram Soc. 1984;67:C119-21. 23. Kosmac T, Wagner R, Claussen N. X- Ray determination
of transformation depths in ceramics containing tetragonal ZrO2. J Am Ceram Soc. 1981;64(4):C72-3. https://doi.org/10.1111/j.1151-2916.1981.tb10285.x 24. International Organization for Standards. ISO 4287:1997.
Geometrical Product Specifications (GPS) - Surface texture: Profile method - Terms, definitions and surface texture parameters. Geneva: International Organization for Standards; 1997.
25. Borba M, Araújo MD, Lima E, Yoshimura HN, Cesar PF, Griggs JA et al. Flexural strength and failure modes of layered ceramic structures. Dent Mater. 2011 Dec;27(12):1259-66. https://doi.org/10.1016/j.dental.2011.09.008
26. ASTM International. ASTM C1368. Standard test method for determination of slow crack growth parameters of advanced ceramics by constant stress-rate strength testing at ambient temperature. West Conshohocken: ASTM International; 2018. 27. Raigrodski AJ. Contemporary all-ceramic fixed partial dentures:
a review. Dent Clin North Am. 2004 Apr;48(2):531-44. https://doi.org/10.1016/j.cden.2003.12.008
28. Deville S, Chevalier J, Gremillard L. Influence of surface finish and residual stresses on the ageing sensitivity of biomedical grade zirconia. Biomaterials. 2006 Apr;27(10):2186-92. https://doi.org/10.1016/j.biomaterials.2005.11.021 29. De Souza GM, Zykus A, Ghahnavyeh RR, Lawrence SK, Bahr
DF. Effect of accelerated aging on dental zirconia-based
materials. J Mech Behav Biomed Mater. 2017 Jan;65:256-63. https://doi.org/10.1016/j.jmbbm.2016.08.023
30. Sandhu R, Kheur M, Kheur S. Effect of simulated chairside grinding procedures using commercially available abrasive agents on the surface properties of zirconia. J Indian Prosthodont Soc. 2017 Jan-Mar;17(1):22-8. https://doi.org/10.4103/0972-4052.194938
31. Harada K, Shinya A, Gomi H, Hatano Y, Shinya A, Raigrodski AJ. Effect of accelerated aging on the fracture toughness of zirconias. J Prosthet Dent. 2016 Feb;115(2):215-23. https://doi.org/10.1016/j.prosdent.2015.08.020 32. Pereira GK, Silvestri T, Amaral M, Rippe MP, Kleverlaan