1
Corresponding author:
Received: April 13, 2018
Accepted: August 03, 2018
Copyright: All the contents of this journal, except where otherwise noted, is licensed under a Creative Commons Attribution License.
Quality of peach fruits Jarillo cv. (
Prunus persica
L.)
in Pamplona, Colombia
Enrique Quevedo García
1, Fánor Casierra-Posada
2, Aquiles Enrique Darghan Contreras
3Abstract - The aim of this study was to characterize the quality of peach fruits Jarillo cv., produced under the conditions of altitude tropical climate in three locations: Pamplona, Chitagá and Pamplonita, in Northern Santander, Colombia. Ten trees were sampled by the conditioned latin hypercube method and eight growing fruits with physiological state of maturity were selected.
By means of a profile analysis, the hypotheses of parallelism, coincidence and horizontality of
quality variables in the complete measurement interval were tested, and in some segments of the interval, some patterns from the graphic point of view were found. A radial diagram was made to study the development of fruit color at each thermal level. When the quotient between longitudinal diameter and equatorial diameter tends to 1 to the left, the highest weight values are reached,
highlighting the lowest elevation level, with weights around 150 g. The profile analysis showed, regarding quality variables, that there was a significant interaction between evaluation time and
altitude level. The results show that the prevailing climatic conditions affect the physicochemical characteristics of fruits during the growth process until maturation.
Index terms: total soluble solids, firmness, total titratable acidity, color.
Qualidade de frutas de pessegueiro variedade Jarillo
(
p. persica
L.) em Pamplona, Colômbia
Resumo - O objetivo da pesquisa foi caracterizar a qualidade do fruto de pessegueiro cv. Jarillo, produzido sob as condições de tropical de altitude em três locais: Pamplona, Chitagá e Pamplonita, no Norte de Santander, Colômbia. Dez árvores foram amostradas pela técnica
hipercúbica condicional latina e oito frutos em crescimento e estado fisiológico de maturidade foram selecionados em cada um. Por meio de uma análise de perfil, foram testadas as hipóteses
de paralelismo, coincidência e horizontalidade das variáveis de qualidade no intervalo completo de medição e em alguns segmentos do intervalo, alguns padrões foram encontrados do ponto de
vista gráfico. Um diagrama radial foi feito para estudar o desenvolvimento da cor dos frutos em
cada nível térmico. Quando o quociente entre o diâmetro longitudinal e o diâmetro equatorial tende para 1 pela esquerda, os maiores valores de peso são alcançados, destacando-se o menor nível de
elevação, com pesos em torno de 150 g. A análise do perfil mostrou, nas variáveis de qualidade, que houve interação significativa entre o tempo de avaliação e o nível de altitude. Os resultados
mostram que as condições climáticas predominantes afetam suas características físico-químicas durante o processo de crescimento até a maturação.
Termos para indexação: sólidos solúveis totais, firmeza, acidez total titulável, cor.
1Agronomist, MSc, Universidad de Pamplona, Research group on sustainable agriculture and livestock, Pamplona, Colombia. E-mail:
2 Agronomist, PhD, Universidad Pedagógica y Tecnológica de Colombia – UPTC. Research group in Plant Ecophysiology. Tunja, Colombia.
E-mail: [email protected]
3Agricultural Engineer, PhD, Universidad Nacional de Colombia, Horticulture research group, Bogotá D. C., Colombia. E-mail: aqedarghanco@
unal.edu.co
Introduction
Peach tree is one of the fruit trees commonly planted in altitude tropical areas, as it has advantages compared to those planted in temperate areas (MATIAS et al., 2015a; PINZÓN et al., 2014). It has been reported that peach varieties that grow in altitude American tropics are in many cases derived from trees such as the Jarillo variety in Pamplona that has been adapted by natural selection to the tropical climate. Other characteristics of varieties for exploration in the tropics are their high
ability to form flower buds in regions close to the equator,
where there are no large photoperiod variations or very low temperatures that induce defoliation and changes in fruit biochemical processes (MATIAS et al., 2017;
COSTA AND SILVA et al., 2014; FISCHER et al., 2010). Among the parameters most used to define fruit quality
are size, shape, weight, color and chemical substances such as acidity, TSS (° Brix), TTA (% malic acid), sugar content and some volatile compounds associated with the secondary metabolism that determine aroma, parameters
that also serve to determine the quality of the final product and control processes (MORAIS et al., 2017; MATIAS et al., 2017; CREMASCO et al., 2016).
The quality attributes that have greater relevance in
fruits are: color, firmness, soluble solids content, acidity
and sugars: acids ratio (MATIAS et al., 2017; MATIAS
et al., 2016; SILVA et al., 2016). Fischer et al. (2012a)
reported that high quality fruits require an adequate relationship between leaves and fruits. Softening or loss of
firmness is a process of changes in the cell wall structure, glycol depolymerisation and pectin solubilization (FRUK et al., 2014). Fruit firmness is considered low when its value is between 0.40 and 0.62 kg cm-2
(SANTIAGO-MEJÍA et al., 2008). In the production of peaches for fresh consumption, fruit size is one of the determinants of quality, since it is a fundamental requisite demanded by the
consumer (MORAIS et al, 2017, MATIAS et al., 2015b).
Peach fruits considered of good size are those with more than 59 mm in diameter. Standardizing or classifying the product by size is one of the usual practices of preparation
for fresh consumption market (MATIAS et al., 2017). However, color and size are the attributes most valued by the consumer (MORAIS et al., 2017, CREMASCO et al., 2016).
Perhaps pulp firmness is the most notorious parameter and allows determining collection, quality
and consumption patterns (MORAIS et al., 2017, CREMASCO et al., 2016, SILVA et al., 2016, MATIAS et
al., 2015a). The physicochemical characteristics of fruits
are influenced by the climatic conditions of the production area and vary according to altitude (REGINA et al., 2010), temperature (GRUDA, 2005), rainfall (GALINDO et al., 2014) and relative humidity (GARIGLIO et al., 2007).
The main aim of this study was to characterize the quality of peach fruits Jarillo cv. produced under altitude tropical conditions and its relationship with climatic parameters in three thermal conditions located in three different locations: Pamplona (2170 masl), Chitagá (1870
masl) and Pamplonita (1670 masl), in Northern Santander,
Colombia, in order to determine the best conditions for crop development.
Materials and methods
The research was carried out in three thermal conditions located in three locations of different altitudes of Northern Santander, Colombia. Pamplona, with
coordinates 7° 22 ‘43.6 “N and 72°37’41.1” W, average temperature of 16°C, maximum temperature of 22°C,
rainfall of 933.9 mm. Soils belong to the Inceptisol order
(IGAC, 2006).
The second location was Chitagá, with coordinates
7°11 ‘15 “N and 72°39’ 7.3” W, with average temperature
of 18°C, maximum temperature of 22°C, rainfall of 879.5 mm. The predominant soil is Inceptisol, with ochric
epipedon and subsurface Cambic horizon (IGAC, 2006).
Finally, the third thermal level is located in
Pamplonita, with coordinates 7°26 ‘18.1 “N and 72°38’ 9”
W, average temperature of 20°C, maximum temperature of 27°C, rainfall of 1200 mm. The predominant soil is Inceptisol, with ochric epipedon and subsurface Cambic
horizon (IGAC, 2006).
For the sampling of peach trees Jarillo variety from the sexual seed at each thermal level, the conditioned latin hypercube method (MINASNY et al., 2012) was
used, with tree coordinates, identifying 48 trees (6 rows
and 8 columns), including as auxiliary variable the leaf area approximately elliptical in shape, approximated with the relation with the area of an ellipseπab, where a was
associated with the largest semi-axis (length in meters) and b with the smallest semi-axis (width in meters).
Sampling was adjusted for each thermal level
and, with the help of the CLHS library (conditioned Latin hypercube sampling) of the R software, a sample of 8
trees per thermal level was generated, of which 10 fruits of the middle third of similar appearance in color were collected using the equatorial and longitudinal diameter as auxiliary variables of the conditioned sampling. These samples formed an array of 240 observations separated into 80 data per thermal level. The 10 fruit samplings
were made among the phenological stages of the BBCH
scale (Biologische Bundesanstalt, Bundessortenamt und Chemische): 72: green ovary surrounded by crown of
dying petals, 75: fruit about half the final size and 87: ripe fruit for harvesting (MOUNZER et al., 2008).
The response variables measured were: fruit
soluble solids / acidity ratio. Firmness was expressed in
kg. cm-2 using a Forge Gauge® digital penetrometer,
PCE-FM200 reference, which measurement was performed in two faces of the fruit three times in the equatorial axis in order to obtain an average value. For the determination of the soluble solids content, the AOAC method 932.12
(1995) was used with the aid of BRIXCO FG109 portable refractometer (0-32 ° Brix), with resolution: 0.2% RH and
automatic temperature compensation. This variable was determined after extraction of a drop of juice from the fruit pulp, being placed in the prism, closed and focused to the light, and reading was made in TSS (oBrix 0.2%). pH was
measured with the modified A.O.A.C method 981.12 / 90 using a waterproof pH / EC / TDS table potentiometer from Hanna Instruments. It was previously calibrated by taking a 10-gram sample of pulp macerated or liquefied in 10 mL of water and filtered, and after washing the electrode with
distilled water, the bulb was introduced without touching the walls or the bottom of the vessel until measurement was stabilized. Total acidity (AOAC 942.15, 2005) was determined by titration using a 25 mL burette with 10 mL of fruit juice in which three drops of phenolphthalein
were added; titration was performed with 0.1 N NaOH until pH of 8.2 was reached. The NaOH volume used was
estimated until phenolphthalein was turned and the result was expressed as % titratable acid.
The soluble solids / acidity ratio (MR), also
referred to as soluble solids / acidity maturity ratio, was
calculated by the expression MR = oBrix / % titratable acid.
Color was determined by comparison with the Munsell table (1977), placing the fruit on a white paper base and comparing the predominant fruit color to the table scale, collecting the most similar data.
Climatic data collected in each plot were: rainfall for time between sampling through the localization of a Brazilian manual rain gauge, Walmur brand, with scale from 0 to 130 mm; suitable for the weather with a special holder easy to remove and place the rain gauge. Temperature (degrees Celsius) was measured with an
Extech RHT20 hygrometer with humidity measurement range from 0 to 100% RH (relative humidity), temperature
range from -40 to 70 ° C, with data memory capacity of
16,350 for temperature and 16,350 for RH, with selectable
cycle between 1 second and 24 hours, with resolution of
0.1 ° C and 0.1 RH.
For the statistical analysis of variable fruit
quality, the profile analysis was used, a multivariate
strategy analogous to the drawing in repeated measures
(MONTERO, 2018) to test hypotheses of parallelism, coincidence and horizontality or constancy of profiles of
responses of variables TSS (oBrix), upper fruit resistance,
lower fruit resistance, pH, TTA (% malic acid) and MR,
all of them separated by thermal levels (three levels:
1670, 1870 and 2170 masl). The variable in repeated
measurement was associated with the measurement time
after defoliation, with times not equidistant ranging from 33 to 185 dad (days after defoliation).
To complement the analysis, the profiles associated
with the error bars (Bonferroni method) were constructed. For the case of fruit-associated morphometric variables, as well as their quotient (longitudinal in relation to equatorial) and for the physiological parameter, three-dimensional quadratic surfaces were adjusted to describe
the likely nature of the association between morphometric
and performance variables analyzed. For climatic data, linear diagrams were constructed per thermal level for the
minimum and maximum temperature and RH during the
time between each sampling and, in the case of rainfall, the accumulated values for the same periods of time were used.
Results and discussion
The analysis of profiles allowed the comparison
of the three thermal levels of the evolution of variables TSS (oBrix), lower and upper firmness, pH, TTA (% malic
acid) and MR for the different times, from 33 to 185 dad at harvest for 10 measurements (MONTERO, 2018).
In the hypothesis of parallelism of the profile
analysis, none of the variables presented differences
between 33 to 185 dad; however, figures 3A to 3F show
sections with parallelism, so that tests were performed in segments of the complete range in those that did not reject the absence of parallelism, as is the case of TSS (oBrix),
in 87-119, 131-157 and 157-185 dad.
The values obtained in the three thermal levels for TSS (oBrix) were presumably high because crops were
planted in low density, agronomic practices against sowing at high density by Santiago-Mejía et al. (2008). Morais et al. (2017) considered that TSS values (oBrix) greater
than 10 oBrix were the minimum accepted by consumers
to consume yellow fruits, which were reached in the three thermal levels, and were even higher than this minimum value and increased during the maturation process.
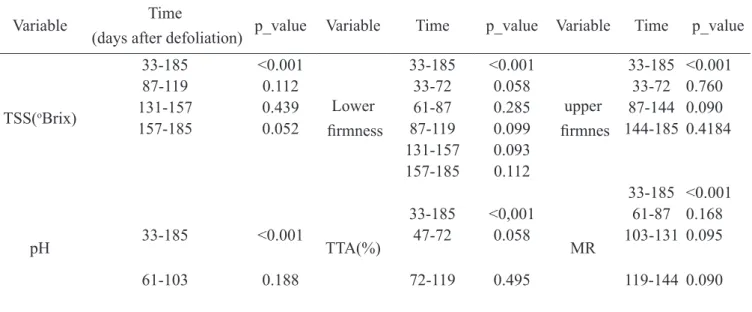
The main idea is to associate patterns according to the phenological phase of the crop; therefore, the analysis is not seen as multiple statistical analyses that may require the type I error Bonferroni correction. Table 1 shows the
sections where the profile parallelism was evidenced,
indicating constant differences in the means within the
area for at least two thermal levels (MONTERO, 2018).
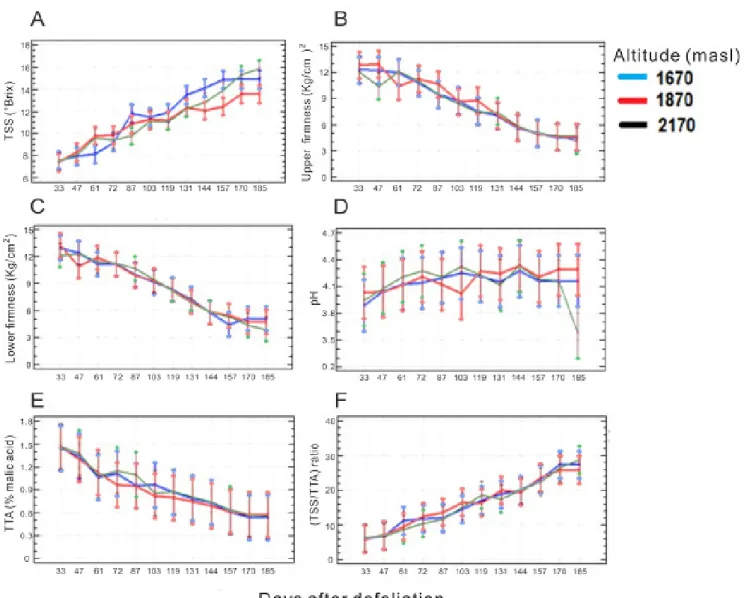
In the case of TSS (oBrix) (Figure 1A), averages
are greater from 87 to 170 dad; however, at 131 dad, the
1670 masl profile is away from the profiles of the other two
thermal levels in comparison to the immediately adjacent times, although in the end, the values obtained are higher for thermal levels 1870 and 2170 masl, and would indicate that increases in TSS (oBrix) are usually accompanied by
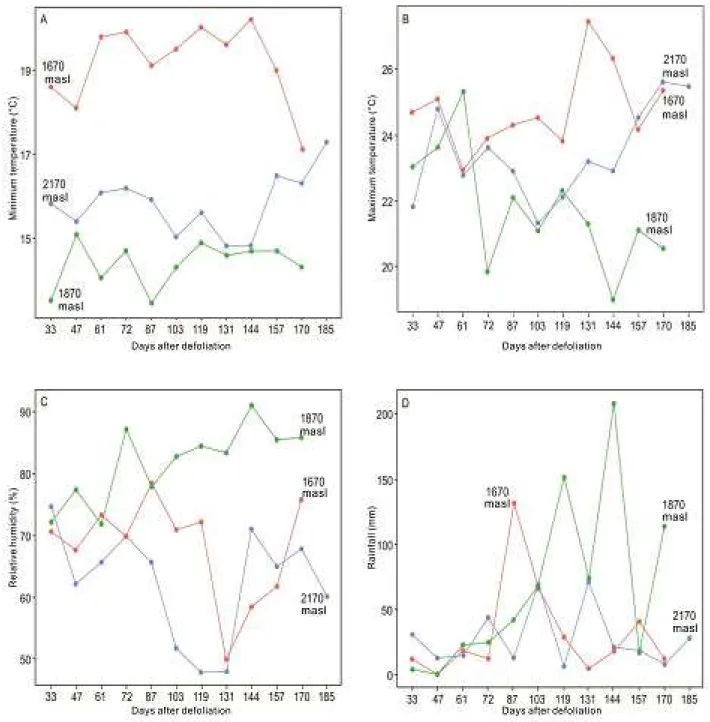
first in the lowest temperatures during the day, as shown
in Figure 2, and that they are the main climatic cause for the increase of soluble solids, as found by Cremasco et
al., (2016).
TSS (oBrix) was higher at 1670 masl from 87 dad,
remembering that between 119 and 131 dad, values were
practically the same (figure 1A), which is also evident
in the maximum and minimum temperature diagrams (Figures 2A and 2B ), because at this thermal level, the highest maximum and minimum temperature values are obtained. The results obtained agree with the TSS behavior (oBrix) reported in other works for peach tree (SILVA et
al., 2016) and feijoa (MARTÍNEZ-VEGA et al., 2008). The highest interaction of profiles was observed in pH and TSS (oBrix), which means that in different
time segments, the maximum or minimum response value was found in different thermal levels, presenting a chaotic pattern similar to climatic variables involved, which indicates that the environment probably acted in the
expression of the variables found in the work of Matias et al., (2017) and Cremasco et al., (2016) in Brazil.
The pH values of fruits showed differences by
thermal level in the global section (p <0.001), but in the
section from 61 to 103 dad, parallelism was observed, thus having similar patterns in relation to pH values, and in section from 33 to 119 dad, the highest pH value is reached at 2170 masl, with the lowest RH at the thermal level. Finally, in the section from 119 to 185 dad, pH is higher for 1870 masl, with the highest rainfall and RH at
the thermal level (Figure 1D), and as reported by Minas
et al., (2018), pH variability depends on environmental
factors.
The profile at 2170 masl was the one that
presented the highest pH value of 3.58, and the most basic was at 1670 masl in Pamplonita, with 4.56, again
indicating the effect of environment in this response. These results showed that fruits of thermal level located at 2170
masl can be classified as acid (pH <4), whereas fruits of thermal level located at 1670 masl as non-acid (pH> 4) (DIRLEWANGER et al., 1999) and this value represents
the acid-base reactions in a fruit pulp mixture (LOBIT et al., 2002).
In Figure 1B, in the smaller firmness variable,
shorter segments are observed in parallelism, and appear to be visually coincident (since they are already parallel in sections), that is, the difference of averages is constant, but null at each point of time within the section, and this was perceived in all quality variables. It also indicates for
the three locations that firmness is related to resistance
during transport and the average life of the harvested
product (SILVA et al., 2016). Only horizontality was found
(without change in time), in 157-185 dad in the lower
firmness variable and in 61-103 dad for fruit pH.
The lower firmness of fruits presented differences
in thermal level in the global section (p <0.001); however,
in sections 33-72, 61-87, 87-119, 131-157 and 157-185
dad, parallelism was observed, in this way, it has similar
standards in terms of upper firmness, and in 33-72 dad, the highest minimum temperature is reached at 1670 masl. From 61 to 87 dad, lower firmness is higher for 2170 masl,
with the lowest relative humidity at the thermal level. Finally, for this thermal level, section 87-119 dad showed the lowest relative humidity and rainfall, both of which are located in the Catatumbo basin with bimodal rainfall regime. This characteristic is related to studies to evaluate quality and able to adopt measures of improvement, according to commercialization standards (MATIAS et al., 2015a).
In section 131-157 dad, lower firmness is higher
for 1870 masl, with lower minimum and maximum
temperature, higher RH and rainfall. Finally, between 157 and 185 dad, when entering stage 87, firmness is higher in 1670 masl, with higher minimum temperature, lower RH
and rainfall (Figure 1B and 1C), indicating higher degree of resistance of tissues to compression, and is considered as the main attribute used to estimate the useful life of
fruits (Cremasco et al., 2016). As the fruit grows, the
composition and organization of pectin, hemicellulosic and cellulose polysaccharides of the cell wall change, being more pronounced in fruits reaching maturity, and
is believed to be a key to explain the metabolic event
associated with maturation leading to fruit softening
(GOULAO, et al, 2007).
The upper firmness of fruits presented differences
by thermal level in the global section (p <0.001); however, in sections from 33 to 72 dad, and from 87 to 144 dad, parallelism was observed, thus, they have patterns similar
to the lower firmness, and in the section from 33 to 47 dad, the highest upper firmness is reached for 1870 masl,
located in the Orinoco basin, with monomodal rainfalls, with the lowest minimum and maximum temperature and
highest RH; from 72 to 113 dad, the upper firmness is
higher for the thermal level, with the lowest minimum and
maximum temperature and higher RH and rainfall at the
thermal level (Figure 1B and 1C), indicating that it would affect to a lesser degree the presentation of processed products (Martins et al., 2013).
The lower and upper firmness for the three thermal
levels presented linear behavior decreasing from 12.5 to
3.5 kg. cm-2 and higher in the lowest resistance values
according to data of work with post-harvest peaches by Africano et al., (2015). In relation to the firmness behavior,
the results obtained corroborate those found for tangerine by Gariglio et al. (2007).
higher (% malic acid) for 2170 masl with the lowest RH
and rainfall present at this thermal level, which would
indicate lower acceptance by the final consumer (MATIAS
et al., 2014b).
Finally, in section from 103 to 119 dad, TTA is
higher (% malic acid) for 1670 masl, with the highest minimum, maximum temperatures, lowest RH and rainfall
(Figure 1E), with fruits from the Catatumbo basin being the most acidic, which could be because they were exposed to sunlight or radiation (MATIAS et al., 2014c). This characteristic for the two levels located in the Catatumbo basin could be used to study the diversity of Jarillo peach populations due to their importance in crop improvement (COSTA E SILVA et al., 2014).
The TTA (% malic acid) content of fruits gradually decreased during growth and was directly related to the amount of organic acids present in fruits (% malic acid) and reduction in acidity as a result of metabolic changes due to the use of organic acids in the respiratory process, as reported by Maftoonazad, et al. (2008), indicating that the highest values at the beginning of growth are obtained in the lower height, together with high temperatures. They accelerate the respiratory process, and higher acidity in Catatumbo fruits would indicate lower acceptance by the
final consumer (MATIAS et al., 2014b).
The MR of fruits presented differences by thermal
level in the global section (p <0.001); however, in sections
from 61 to 87, 103 to 131 and 119 to 144 dad, parallelism was observed, thus, similar patterns in terms of MR values, and in the section from 61 to 72 dad, the highest MR was reached for 1670 masl, with the highest minimum and
maximum temperature and lowest rainfall. The section
from 72 to 87 dad showed higher MR for 1870 masl with
the lowest minimum and maximum temperatures and
highest RH in this thermal level.
At the beginning and end of section from 103
to 131 dad, MR is higher for 1870 masl, with the lowest minimum and maximum temperatures, higher RH and
rainfall, and would indicate to be associated to the low acidity of fruits in the Orinoco Basin (MATIAS et al. al., 2014b). In the middle part of section from 103 to 131 dad,
MR is the highest for 1670 masl with the lowest RH and
rainfall.
Finally, in section from 119 to 144 dad, MR is higher for 2170 masl and from 119 to 131 dad, RH is
lower, and for 1870 masl from 131 to 144 dad, the lowest
maximum and minimum temperatures, highest RH and
rainfall were observed (Figure 1F, Figure 2A, 2B and 2C). Values are similar to those found by Morais et al., (2017) for Colibri culture.
Matias et al. (2014a), Fischer et al. (2012b) and Minas et al. (2018) indicate that at higher altitudes of the thermal level (from 1,500 masl), there is less rainfall
and RH and, therefore, the TSS content (oBrix) and bark
firmness were higher at harvest time corresponding to
stage 87, as was presented at the end of thermal levels of
2170 and 1870 masl, during fruit maturation. MR tends to
increase for the three thermal levels in a lower proportion for 1870 masl, as acidity decreases and sugar contents
increase in the fruit, taking into account that the absolute
value depends on the culture analyzed (MATIAS et al.,
2017). Low MR may indicate poor quality of fruits in terms of flavor, for example, at thermal level located in Chitaga at 1870 masl, where the lowest MR was presented,
which can be considered a good indicator to obtain high quality fruits, according to Comiotto et al., (2013).
The results showed that temperature, RH and
rainfall are the climatic variables that present higher incidence in the quality characteristics of peach fruits during growth for the three thermal levels, which is in agreement with results found by Minas et al. (2018). The changes that occur during maturation at the secondary stage 87 for the three thermal levels include decreases in TTA (% malic acid) and increases in TSS (oBrix), as
reported by Walsh et al. (2007).
The behavior of the equatorial diameter, longitudinal diameter, quotient (longitudinal in relation
to equatorial diameters), upper and lower firmness, TSS
(oBrix), TTA (% malic acid) and MR helps explain that
the quality of Jarillo peaches in Pamplona is the result of a complex chain of biological processes that depend on environmental conditions represented at thermal levels, as reported by Lescourret and Génard (2005).
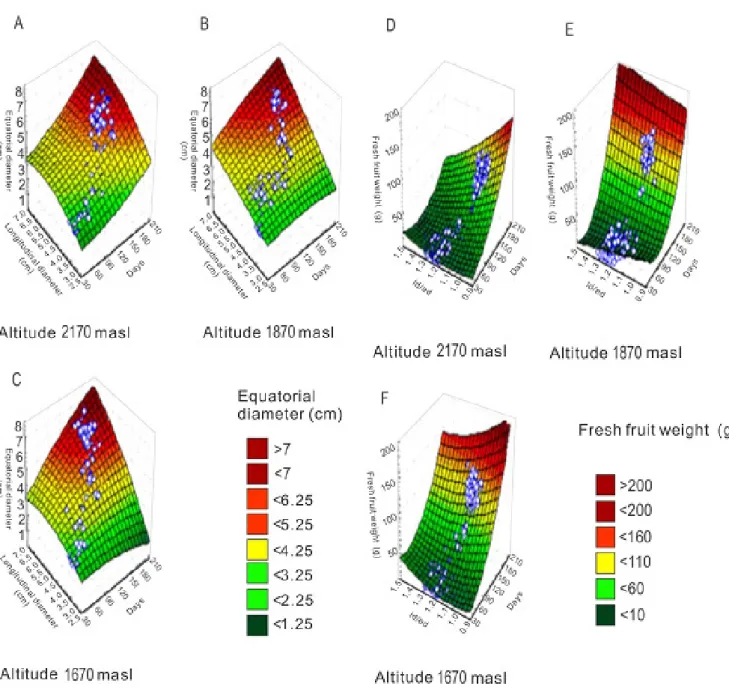
In the quadratic response surfaces of figure 3,
images A, B and C show a similar behavior, that is, the maximum equatorial diameters are found in the longitudinal
diameters and in the final times of the evaluation, that is,
between 157 and 185 dad. From 144 dad, the equatorial diameter was larger than the longitudinal diameter because in shorter times, the longitudinal diameter is larger; this pattern was characteristic in the three thermal levels, and
is within values found by Silva et al. (2016).
In the case of fresh fruit weight as a function of the ratio between diameters (longitudinal to equatorial) and measurement time, it is evident that the thermal
levels of lower altitude (1670 and 1870 masl) present the
highest fresh fruit weight of 104g and 97g, respectively, being slightly higher than those found at lower altitude in Pamplonita, which values are within values found in the
work by Silva et al. (2016).
Fruit weight is an important hereditary quantitative factor that determines production, fruit quality and
consumer acceptability, as advocated in the work of
Matias et al. (2017) and expressed in a better way by the
influence of the environment on the physiology of trees
at lower thermal levels.
according to Quevedo et al., (2017). In addition, the
calculation of the correlation coefficient between fresh
weights and the index shows a negative value, and at all levels, this value was lower than -0.70, i.e., at lower diameter rate, the fresh weight is higher, and for the index to be smaller, the equatorial fruit diameter becomes larger as fruit grows, that is, the fruit tends to be round as
described in figure 3 (3D for 3F).
The values obtained for the morphometric variables associated to the fruit in the three thermal levels
are similar to those obtained in the work by Matias et al.,
(2014a).
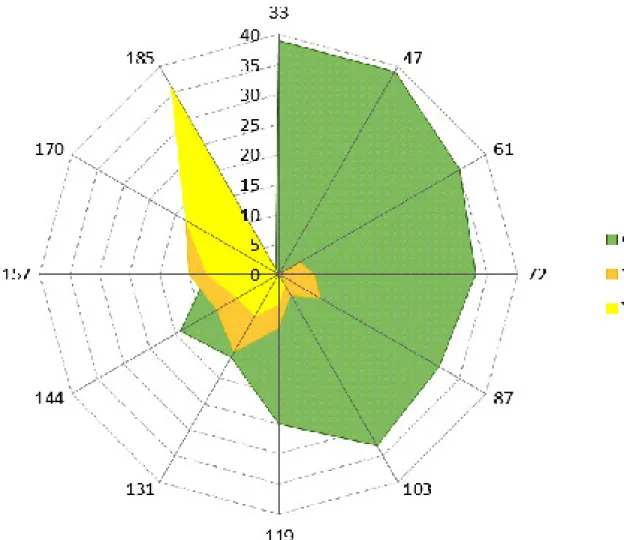
Figure 4 shows the color tone distribution of fruits, although the general case is illustrated without discriminating the thermal level, since they were similar in regions of each tone, with a slight differentiation of green color in the highest altitude level, where the green area was slightly higher.
The colors obtained by the Munsell table at maturity tend to be reddish, pale oranges, and the yellow color predominates. From 72 dad, GY nuance appears, and
finally the Y nuance at 103 dad. The yellow tone found
in the Munsell table for vegetable colors can be used as
an organoleptic crop index for the recognition of the bark color of mature fruits used to know fruit maturation, as
used by Altube, et al. (2001).
A basic color tone was found, as shown in Figure 4, where it is expected to observe the climacteric
respiratory peak at the end of maturation (Silva et al.,
2013). The predominant base color at this stage is yellow associated with carotenoid content, meteorological conditions, variety, growth conditions, such as those found
by Cremasco et al., (2016), and color intensities of peach
in order of importance were: 8/8 5 Y, Y 8.10 2.5, 5 and
8/6, and 8/8 2.5 Y, depending on the maturation degree and variety (MORAIS et al, 2017, CREMASCO et al, 2016).
As shown in Table 2 of the distribution and frequencies by thermal level until the end of the production cycle, in step 87. That is, any of the above intensities can be used as a harvest indicator, and is important in industry because pulp with intense yellow coloration does not require the addition of colorants for the production of processed beverages (MATIAS et al., 2013).
Table 1. Profiles analysis of variables quality of peach fruits Jarillo cv.
Variable Time
(days after defoliation) p_value Variable Time p_value Variable Time p_value
TSS(oBrix)
33-185 <0.001
Lower
firmness
33-185 <0.001
upper
firmnes
33-185 <0.001 87-119 0.112 33-72 0.058 33-72 0.760 131-157 0.439 61-87 0.285 87-144 0.090 157-185 0.052 87-119 0.099 144-185 0.4184
131-157 0.093 157-185 0.112
pH TTA(%) MR
33-185 <0.001 33-185 <0,001 61-87 0.168 33-185 <0.001 47-72 0.058 103-131 0.095
61-103 0.188 72-119 0.495 119-144 0.090
Table 2. Distribution, frequencies and percentages by thermal level. Color was determined by comparison with the Munsell table for vegetable colors can be used as an organoleptic crop index.
2170 masl (Pamplona)
Classes Color intensities Basic color Frequencies Percentages (%) 1 8/12,5 Y yellow 5 11.36 2 8/10 5 Y yellow 5 11.36
3 8/10 2,5 Y yellow 7 15.91
4 8/8 7 Y yellow 1 2.27
5 8/8 5 Y yellow 10 22.73
6 8/8 2.5 Y yellow 5 11.36
7 8/6 5 Y yellow 6 13.64
8 8/6 2.5 Y yellow 1 2.27
9 7/8 5 Y yellow 2 4.45
10 7/6 5 Y yellow 1 2.27
11 7/6 2.5 GY green-yellow 1 2.27 1870 masl (Chítaga)
Classes Color intensities Basic color Frequencies Percentages (%)
1 8/12 5 Y yellow 1 1.43
2 8/12 2.5 Y yellow 1 1.43
3 8/10 5 Y yellow 6 8.57
4 8/10 2.5 Y yellow 4 5.71
5 8/8 5 Y yellow 7 10
6 8/8 2.5 Y yellow 8 11.42
7 8/6 5 Y yellow 11 15.71
8 8/6 2.5 Y yellow 2 2.86
9 7/10 5 Y yellow 2 2.86 10 7/8 5 Y yellow 9 12.86 11 7/8 2.5Y yellow 5 7.14
12 7/6 5 Y yellow 7 10
13 8/6 2.5 G Y green-yellow 5 7.14 14 8/4 2.5 G Y green-yellow 1 1.43 15 7/6 2.5 G Y green-yellow 1 1.43
1670 masl (Pamplonita)
Classes Color intensities Basic color Frequencies Percentages (%)
1 8/12 5 Y yellow 3 7.3
2 8/12 2.5 Y yellow 2 4.88 3 8/10 5 Y yellow 4 9.76
4 8/10 2.5 Y yellow 7 17.07
5 8/8 5 Y yellow 6 14.63
6 8/8 2.5 Y yellow 1 2.44
7 8/6 5 Y yellow 4 9.76
8 7/10 5Y yellow 2 4.88
9 7/8 5 Y yellow 6 14.63
10 7/8 2.5 Y yellow 3 7.3
11 7/6 5 Y yellow 2 4.88
Figure 1. Profiles of soluble solids (TSS (°Brix)) (A), upper (B) and lower (C) firmness, pH (D), TTA (% malic acid)
Figure 4. Advancement of peach fruit color according to evaluation times.
Conclusions
The results showed that temperature, relative
humidity (RH) and rainfall are the climatic variables that
present higher incidence in the quality characteristics of Jarillo peach during growth for the three thermal levels. The changes occurring during maturation in the seconda-ry stage 87 for the three thermal levels include decreases in TTA (% malic acid) and increase in TSS (oBrix). The two thermal levels located in the Catatumbo basin pre-sented higher TTA (% malic acid).
The lowest MR (Maturation Rate) was shown in
the Orinoco Basin, thermal level located at 1870 masl in Chitagá.
Up to 61 dad, Jarillo peach fruits have green tone at the three thermal levels, and from 61 to 87 dad, YR
tone appears, and at 119 dad, the yellow tone appears (Y). Only a slight delay in yellowing is perceived at the highest thermal level.
References
AFRICANO, P.K.L.; ALMANZA-MERCHÁN, P.J.; BALAGUERA-LÓPEZ, H.E. Fisiología y bioquímica de la maduración del fruto de durazno [P. persica (L.)
Batsch]. Una Revisión. Revista Colombiana de Ciencias Hortícolas, Yunja, v.9, n.1, p.161-172, 2015. (1)
ALTUBE, H.; BUDDE, C.; ONTIVERO, M.; RIVATA, R. Determinación de los índices de cosecha de duraznos cvs. Flordaking y San Pedro 16-33. Agricultura Técnica,
Chile, v.61, n.2, p.140-150, 2001. (1)
AOAC. Official methods of analysis of the Association
of Official Analytical Chemists Internacional. 8th ed.
Maryland, 1995. (2)
AOAC. Official methods of analysis of the Association
of Official Analytical Chemists Internacional. 18th ed.
CHEN, H.; JIANG, L.; AN, X.; KANG, R.; YU, M.; MA, R. Potential role of glutathione peroxidase gene
family in peach fruit ripening under combined postharvest treatment with heat and 1-MCP. Postharvest Biology and Technology, Westport, v.111, p.175-184, 2016. (1)
COMIOTTO, A; FACHINELLO J. C.; HOFFMANN, A.; PADILHA S.G.; PORTELLA, N.M.; ERNANI, M.P.; BOTH, L.H. Desenvolvimento, produção e qualidade dos
frutos de pessegueiros enxertados sobre diferentes porta-enxertos. Semina: Ciências Agrárias, Londrina, v.34,
n.6, p.3553-3562, 2013. supl.1 (1)
COSTA E SILVA, J.O.; CREMASCO, J.P.G.; MATIAS, R.G.P.; SILVA, D.F.P.; SALAZAR, A.H.; BRUCKNER, C.H. Divergência genética entre populações de pessegueiro
baseada em características da planta e do fruto. Ciência Rural, Santa Maria, v.44, n.10, p.1770-1775, 2014. (1)
CREMASCO, J.P.G.; MATIAS, R.G.P.; SILVA, D.F.P.; OLIVEIRA, J.A.A.; BRUCKNER, C.H. Qualidade
pós-colheita de oito variedades de pêssego. Comunicata Scientiae, Bom Jesus, v.7, n.3, p.334-342, 2016. Disponível em: <https://www.comunicatascientiae.com. br/comunicata/article/view/1404. Acesso em: 27 maio 2018. (1)
DIRLEWANGER, E; MOING, A; ROTHAN, C; SVANELLA, L; PRONIER, V; GUYE, A; PLOMION, C; MONET, R. Mapping QTLs controlling fruit quality in peach [P. persica (L.) Batsch]. Theoretical and Applied Genetics, Berlin, v.98, p.18–31, 1999. (1)
FISCHER, G.; ALMANZA-MERCHÁN, P.J.; RAMÍREZ, F. Source-sink relationships in fruit species. A review.
Revista Colombiana de Ciencias Hortícolas, Tunya,
v.6, n.2, p.238-253, 2012a. (1)
FISCHER, G.; CASIERRA-POSADA, F.; VILLAMIZAR, C.Q. Producción forzada de duraznero (P. persica (L.) Batsch) en el altiplano tropical de Boyacá (Colombia).
Revista Colombiana de Ciencias Hortícolas, Tunya, v.4, n.1, p.19-32, 2010. (1)
FISCHER, G.; RAMÍREZ F.; ALMANZA-MERCHÁN, P. J. Inducción floral, floración y desarrollo del fruto. In: FISCHER , G. (Ed.). Manual para el cultivo de frutales en el trópico. Bogotá: Produmedios, 2012b. p.120-140.
(2)
FRUK, G.; CEMELÍK, Z.; JEMRIC, T.; HRIBAR, J.; VIDRIH, R. Pectin role in woolliness development in
peaches and nectarines: A review. Scientia Horticulturae,
The Hague, v.180, p.1-5. 2014. (1)
GALINDO, A.; RODRÍGUEZ, P.; COLLADO-GONZÁLEZ, J.; CRUZ, Z. N.; TORRECILLAS, E.; LONDOÑO, S.; CORELL, M.; MORIANA, A.; TORRECILLAS, A. Rainfall intensifies fruit peel cracking
in water stressed pome granate trees. Agricultural and Forest Meteorology, Amsterdam, v. 194, p. 29–35, 2014.
(1)
GARIGLIO, N.F.; PILATTI, R.A.; AGUSTÍ, M. Requerimientos ecofisiológicos de los árboles frutales.
In: SOZZI, G.O. Árboles frutales: ecofisiologia, cultivo
y aprovechamiento. Buenos Aires: Editorial Facultad de
Agronomía, Universidad de Buenos Aires, 2007. p.
41-82. (1)
GOULAO, L.F.; SANTOS, J.; SOUSA, I.D.; OLIVEIRA,
C.M. Patterns of enzymatic activity of cell wall-modifying enzymes during growth and ripening of apples.
Postharvest Biology and Technology, Westport, v.43, n.3, p.307-318, 2007. (1)
GRUDA, N. Impact of environmental factors on product
quality of greenhouse vegetables for fresh consumption. Critical Reviews in Plant Sciences, London, v.24, n.3, p. 227-247, 2005. (1)
IGAC - Instituto Geográfico Agustín Codazzi. Estudio
general de suelos y zonificación de tierras. 2nd ed.
Bogotá: Del Departamento de Norte de Santander, 2006.
359 p.
LESCOURRET, F.; GÉNARD, M. A virtual peach fruit model simulating changes in fruit quality during the final
stage of fruit growth. Tree Physiology, Victoria, v.25,
p.1303–1315, 2005. (1)
LOBIT, P.; SOING, P.; GÉNARD, M.; HABIB, R.
Theorical analysis of relationships between composition, Ph, and titratable acidity of Peach fruit. Journal of Plant Nutrition,New York, v.25, n.12, p.2775- 2792, 2002. (1)
MAFTOONAZAD, N.; RAMASWAMY, H.S.; MARCOTTE, M. Shelf-life extension of peaches through
sodium alginate and methyl cellulose edible coatings.
International Journal of Food Science and Technology,
MARTÍNEZ-VEGA, R.R.; FISCHER, G.; HERRERA, A.; CHAVES, B.; QUINTERO, O.C. Características físico-químicas de frutos de feijoa influenciadas por la posición en el canopi. Revista Colombiana de Ciencias Hortícolas, Tunya, v.2, n.1, p.21-32, 2008. (1)
MARTINS, R.N.; MATTIUZ, B.-H.; SANTOS, L.O.; HOJO, E.T.D.; MATTIUZ.C.F.M. Estádios de maturação de pêssegos ‘aurora-1’ para o processamento mínimo.
Revista Brasileira de Fruticultura, Jaboticabal, v.35, n.2, p.391-397, 2013. (1)
MATIAS, R.G.P., RIBEIRO, M.R.; SILVA, D.F.P.; COSTA E SILVA, J.O.; OLIVEIRA, S.P.; BRUCKNER, C.H.
Características físicas e químicas de pêssego em função da altura de inserção na planta. Comunicata Scientiae, Bom Jesus,v.5, n.4, p.435-440, 2014c. Disponível em: <https://www.comunicatascientiae.com.br/comunicata/ article/view/409>. Acesso em: 27 maio 2018. (1)
MATIAS, R.G.P., SILVA, D.F.P.; COSTA E SILVA, J.O.; OLIVEIRA, J.A.A.; CREMASCO, J.P.G.; BRUCKNER, C.H. Qualidade de nectarinas produzidas em região de
clima subtropical. Revista Ceres, Viçosa, MG, v.62, n.6,
p.621-626, 2015a. Disponível em: <http://www.redalyc.
org/pdf/3052/305242978016.pdf>. Acesso em: 27 maio 2018. (1)
MATIAS, R.G.P.; BRUCKNER, C.H.; PEREIRA SILVA, D.F.; CARNEIRO, P.C.S.; COSTA E SILVA, J.O. Repetibilidade de caracteres de fruto em pessegueiro.
Revista Brasileira de Fruticultura, Jaboticabal, v.37, n.4, p.1001-1008, 2015b. (1)
MATIAS, R.G.P.; BRUCKNER, C.H.; SILVA, D.F.P.; CARNEIRO, P.C.S.; OLIVEIRA, J.A.A. Adaptability and
stability of peach and nectarine cultivars in subtropical climate. Revista Ceres, Viçosa, MG, v.64, v.5,
p.516-522, 2017. (1)
MATIAS, R.G.P.; PICOLOTTO, L.; QUINTANILHA, F.A.; COCCO, C; CORREA, L.E.A. Qualidade de fruto
e produtividade de pessegueiros submetidos a diferentes épocas de poda. Ciência Rural, Santa Maria, v.44, n.8, p.1334-1340, 2014a. (1)
MATIAS, R.G.P.; SILVA, D.F.P.; E SILVA C.E J.O.; DE OLIVEIRA, S.P.; RIBEIRO, M.R.; BRUCKNER, C.H.
Caracterização de frutos de cultivares de pessegueiro na Zona da Mata Mineira. Revista Brasileira de Ciências Agrárias, Recife, v.8, n.3, p.416-420, 2013.
Disponível em: <http://www.redalyc.org/articulo.
oa?id=119028125010>. Acesso em: 27 maio 2018. (1)
MATIAS, R.G.P.; SILVA, D.F.P.; MIRANDA, P.M.D.; OLIVEIRA, J.A.A.; PIMENTEL, L.D.; BRUCKNER, C.H. Relationship between fruit traits and contents of
ascorbic acid and carotenoids in peach. Crop Breeding and Applied Biotechnology, Londrina,v.16, p.348-354,
2016. (1)
MATIAS, R.G.P.; SILVA, D.F.P.; RIBEIRO, M.R.; COSTA E SILVA, J.O.; OLIVEIRA, S.P.; BRUCKNER, C.H. Características de frutos de pessegueiros cultivados
na Zona da Mata de Minas Gerais. Ciência Rural, Santa
Maria, v.44, n.6, p.971-974, 2014b. (1)
MINAS, I. S.; TANOU, G.; MOLASSIOTIS, A.
Enviromental and orchard bases of peach fruit quality.
Scientia Horticulturae, New York, v.235, p.307-322.
2018. (1)
MINASNY, B.; MALONE, B.P.; MCBRATNEY, A.B.
Digital soil assessment and beyond. 8th ed. London: CRC
Press, 2012. 482 p. (2)
MONTERO, F, J. Manual abreviado de análisis estadístico multivariante. Badajoz: Universidad de
Extremadura, 2018. 96 p. (2)
MORAIS, K.D.B; XAVIER, B.DA S.; SILVA, D.F.P.; OLIVEIRA, J.A. A.; BRUCKNER, C.H. Avaliação física
e química de frutos de cultivares de pessegueiro. Revista Engenharia na Agricultura, Viçosa, MG, v.25, n.2,
p.157-163, 2017. (1)
MOUNZER, O.H.; CONEJERO, W.; NICOLA´S, E.; ABRISQUETA. I.; GARCÍA-ORELLANA, Y.V.; TAPIA, L.M.; VERA, J.; ABRISQUETA, J.M.; RUIZ-SÁNCHEZ,
M. DEL C. Growth pattern and phenological stages of early-maturing peach trees under a mediterranean climate.
Hortscience, Mt.Vernon, v.43, n.6, p.1813–1818, 2008. 1)
MUNSELL. Munsell color charts for plant tissues.
2nd ed. Baltimore: Macbeth Division of Kollmorgen
Corporation, 1977. 6 p. (2)
PINZÓN, E.H.; CRUZ M.A.; FISCHER G. 2014. Aspectos fisiológicos del duraznero (P. persica (L.)
Batsch) en el trópico alto. Una revisión. Revista UDCA
QUEVEDO, G.E.; DARGHAN, A.E.; FISCHER, G. Clasificación de variables morfológicas del duraznero (P. persica L. Batsch) ‘Jarillo’ en la montaña santandereana
colombiana mediante análisis discriminante lineal.
Revista Colombiana de Ciencias Hortícolas, Tunja, v.11, n.1, p.39-47, 2017. (1)
REGINA, M. DE A.; LOPES DO CARMO, E.; FONSECA, A.R.; PURGATTO, E.; SHIGA, T.M.; LAJOLO, F.M.; RIBEIRO, A.P.; VIEIRA DA MOTA, R. Influência da altitude na qualidade das uvas ‘Chardonnay’ e ‘Pinot Noir’ em Minas Gerais. Revista Brasileira de Fruticultura, Jaboticabal, v.32, n.1, p.143-150, 2010. (1)
SANTIAGO-MEJÍA, E.; CORTÉS – FLORES J.I.; TURRENT- FERNÁNDEZ A.; E.HERNÁNDEZ- ROMERO E.; JAEN- CONTRERAS D. Calidad del fruto
del Duraznero en el sistema Milpa intercalada con árboles frutales en laderas. Agricultura Técnica en México,
Texcoco, v.34, n.2, p.159-166, 2008. (1)
SILVA, D.F.P.; COSTA E SILVA, J.O.; MATIAS,
R.G.P.; RIBEIRO, M.R.; BRUCKNER, C.H. Curva de crescimento e padrão respiratório de frutos de genótipos
de pessegueiro em região de clima subtropical. Revista Brasileira de Fruticultura, Jaboticabal, v.35, n.2,
p.642-649, 2013. Comunicação científica. (1)
SILVA, D.F.P.; MATIAS, R.G.P.; COSTA E SILVA, J.O.; SALAZAR, A.H.; BRUCKNER, C.H. Characterization of white-fleshed peach cultivars grown in the ‘Zona da Mata’ area of Minas Gerais State, Brazil. Comunicata Scientiae, Bom Jesus, v.7, n.1, p.149-153, 2016.
Disponível em: <https://www.comunicatascientiae.com.
br/comunicata/article/viewFile/781/390>. Acesso em: 27 maio 2018. (5)
WALSH, K.B.; LONG, R.L.; MIDDLETON, S.G. Use of near infra-red spectroscopy in evaluation of source-sink
manipulation to increase the soluble sugar content of Stone fruit. Journal Horticultural Science and Biotechnology,