Ciência e Agrotecnologia 41(2):147-158, Mar/Apr. 2017
2017 | Lavras | Editora UFLA | www.editora.ufla.br | www.scielo.br/cagro
All the contents of this journal, except where otherwise noted, is licensed under a Creative Commons Attribution License attribuition-type BY. http://dx.doi.org/10.1590/1413-70542017412010116
Genetic variability in elite barley genotypes based on the
agro-morphological characteristics evaluated under irrigated system
Variabilidade genética de genótipos elite de cevada com base em características morfo agronômicas avaliadas em sistema de produção irrigado
Renato Fernando Amabile1*, Fábio Gelape Faleiro1, Flávio Capettini2, José Ricardo Peixoto3, Ricardo Meneses Sayd3
1Empresa Brasileira de Pesquisa Agropecuária/Embrapa Cerrados, Planaltina, DF, Brasil 2Field Crop Development Centre, Lacombe, Alberta, Canada
3Universidade de Brasília/UnB, Faculdade de Agronomia e Medicina Veterinária/FAV, Brasília, DF, Brasil *Corresponding author: renato.amabile@embrapa.br
Received in July 8, 2016 and approved in October 10, 2016
ABSTRACT
Recently, researches have shown that the Brazilian savannah has a great potential to supply the demand for barley grains. The purpose of this study was to assess the genetic variability in 39 elite barley (Hordeum vulgare L.) genotypes based on the agro-morphological traits of a crop irrigated in the savannah system. An irrigation experiment in the design of complete randomized block with four replicates was conducted at Federal District – Brazil. The evaluated traits were: distance from the last knot to the rachis, distance from the flag leaf to rachis, spike length, number of grains by ear, flag leaf area, plant height, silking, lodging, grain yield, thousand-seed weight, protein content and grain commercial classification. After using analysis of variance the means were used to estimate the genetic dissimilarity among all genotypes pairs based on the Mahalanobis’ generalized distance. Cluster analysis using genetic distance matrix was performed having Unweighted Pair Group Method using Arithmetic Means method (UPGMA) as the criteria. Highly significant differences were found
among the genotypes for all traits evaluated. The high coefficient of genetic variation indicates the possibility of having genetic gains for all traits. The traits that most contributed to the variability were the flag leaf area and silking, while the protein content and lodging were the traits that contributed the least. Based on the cluster analysis, at least three major groups of similarity were found. There was a clustering trend of two and six-rowed materials. The most divergent genotypes were PFC 2005123, Antártica-1, Nandi and FM 404.
Index terms: Genetic diversity; Hordeum vulgare L.;genetic resources; savannah.
RESUMO
Recentemente, pesquisas tem demonstrado que o Cerrado tem grande potencial para suprir a demanda de cevada. O objetivo deste trabalho foi avaliar a variabilidade genética de 39 genótipos elite de cevada com base em características morfoagronômicas avaliadas em sistema de produção irrigado no Cerrado. O experimento foi conduzido num delineamento de blocos ao acaso com quatro repetições no Distrito Federal – Brasil. Avaliaram-se as características: distância do último nó à ráquis, distância da folha bandeira à ráquis, comprimento da espiga, número de grãos por espiga, área da folha bandeira, altura de plantas, espigamento, grau de acamamento, rendimento de grãos, peso de mil sementes, teor de proteína e classificação comercial de grãos. Após análise de variância as médias foram utilizadas para estimar a dissimilaridade genética, com base na distância generalizada de Mahalanobis. Utilizando a matriz de distâncias genéticas foram realizadas análises de agrupamento. Foram observadas diferenças altamente significativas entre os genótipos para todas as características avaliadas. O elevado coeficiente de variação genético evidencia a possibilidade de obter ganhos genéticos para todas características. Através das análises de agrupamento, verificou-se a formação de pelo menos três grandes grupos de similaridade. Houve tendência de agrupamento dos materiais dísticos e hexásticos. Os genótipos PFC 2005123, Antártica-1, Nandi e FM 404 foram os mais divergentes.
Termos para indexação: Diversidade genética; Hordeum vulgare L.; recursos genéticos; Cerrado.
INTRODUCTION
Barley was introduced in the savannah as a winter crop. The main purpose was to meet the demand for malt and provide farmers an alternative to diversify and integrate the irrigated production system ensuring a more stable total yield. Recently, researches have shown that the Brazilian savannah has a great potential to supply the demand for barley grains, giving a chance and opening new frontiers
for the agriculture business, including new commercial opportunities (Amabile et al., 2013).
Ciência e Agrotecnologia 41(2):147-158, Mar/Apr. 2017
148 AMABILE, R. F. et al.
genetic variability, as well as search for better gene combinations in the progenies (Ahmad et al., 2008; Cruz; Regazzi; Carneiro, 2004; Falconer; Mackay, 1996).
Studies indicate the use of a high existing variability in the germplasm worldwide (Manjunatha et al., 2007; Molina-Cano et al., 1997; Verma; Sarkar, 2010), and considering the existence of a high genetic variability, the use of a barley germplasm with an industrial quality might be widely tested
when selecting superior genotypes for specific environments.
However, in Brazil, and especially in the savannah, there are only few studies about the barley genetic variability. The techniques of multivariate analysis are often used in genetic improvement programs to predict the genetic diversity among the accesses (Sneath; Sokal, 1973). And the dissimilarity measurements previously estimated and, among these averages, the Mahalanobis’ generalized distance (D2)
has been evidenced as a successful tool when studying the barley genetic divergence (Alam et al., 2007; Karim et al.,
2010; Kuczyńska et al., 2007; Setotaw; Dias; Missio, 2010).
According to this context, the purpose of this research was to study and quantify the genetic variability of 39 barley elite accesses based on the agro-morphological traits, yield components and protein content evaluated in a crop grown in the savannah using an irrigation system.
MATERIAL AND METHODS
The present study was carried out in an Experiment Station, at Planaltina - DF, located at 15°35’30” S latitude, 47°42’30” E longitude and 1.007 m.a.s.l. It was performed using a conventional irrigation system. The
soil was classified as dystroferric Oxisol, clay texture and
the results of chemical and physical analysis of the soil, indicated the lack of Al; 38.2 mmolc dm-3 Ca; 8.4 mmol
c
dm-3 Mg; 24.69 mg kg-1 P; 6.8 mmol c dm
-3 K; 23.0 g kg-1
O.M.; and a pH (water) of 6.07; coarse sand = 60 g kg -1; fine
sand = 380 g kg-1; silt = 130 g kg-1 and clay = 430 g kg-1.
According to the classification of Köoppen, the area is
located in a morphoclimatic domain of the savannah, with a tropical seasonal climate, where the weather data during the study included a minimum, average and maximum air temperature of 13.8 °C, 20.7 °C and 27.9 °C, respectively; minimum, average and maximum air humidity of 30%, 54% and 79%; air speed of 1.9 m s-1, 444.9 cal cm-2/day
of solar radiation and lack of rain.
Thirty-nine elite, two and six-rowed barley genotypes from a Working Collection, from different origins: Brazilian (two-rowed genotypes: PFC 2001090, CEV 96046, PFC 213660, PFC 99318, PFC 213106, PFC 2003122, PFC 2005123, PFC 2004345, PFC 2001049,
BRS 195, BRS Sampa, PFC 2004216, BRS Elis, BRS Greta, PFC 2004033, PFC 214827-10, Antártica-1, FM 404 and BRS Deméter; six-rowed genotypes: PFC 99324 and PFC 98252); English (two-rowed genotypes: Alliot Cellar Prestige); Mexican (six-rowed genotypes: CPAC 20011, CIMMYT 42, CIMMYT 48, CIMMYT 2, CIMMYT 25, CPAC 20020098 and Vicente Morales); American (two-rowed genotypes: C-70 and M 14; six-rowed genotypes: Lacey, Foster and BRS 180); German (two-rowed genotypes: Scarlett and Danuta) and the Australian six-rowed genotype Nandi. The cultivars BRS 180 (six-rowed) and BRS 195 (two-rowed) were used as checks. The criterion used to select these 39 barley genotypes for the study was to use the elite work collection exploring genotypes from different countries.
The experiment design of complete randomized block with four replicates was the one chosen. The
plot with six lines of five meters long and spacing of
20 cm was used with a useful area of 4.8 m2 for each
spot, with a density of 300 plants by m-2. The soil was
prepared by adding soy culture debris, using 32” disk plows, followed by the use of a 20” leveling disk. The herbicide Pendimethalin [N-(1-ethylpropyl)-2, 6-dinitro-3, 4-xylidine] in a pre-emergency situation was used (dose of 3.0 L ha-1). According to the results from the soil analysis,
16 kg ha-1 N; 120 kg ha-1 P
2O5; 64 kg ha -1 K
2O and 40
kg ha-1 N were used in the seeding when the fifth leaf is
present and totally.
Sprinkler irrigations were made based on the
volumetric soil water content (θ), measured by a profile
probe (Profile probe Delta-T) placed in the planting line (0.10 m; 0.20 m and 0.30 m deep). The irrigations were made when moisture at 0.10 meters deep was approximately 0.26 cm3 cm-3, which corresponded to the
consumption of 50% of the available water. The amount of irrigation water was calculated based on daily readings
of the probe in order to increase moisture in the soil profile from 0 to 0.35 m to the field capacity (0.35 cm3 cm-3), with
a total of 420 mm of net irrigation depth during the study. The following traits of the main stem were evaluated: 1. DNR – distance from the last knot to the rachis (cm); 2.
DFBR – distance from the flag leaf to the rachis (cm); 3. CESP
- ear length (cm); 4. NGESP – number of grains by ear; 5.
AFB – flag leaf area – during the linear phase of grain filling,
where the area was determined by the ImageJ program 1997 (public domain); 6. ESP – heading (50% of the ears, useful, visible plot area), in days; 7. ALT – plant height (cm); and: 1. ACAM – lodging (data transformed in arcsen x0,5.100-1,
Genetic variability in elite barley genotypes based on the agro-morphological characteristics evaluated under irrigated system 149
Ciência e Agrotecnologia 41(2):147-158, Mar/Apr. 2017 4. PROT - protein content (%), using the Kjeldahl method
(Yasuhara; Nokihara, 2001) and 5. CLASS - first commercial classification (larger than 2.5 mm) (%).
All data were evaluated using the analysis of
variance and the significance was set through the F test
(p < 0.01). The means were clustered using the Scott-Knott
test at significance level of 1% (Scott; Knott, 1974). The coefficients of experimental variation (CVe), coefficients of genetic variation (CVg) and coefficient of relative variation
(CVr) for each trait were estimated by using Genes program (Cruz, 2007). In order to perform the analysis of variance, the following statistic model was considered: Yij = m + Gi + Bj + eij, where: Yij = value obtained related to the ith genotype characteristic in the jth block; m = general average; Gi = effect of ith genotype (i = 1,2,..., g); Bj = effect of jth block (j = 1,2,...,r); eij = random error (uncontrolled factors) and eij ~ NID (0,σ2).
The genetic dissimilarity among all pairs of accesses was estimated by Mahalanobis’ generalized distance (D2 ij), (Cruz; Regazzi; Carneiro, 2004). Cluster analysis was made considering the genetic distance matrix through a dendrogram and using the UPGMA as the clustering criteria (Sneath; Sokal, 1973). A scatter plot was made based on multidimensional scales using the principal coordinate analysis, SAS (SAS Institute Inc., Statistical Analysis System, version® 6.4.2, 2008) and Statistic
program (Statsoft Inc., Statistics for Windows, 1999).
The coefficient of cophenetic correlation (r) of the
original genetic distances and those represented by the dendrogram among the accesses pairs were calculated to estimate the adjustment between the dissimilarity matrix and dendrogram generated, according to Sokal and Rohlf (1962), through the computer program Numerical Taxonomy and Multivariate Analysis System, NTSYS (Exeter Software version 2.1, 2000) (Rohlf, 2000). The relative contribution of the traits evaluated for their genetic diversity with the aid of Genes program (Genes Software for experimental statistics in genetics, Windows 7 version) (Cruz, 2007) was estimated through the Singh method (Singh, 1981).
RESULTS AND DISCUSSION
Variance analysis showed highly significant differences among the genotypes, indicating the existence of a genetic variability of elite barley accesses related to the traits studied (Table 1). This variability was expected considering that the Work Collection is composed of six and two-rowed accesses with different origins. Besides the genetic differences also found by Manjunatha et al. (2007), Molina-Cano et al.
(1997), Verma and Sarkar (2010) and Žáková and Benková
(2006) the different response from the genotypes to diversified
environments, that is, the genotype-environment interaction might increase the variation of quantitative traits in different barley accesses (Molina-Cano et al., 1997).
The experiment showed an adequate experimental precision according to Resende and Duarte (2007) once the F values were greater than 2.0 (Table 1). When considering
the coefficients of environmental variation (CEv), the values
of small magnitude, except for the ones observed for traits ACAM and DFBR (Table 1), also indicated an adequate
experimental precision. Žáková and Benková (2006) have
already evidenced high values of lodging, since the trait is
strongly influenced by the environment, being difficult to
determine because of the lack of visual acuity.
High values of heritability and CVg are essential concerning the genotypic value of the genetic material based on phenotypic evaluations. The ratio CVg/CVe
that quantifies the available genotypic variability and
determines the possibilities of success of the genetic improvement (Vencovsky, 1987) was higher than one unity
for several traits, except for PROT and ACAM (Table 1). Statistically significant differences were found
among the means of barley accesses by using the Scott -
Knott test at 1% of significance for all traits (Table 1). The
cluster of means showed there were two to nine groups of similarity. The traits with less number of means were protein content and lodging and the trait with the highest
number of groups were flag leaf area.
The mean distance from the last knot to the rachis (DNR) was 21.97 cm, ranging from 14.4 cm for cultivar
Prestige to 30.8 cm (CIMMYT 48), where five groups were identified through the Scott-Knott test (Table 1).
According to Pinthus (1973), the internodal distance, due to its structure and morphological characteristic, might promote the lodging. However, the lodging was present in all groups regardless of the DNR distance.
The mean distance from the flag leaf to the rachis
(DFBR) was 0.363 cm, having the genotype PFC 2004216 presenting a negative trend of the ear in relation to the
flag leaf (-5.53 cm). The American cultivar Foster showed
a positive spike (0.04 cm). All American and Mexican genotypes showed a similar positive behavior, regardless of being two or six-rowed or being in distinct groups according to Scott-Knott test. Currently, the Brazilian barley program has tried to select genotypes with a negative extrusion since
it would allow the lodging because the flag leaf protects the
Ciência e Agrotecnologia 41(2):147-158, Mar/Apr. 2017 150
AMABILE, R. F. et al.
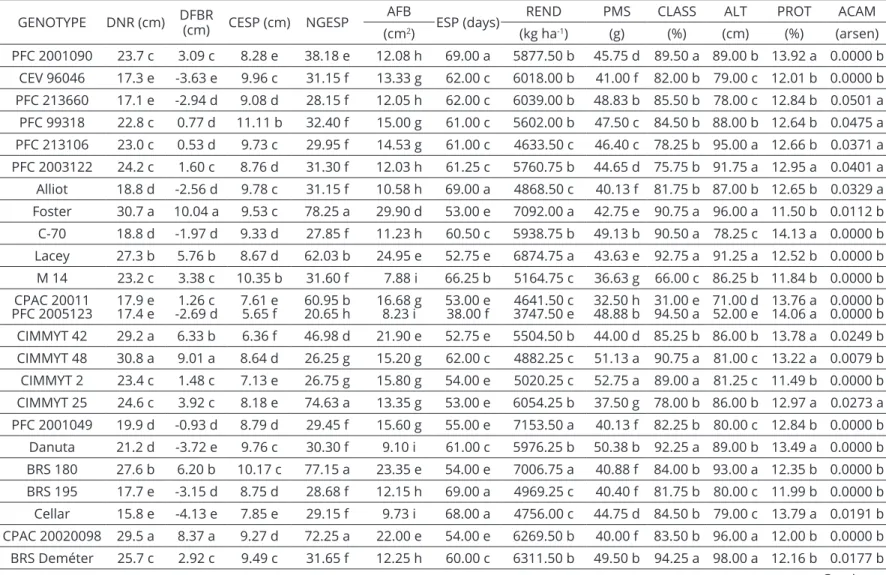
Table 1: Averages for the distance from the first knot to the rachis (DNR), distance from the flag leaf to rachis (DFBR), spike length (CESP), number of grains by ear (NGESP), flag leaf area (AFB), silking (ESP), grain yield (REND), thousand-seed weight (PMS), grain commercial classification (CLASS), plant height (ALT), total protein content (PROT) and lodging (ACAM) in 39 barley genotypes evaluated through the Scott-Knott test at 1%
and heritability estimates at mean level ( 2
a
h ), coefficients of genetic (CVg) and environmental variation (CVe) and relative contribution for genetic diversity variation (CRDG).
GENOTYPE DNR (cm) DFBR
(cm) CESP (cm) NGESP
AFB
ESP (days) REND PMS CLASS ALT PROT ACAM
(cm2) (kg ha-1) (g) (%) (cm) (%) (arsen)
PFC 2001090 23.7 c 3.09 c 8.28 e 38.18 e 12.08 h 69.00 a 5877.50 b 45.75 d 89.50 a 89.00 b 13.92 a 0.0000 b
CEV 96046 17.3 e -3.63 e 9.96 c 31.15 f 13.33 g 62.00 c 6018.00 b 41.00 f 82.00 b 79.00 c 12.01 b 0.0000 b
PFC 213660 17.1 e -2.94 d 9.08 d 28.15 f 12.05 h 62.00 c 6039.00 b 48.83 b 85.50 b 78.00 c 12.84 b 0.0501 a
PFC 99318 22.8 c 0.77 d 11.11 b 32.40 f 15.00 g 61.00 c 5602.00 b 47.50 c 84.50 b 88.00 b 12.64 b 0.0475 a
PFC 213106 23.0 c 0.53 d 9.73 c 29.95 f 14.53 g 61.00 c 4633.50 c 46.40 c 78.25 b 95.00 a 12.66 b 0.0371 a
PFC 2003122 24.2 c 1.60 c 8.76 d 31.30 f 12.03 h 61.25 c 5760.75 b 44.65 d 75.75 b 91.75 a 12.95 a 0.0401 a
Alliot 18.8 d -2.56 d 9.78 c 31.15 f 10.58 h 69.00 a 4868.50 c 40.13 f 81.75 b 87.00 b 12.65 b 0.0329 a
Foster 30.7 a 10.04 a 9.53 c 78.25 a 29.90 d 53.00 e 7092.00 a 42.75 e 90.75 a 96.00 a 11.50 b 0.0112 b
C-70 18.8 d -1.97 d 9.33 d 27.85 f 11.23 h 60.50 c 5938.75 b 49.13 b 90.50 a 78.25 c 14.13 a 0.0000 b
Lacey 27.3 b 5.76 b 8.67 d 62.03 b 24.95 e 52.75 e 6874.75 a 43.63 e 92.75 a 91.25 a 12.52 b 0.0000 b
M 14 23.2 c 3.38 c 10.35 b 31.60 f 7.88 i 66.25 b 5164.75 c 36.63 g 66.00 c 86.25 b 11.84 b 0.0000 b
CPAC 20011
PFC 2005123 17.9 e17.4 e -2.69 d1.26 c 7.61 e5.65 f 60.95 b20.65 h 16.68 g 8.23 i 53.00 e38.00 f 3747.50 e4641.50 c 32.50 h48.88 b 31.00 e94.50 a 71.00 d52.00 e 13.76 a14.06 a 0.0000 b0.0000 b
CIMMYT 42 29.2 a 6.33 b 6.36 f 46.98 d 21.90 e 52.75 e 5504.50 b 44.00 d 85.25 b 86.00 b 13.78 a 0.0249 b
CIMMYT 48 30.8 a 9.01 a 8.64 d 26.25 g 15.20 g 62.00 c 4882.25 c 51.13 a 90.75 a 81.00 c 13.22 a 0.0079 b
CIMMYT 2 23.4 c 1.48 c 7.13 e 26.75 g 15.80 g 54.00 e 5020.25 c 52.75 a 89.00 a 81.25 c 11.49 b 0.0000 b
CIMMYT 25 24.6 c 3.92 c 8.18 e 74.63 a 13.35 g 53.00 e 6054.25 b 37.50 g 78.00 b 86.00 b 12.97 a 0.0273 a
PFC 2001049 19.9 d -0.93 d 8.79 d 29.45 f 15.60 g 55.00 e 7153.50 a 40.13 f 82.25 b 80.00 c 12.84 b 0.0000 b
Danuta 21.2 d -3.72 e 9.76 c 30.30 f 9.10 i 61.00 c 5976.25 b 50.38 b 92.25 a 89.00 b 13.49 a 0.0000 b
BRS 180 27.6 b 6.20 b 10.17 c 77.15 a 23.35 e 54.00 e 7006.75 a 40.88 f 84.00 b 93.00 a 12.35 b 0.0000 b
BRS 195 17.7 e -3.15 d 8.75 d 28.68 f 12.15 h 69.00 a 4969.25 c 40.40 f 81.75 b 80.00 c 11.99 b 0.0000 b
Cellar 15.8 e -4.13 e 7.85 e 29.15 f 9.73 i 68.00 a 4756.00 c 44.75 d 84.50 b 79.00 c 13.79 a 0.0191 b
CPAC 20020098 29.5 a 8.37 a 9.27 d 72.25 a 22.00 e 54.00 e 6269.50 b 40.00 f 83.50 b 96.00 a 12.00 b 0.0000 b
Genetic variability in elite barley genotypes based on the agro-morphological characteristics evaluated under irrigated system
151
Ciência e Agrotecnologia 41(2):147-158, Mar/Apr. 2017
** Significant at 1% by F Test.
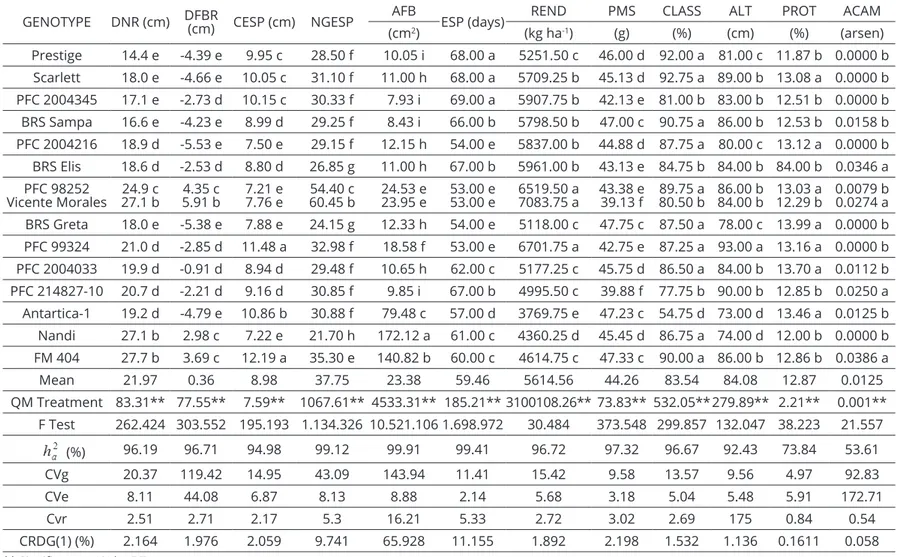
(1)Relative Contribution for the Genetic Diversity, using the Singh method (1981). Table 1: Continuation.
GENOTYPE DNR (cm) DFBR (cm) CESP (cm) NGESP AFB ESP (days) REND PMS CLASS ALT PROT ACAM
(cm2) (kg ha-1) (g) (%) (cm) (%) (arsen)
Prestige 14.4 e -4.39 e 9.95 c 28.50 f 10.05 i 68.00 a 5251.50 c 46.00 d 92.00 a 81.00 c 11.87 b 0.0000 b
Scarlett 18.0 e -4.66 e 10.05 c 31.10 f 11.00 h 68.00 a 5709.25 b 45.13 d 92.75 a 89.00 b 13.08 a 0.0000 b
PFC 2004345 17.1 e -2.73 d 10.15 c 30.33 f 7.93 i 69.00 a 5907.75 b 42.13 e 81.00 b 83.00 b 12.51 b 0.0000 b
BRS Sampa 16.6 e -4.23 e 8.99 d 29.25 f 8.43 i 66.00 b 5798.50 b 47.00 c 90.75 a 86.00 b 12.53 b 0.0158 b
PFC 2004216 18.9 d -5.53 e 7.50 e 29.15 f 12.15 h 54.00 e 5837.00 b 44.88 d 87.75 a 80.00 c 13.12 a 0.0000 b
BRS Elis 18.6 d -2.53 d 8.80 d 26.85 g 11.00 h 67.00 b 5961.00 b 43.13 e 84.75 b 84.00 b 84.00 b 0.0346 a PFC 98252
Vicente Morales 27.1 b24.9 c 5.91 b4.35 c 7.21 e7.76 e 60.45 b54.40 c 24.53 e23.95 e 53.00 e53.00 e 6519.50 a7083.75 a 43.38 e39.13 f 89.75 a80.50 b 86.00 b84.00 b 12.29 b13.03 a 0.0079 b0.0274 a
BRS Greta 18.0 e -5.38 e 7.88 e 24.15 g 12.33 h 54.00 e 5118.00 c 47.75 c 87.50 a 78.00 c 13.99 a 0.0000 b
PFC 99324 21.0 d -2.85 d 11.48 a 32.98 f 18.58 f 53.00 e 6701.75 a 42.75 e 87.25 a 93.00 a 13.16 a 0.0000 b
PFC 2004033 19.9 d -0.91 d 8.94 d 29.48 f 10.65 h 62.00 c 5177.25 c 45.75 d 86.50 a 84.00 b 13.70 a 0.0112 b
PFC 214827-10 20.7 d -2.21 d 9.16 d 30.85 f 9.85 i 67.00 b 4995.50 c 39.88 f 77.75 b 90.00 b 12.85 b 0.0250 a
Antartica-1 19.2 d -4.79 e 10.86 b 30.88 f 79.48 c 57.00 d 3769.75 e 47.23 c 54.75 d 73.00 d 13.46 a 0.0125 b
Nandi 27.1 b 2.98 c 7.22 e 21.70 h 172.12 a 61.00 c 4360.25 d 45.45 d 86.75 a 74.00 d 12.00 b 0.0000 b
FM 404 27.7 b 3.69 c 12.19 a 35.30 e 140.82 b 60.00 c 4614.75 c 47.33 c 90.00 a 86.00 b 12.86 b 0.0386 a
Mean 21.97 0.36 8.98 37.75 23.38 59.46 5614.56 44.26 83.54 84.08 12.87 0.0125
QM Treatment 83.31** 77.55** 7.59** 1067.61** 4533.31** 185.21** 3100108.26** 73.83** 532.05** 279.89** 2.21** 0.001**
F Test 262.424 303.552 195.193 1.134.326 10.521.106 1.698.972 30.484 373.548 299.857 132.047 38.223 21.557
(%) 96.19 96.71 94.98 99.12 99.91 99.41 96.72 97.32 96.67 92.43 73.84 53.61
CVg 20.37 119.42 14.95 43.09 143.94 11.41 15.42 9.58 13.57 9.56 4.97 92.83
CVe 8.11 44.08 6.87 8.13 8.88 2.14 5.68 3.18 5.04 5.48 5.91 172.71
Cvr 2.51 2.71 2.17 5.3 16.21 5.33 2.72 3.02 2.69 175 0.84 0.54
Ciência e Agrotecnologia 41(2):147-158, Mar/Apr. 2017
152 AMABILE, R. F. et al.
A wide variability was found regarding the trait spike length (CESP), a result also observed in other studies regarding the morphological diversity (Ahmad et al., 2008; Karim et al., 2010; Setotaw; Dias; Missio, 2010). The range of this variation was 6.54 cm and the genotypes were divided in six groups according to Scott-Knott test, where the means for each group were 11.84 cm; 10.77 cm; 9.86 cm; 8.93 cm; 7.66 cm and 6.0 cm (Table 1).
The variation between genotypes was from 20.65 (PFC 2005123) to 78.25 (Foster) when studying the trait number of grains by ear (NGESP). Eight groups of similarity were found. The average in the biggest group, with 22 accesses, including witness BRS 195 was 30.24 grains by ear, being lower than the general average (37.75 grains by ear). This huge variability, also observed by Ahmad et al. (2008), Cross (1994) and Setotaw, Dias and Missio, (2010) might be related to a higher or lower
number of tillers, which according to Windes, Olson and Obert (2009) has an influence on the number of grain by
ear (NGESP), which might or might not affect the grain yield (Simmons; Rasmusson; Wiersma, 1981).
The highest number of group means was observed
when assessing the trait flag leaf (AFB): the range for
nine groups was 164.24 cm² - a value extremely higher than the one observed by Ahmad et al. (2008). Several genotypes showed a lower or higher value in relation to witnesses BRS 180 and BRS 195 (23.35 cm² and 12.15
cm², respectively). Because the flag leaf is considered as
the main source of carbohydrate for cereals (Sicher, 1993), and other aspects related to productivity (Tungland et al.,
1987), this is a good finding since it indicates the great diversity of the flag leaf. Accesses Foster, Antártica-1, FM 404 and Nandi showed the highest mean flag leaf
area, where Nandi showed the highest mean (172.12 cm²). According to Scott-Knott test, the means of these four genotypes were different and did not form groups with other means from other accesses.
In relation to the grain yield (REND), five groups were found and also a range of variation (3.406 kg ha-1), where the two-rowed genotype PFC 2001049
evidenced the highest yield (7,153.5 kg ha-1), being even
higher than the average national yield (3.231 kg ha-1)
(Faostat, 2015). However, it did not show a significant
difference in relation to the average yield shown by the exotic materials Foster, Vicente Morales and Lacey; cultivar and witness BRS 180, genotypes PFC 99324 and PFC 98252 (all six-rowed barley). It is important to emphasize that the high yield of three exotic materials American Foster and Lacey and Mexican Vicente Morales showed that the irrigated environment of the
savannah provides the possibility of introducing genetic materials from other irrigated barley programs. The high yield (up to 9.700,00 kg ha-1) found in experiments with
lines obtained from CIMMYT with no malting quality were presented by Amabile et al. (2008), indicating the technical and economic viability of barley when grown in the Brazilian savannah under irrigation.
Two groups were observed (means = 12.3% and 13.52%) by using the Scott-Knott test concerning the protein content. CIMMYT 2 showed the lowest content
(11.49%) but it did not show statistically significant
differences compared to witnesses BRS 180 and BRS 195 (Table 1). CEV 96046, Foster, Lacey, M 14, AF 9585, BRS Deméter, BRS 195, BRS 180, Prestige, PFC 2004345, BRS Sampa, Vicente Morales and Nandi showed values within a level of 12.5% according to what the Brewing and malting barley research institute (2011) stated that the malting barley should have. Although those accesses were elite genotypes, they indicated a wide variation in the protein content, presenting a value up to 14.13% (C-70). The genotype - environment interaction might explain the fact that an access, like cultivar BRS 180, ended up showing variability in its protein content (Molina-Cano et al., 1997; Qi et al., 2005; Yalçin et al., 2007). In an irrigated system in the Brazilian savannah, Amabile et al. (2008) observed a great variability regarding the protein content within the same year or in different years. Certainly, the high temperatures and
low relative air humidity during the grain filling period
in the savannah resulted in a higher protein content corroborating to the studies performed by Chapman and Carter (1976). These authors have stated that in dry and hot environment, barley grains have high protein contents. However, it is important to emphasize that high protein contents might be useful in certain periods of time when the available barley in the Brazilian market show a low protein. In this case, the high protein barley becomes a protein bank to be used as a malt blend.
In general, the genotypes showed a high commercial
classification of grain (mean = 83.54%). The two-rowed
cultivar PFC 2005123 had an index of 94.5%, being statistically superior to its witnesses, but that was not true when compared to cultivars BRS Deméter, Lacey and Scarlett (Table 1). The main purpose in the irrigated barley program in the Brazilian savanna is to obtain genotypes
with a grain classification above 80%. Therefore, only
genotypes Antartica-1, hull-less barley CPAC 20011,
with the lowest classification (31%) and genotype M 14 presented values lower than 80% and significantly different
Genetic variability in elite barley genotypes based on the agro-morphological characteristics evaluated under irrigated system 153
Ciência e Agrotecnologia 41(2):147-158, Mar/Apr. 2017
214827-10 and CIMMYT 25 showed a grain commercial classification below 80%; however they were not
significantly different from the witnesses. These results
indicate promising genotypes to be used as gene sources
for grains with a better classification.
Eight groups were observed for the trait thousand-seed weight (PMS), one of the most used traits in improvement programs (Ahmad et al., 2008; Cross, 1994; Manjunatha et al., 2007; Setotaw; Dias; Missio, 2010;
Žáková; Benková, 2006). The mean was 44.25 g, being higher than the one found by Kuczyńska et al. (2007).
Several genotypes showed differences when compared to their witnesses. For instance, the hull-less barley CPAC 20011 showed the lowest thousand-seed weight (PMS)
(32.5 g), being statistically inferior to the pattern. On
the other hand, two exotic genotypes introduced from CIMMYT (CIMMYT 2 and CIMMYT 48) showed the highest weight (52.75 g and 51.13 g, respectively).
BRS Deméter presented the maximum height (ALT) (98.0 cm), being statistically different from two-rowed pattern BRS 195 and PFC 2005123 was the lowest (52.0 cm). This difference in height had already been evidenced by Amabile et al. (2008). It is important to highlight that the tallest plants did not promote the lodging, since these elite genotypes were selected not only based on the plant height, but for their architecture, with thicker stalks and smaller internodes. Therefore, it is more important to select plants by their general architecture, keeping the good characteristics of productivity and quality of grains than by their height.
A short production cycle is a desired trait in winter crops in the Brazilian savannah when using the appropriate physiological process for grain yield because the purpose in this case is to have an irrigated area ready for the next crop. Therefore, the period from sowing to silking (ESP) is essential for barley grown in the irrigated savannah. This period included an average of 59.4 days and PFC 2001090, Alliot and PFC 2004345 showed the longest silking (69.0 days), being statistically similar to witness BRS 195, which is recognized as a later crop (Amabile et al., 2008). This material is known for being the parent of genotype PFC 2001090 which probably explains a similar ESP. The earliest genotype was PFC 2005123, with a cycle of only 38.0 days. This genotype showed the lowest yield evidencing that the selection of very early genotypes might not be favorable to higher grain productivity (Table 1).
Lodging (ACAM), one of the traits observed in the lowest number of genetic materials studied in the present research (Table 1) is very important for the production of barley grown in the savannah through in irrigated system
and also in other systems and environments (Manjunatha
et al., 2007; Žáková; Benková, 2006). Genotypes PFC 213660 and PFC 99318, which showed a more significant
lodging, did not have a drastic decrease in productivity and quality of grains. The same was true for genotypes with a low rate of lodging, as genotype Vicente Morales, probably because this phenomenon occurred in a period of time that did not affect its physiology during the assimilation and translocation of carbohydrates and minerals or photosynthesis.
As for the relative importance of the traits regarding the agro-morphological dissimilarity, as reported by Singh
(1981), the traits flag leaf area (AFB) and silking (ESP)
- totalizing 65.93% and 11.15% of the total variation,
respectively - were the most influential. On the other hand,
it could be concluded that total protein content (0.16%) and lodging (0.058%) were the traits that contributed the least (Table 1). Similarly, Shekhawat, Prakash and Singhania (2001) found out that silking was the trait with the highest
influence on the Mahalanobis’ distance, while Alam et al.
(2007) stated that the traits days to maturity, grains by spike and thousand-seed weight were the most divergent.
The genetic variability analysis, according to the Mahalanobis’ generalized distance between each pair of access, indicated that genotypes PFC 2004345 and Nandi showed the highest dissimilarity, showing the longest distance (D² = 7.536,00). The shortest distance estimate (9.2) was found for witness BRS 195 and genotype Alliot, although no degree of relatedness was observed based on the genealogy. The same was true for the six-rowed genotype AF9585 which presented the shortest distance
for witness BRS 180 (D² = 13.2). This amplitude reflects
a wide genetic variability of accesses, a fundamental condition for future researches concerning the genetic selection and improvement, which was also stated by Alam et al. (2007), Ahmad et al. (2008), Cross (1994), Shekhawat et al. (2001) and Setotaw; Dias; Missio, (2010) in other collections that were studied based on the
agro-morphological traits. It was interesting to find out
that genotype Nandi presented the longest distance when compared to witnesses BRS 195 (6,991.3) and BRS 180 (5,806.5) also showing the highest average of distances in relation to all other genotypes.
The dendrogram resulting from the UPGMA indicated a satisfactory adjustment with the genetic
dissimilarity matrix verified by the high and significant cophenetic correlation coefficient (r = 0.77, p ≤ 0.001),
Ciência e Agrotecnologia 41(2):147-158, Mar/Apr. 2017
154 AMABILE, R. F. et al.
Five groups of similarity were found, with several sub-groups, by adopting as the cutoff point based on the evaluated descriptors (dgE = 439, 7)
.
Group I was the most divergent among them all, being composed of genotypes Nandi and FM 404. These genotypes might be recommended to be used in hybrid combinations and as a base for new population, due to the high geneticdivergence enabling the possibility of finding favorable
gene combinations to allow the selection of transgressive genotypes as stated by Falconer and Mackay (1996). Two very characteristic and divergent groups composed by genotypes Antártica-1 (group II) and PFC 2005123 (group III) were also found. Antártica-1 and FM 404 are two Brazilian genotypes used in the beginning of the barley improvement program in the savannah, with
diversified agro-morphological traits when compared
to other Brazilian genotypes. Nandi showed the longest genetic distance among the other genotypes probably because of its origin (the only sample from Australia), for being a hull-less barley genotype (non-adhering palea and lemma) and for having the biggest flag area (AFB) – a
trait that contributed the most (65.2%) to the Mahalanobis’ generalized distance.
The three most divergent genotypes did not show a superior yield compared to the others (Table 1). The distance in these genotypes might be useful for the program regarding the choice of new progenies for the hybridizations to be performed in order to have an agro-morphological diversity through the generation of new gene combinations.
Group IV is composed by six-rowed barley with five Mexican genotypes (CPAC 20011, CIMMYT 25, CIMMYT 42, Vicente Morales, AF 9585), three American (Lacey, Foster and BRS 180) and genotype PFC (Brazilian genotype collected from an American population) showing the contribution of genealogy. A big group was also observed (Group V) with 26 of the 39 genotypes studied in this research. This conglomeration indicates that most of the genotypes present high levels of agro-morphological similarity, which might be explained by the fact that the majority of accesses were obtained from a work collection. In this main group, a sub-group including cultivar BRS Elis,
BRS Sampa and Scarlett was identified, where BRS 195 is
one of the parents of BRS Elis and also BRS Sampa. Cultivar Scarlett is the other parent of BRS Elis. An even bigger sub-group composed by BRS 195, with the genotypes above
was identified, indicating that the high similarity might be
Figure 1: Cluster analysis of 39 barley genotypes, based on the genetic dissimilarity matrix calculated by using the Mahalanobis’ generalized distance of 12 agro-morphological traits. UPGMA was used as clustering criteria. The
Genetic variability in elite barley genotypes based on the agro-morphological characteristics evaluated under irrigated system 155
Ciência e Agrotecnologia 41(2):147-158, Mar/Apr. 2017
explained to a great extent by the genetic ancestry from BRS
195. An interesting fact was the identification of a different
sub-group related to the American cultivars, including only two-rowed cultivars, M-14 and C-70.
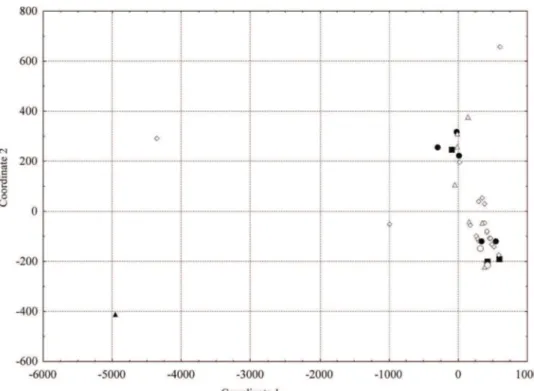
The distribution of the genetic variability related to the different geographic origins was dispersive and
no specific clustering tendency was observed regarding
the accesses (Figure 2). This fact was also reported by Ahmad et al. (2008) and Cross (1994). The agro-morphological traits used to calculate the genetic distances are complex variables which depend on the expression of a great number of genes, which by its turn, depend on the environment (Ceccarelli et al., 2007). In part, this explains the lack of access clustering based on the geographic origin. Possibly, the elite genotypes with different origins might have a gene pool in the genetic improvement programs in different countries. The only clustering trend of genotypes according to their origin was
identified in the Mexican genotypes, except for CIMMYT
2 and CIMMYT 48. The clustering occurred because in a certain point in time the improvement program focused on the selection and use of six-rowed materials that could be grown under an irrigation system. The Brazilian genotypes showed little dispersion and only genotypes
Antártica-1, FM 404 and PFC 2005123 were manifested.
The two first genotypes were obtained in 2000 before the
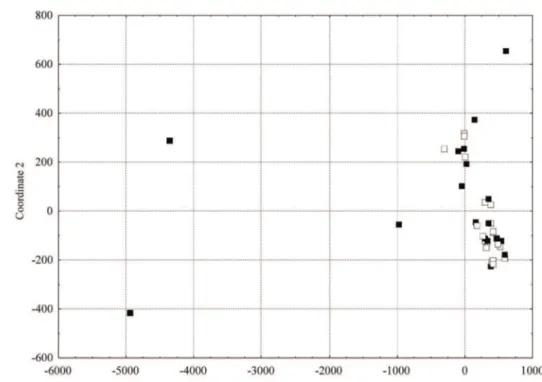
change made in the Brazilian irrigated barley program. In relation to the genotypes being currently used in the Brazilian genetic improvement program (Figure 3) only these Brazilian genotypes and the Australian genotype Nandi have not been used in cross. A cluster of barley genotypes related to the number of grain lines by spike
was identified (six/two rows) according to the distance
from the Cartesian plan (Figure 4). A cluster with twenty two-rowed genotypes was found including genotypes PFC 2001090, Alliot, BRS 195, PFC 214827-10, Cellar, Scarlett, BRS Sampa, BRS Elis, Prestige, PFC 2004345, M14, CEV 96046, PFC 213660, C-70, PFC 2004033, PFC 99318, PFC 213106, PFC 2003122, Danuta and BRS Deméter. Another sub-group which showed a tendency of six-rowed genotypes was composed of 12 six-rowed genotypes: CIMMYT 2, CIMMYT 25, CIMMYT 42, CIMMYT 48, PFC 99324, Foster, BRS 180, AF 9585, Lacey, PFC 98252, Vicente Morales and CPAC 20011. This tendency of six/ two rows genotypes grouping has also been observed in other studies conducted in the Cerrado region based on quantitative and molecular characteristics (Amabile et al., 2013; Amabile et al., 2014), including for hull-ness barley (Sayd et al., 2015).
Figure 2: Scatter plot of thirty-nine barley accesses, based on the genetic dissimilarity matrix calculated by using
Ciência e Agrotecnologia 41(2):147-158, Mar/Apr. 2017
156 AMABILE, R. F. et al.
Figure 3: Scatter plot of thirty-nine barley accesses, based on the genetic dissimilarity matrix calculated by using the Mahalanobis’ generalized distance of 12 agro-morphological traits. (□) Genetic materials currently used (■) and not used in improvement programs in Brazil.
Figure 4: Scatter plot of thirty-nine barley accesses, based on the genetic dissimilarity matrix calculated by using
Genetic variability in elite barley genotypes based on the agro-morphological characteristics evaluated under irrigated system 157
Ciência e Agrotecnologia 41(2):147-158, Mar/Apr. 2017
CROSS, R. J. Geographical trends within a diverse spring barley collection as identified by agro/morphological and electrophoretic data. Theoretical and Applied Genetics, 88:597-603, 1994.
CRUZ, C. D. Programa Genes: Aplicativo computacional em genética e estatística. Viçosa: Ed. da UFV, 2007.
CRUZ, C. D.; REGAZZI, A. J.; CARNEIRO, P. C. S. Modelos
biométricos aplicados a melhoramento genético.
2004. 480p.
FALCONER, D. S.; MACKAY, T. F. C. Introduction to quantitative genetics. 4. ed. Edinburgh: Longman Group Limited, 1996. 464p.
FAOSTAT. Statistical database of the Food and Agriculture Organization of the United Nations (FAOSTAT). 2015. Available in: <http://faostat.fao.org>. Access in: June 30, 2015.
KARIM, K. et al. RAPD markers and morpho-physiological characterization of some Tunisian barley ecotypes.
Biological Diversity and Conservation, 3(2):1-11, 2010.
KUCZYŃSKA, A. et al. Relationship between phenotypic and genetic diversity of parental genotypes and the frequency of transgression effects in barley (Hordeum vulgare L.). Plant Breeding, 126:361-368, 2007.
MANJUNATHA, T. et al. Genetic diversity in barley (Hordeum vulgare L. ssp. vulgare) landraces from Uttaranchal Himalaya of India. Genetic Resources and Crop Evolution, 54:55–65, 2007.
MOLINA-CANO, J. L. et al. Genetic and environmental variation in malting and feed quality of barley. Journal of Cereal Science, 25:37-47, 1997.
PINTHUS, M. J. Lodging in wheat, barley, and oats: The phenomenon, its causes, and preventive measures. In: BRADY, N. C. Advances in Agronomy,New York:Academic Press Inc., 1973. v. 25, p.209-263.
QI, J. et al. Protein and hordein fraction content in barley seeds as affected by sowing date and their relations to malting quality. Journal of Zhejiang University-Science B, 6(11):1069-1075, 2005.
RESENDE, M. D. V. de; DUARTE, J. B. Precisão e controle de qualidade em experimentos de avaliação de cultivares.
Pesquisa Agropecuária Tropical, 37(3):182-194, 2007.
ROHLF, F. J. NTSYS-pc: Numerical taxonomy and multivariate analysis system, version 2.1. New York: Exeter Software, 2000. 98p.
CONCLUSIONS
Highly significant differences were found among
the genotypes for all agro-morphological traits. The high
coefficient of genetic variation shows the possibility of
having genetic gains for all traits. Traits that contributed
the most for the variability included flag leaf area and
silking and the ones that contributed the least were protein content and lodging. Based on the cluster analysis, three
major groups of similarity were identified. A cluster
tendency of two and six-rowed samples was observed. Genotypes PFC 2005123, Antártica-1, Nandi and FM 404 were the more divergent. Promising genetic materials for
the evaluated agronomical traits were identified in the
present study and might be explored in crossing blocks in improvement programs in order to develop cultivars which will be more adjusted to the systems of irrigated crop in the savannah.
REFERENCES
AHMAD, Z. et al. Genetic diversity for morphogenetic traits in barley germplasm. Pakistan Journal of Botany, 40(3):1217-1224, 2008.
ALAM, A. K. M. M. et al.D2 analysis in early maturity hull-less barley (Hordeum vulgare L.). International Journal of Sustainable Crop Production, 2(1):15-17, 2007.
AMABILE, R. F. et al. Genetic diversity of irrigated barley based on molecular and quantitative data and on malting quality. Pesquisa Agropecuária Brasileira, 48(7):748-756, 2013.
AMABILE, R. F. et al. BRS Deméter: Nova cultivar de cevada cervejeira irrigada para o Cerrado do Brasil Central.
Pesquisa Agropecuária Brasileira, 43:1247-1249, 2008.
AMABILE, R. F. et al. Genetic diversity of elite barley genotypes from Brazilian working collection based on RAPD markers.
Bioscience Journal,30(4):1118-1126, 2014.
BREWING AND MALTING BARLEY RESEARCH INSTITUTE.
Quality factors in malting barley. 2011. Available in: <http://www.bmbri.ca/>. Access in: April 30, 2010.
CECCARELLI, S. et al. Barley breeding for sustainable production. In: KANG, M. M.; PRIYADARSHAN, P. M.
Breeding Major Food Staples. Iowa, USA: Blackwell
Publishing, 2007. p.193-216.
Ciência e Agrotecnologia 41(2):147-158, Mar/Apr. 2017
158 AMABILE, R. F. et al.
SAS INSTITUTE INC. SAS/STAT® 9.2 user’s guide. Cary, 2008. 7857
p. Available in: <http://support.sas.com/documentation/cdl/en/ statug/59654/PDF/default/statug.pdf>. Access in: June 25, 2015.
SAYD, R. M. et al. Genetic variability of hull-less barley accessions based on molecular and quantitative data.
Pesquisa Agropecuária Brasileira,50(2):160-167, 2015.
SCOTT, A. J.; KNOTT, M. A Cluster analysis method for grouping means in the analysis of variance. Biometrics, 30:507-512, 1974.
SETOTAW, T. A.; DIAS, L. A. dos S.; MISSIO, R. F. Genetic divergence among barley accessions from Ethiopia. Crop Breeding and Applied Biotechnology, 10:116-123, 2010.
SHEKHAWAT, U. S.; PRAKASH, V.; SINGHANIA, D. L. Genetic divergence in barley (Hordeum vulgare L.). Indian Journal of Agricultural Research,35(2):121-123, 2001.
SICHER, R. C. Assimilate partitioning within leaves of small grain cereals. In: YASH, P. A.; PRASANNA, M.; VINDJEE, D.
Photosynthesis Photoreactions to Plant Productivity, Dordrecht, Netherlands: Kluwer Academic Publishers, 1993. p. 351-360.
SIMMONS, S. R.; RASMUSSON, D. C.; WIERSMA, J. V. Tillering in barley: Genotype, row spacing, and seedling rate effects.
Crop Science. 22(4):801-805, 1981.
SINGH, D. The relative importance of characters affecting genetic diversity. Indian Journal of Genetics and Plant Breeding. 41(2):237-245, 1981.
SNEATH, P. H. A.; SOKAL, R. R. Numerical taxonomy: The principles and practice of numerical classification. San Francisco, CA, EUA: W. H. Freeman, 1973. 573p.
SOKAL, R. R.; ROHLF, F. J. The comparison of dendrograms by objective methods. Taxon, 11:30-40, 1962.
STATSOFT INC. Statistica for Windows. [Computer program manual] Tulsa: StatSoft Inc., 1999.
TUNGLAND, L. et al. Effect of erect leaf angle on grain yield in barley. Crop Science, 27(1):37-40, 1987.
VENCOVSKY, R. Herança quantitativa. In: PATERNIANI, E.; VIEGAS, G. P. Melhoramento e produção de milho, Campinas, SP, Brasil: Fundação Cargill, 1987. v.1, p.137-214.
VERMA, R. P. S.; SARKAR, B. Diversity for malting quality in barley (Hordeum vulgare) varieties released in India. Indian Journal of Agricultural Sciences, 80(6):493-500, 2010.
WINDES, J. M.; OLSON, K.; OBERT, D. Production Guidelines
for CHARLES: A New Two-rowed Winter Malt Barley.
2009. Available in: <http://www.idahobarley.org/ b a r l e y c r o p m a n a g e m e n t _ f i l e s / C h a r l e s % 2 0 Production%20Guideline%20Sept%2009.pdf>. Access in: May, 10, 2011.
YALÇIN, E. et al. Effects of genotype and environment on b-glucan and dietary fiber contents of hull-less barley grown in Turkey. Food Chemistry, 101:171-176, 2007.
YASUHARA T.; NOKIHARA, K. High-throughput analysis of total nitrogen content that replaces the classic Kjeldahl method. Journal of Agricultural and Food Chemistry, 49(10):4581-4583, 2001.
ŽÁKOVÁ, M.; BENKOVÁ, M. Characterization of spring barley accessions based on multivariate analysis.
Communications in Biometry and Crop Science,