Adjustment of water-crop
production models for ratoon sugarcane
1Jorge Luiz Moretti de Souza2, Emerson Gerstemberger2,
Bruno César Gurski2, Ricardo Augusto de Oliveira2
INTRODUCTION
Sugarcane (Saccharum spp.) is one of the main products in the Brazilian agribusiness. In the Paraná State, sugarcane occupies an area of 665,000 ha, with an annual production of about 50 million tons. The Paranavaí region accounts for 20 % of this production, and the planted area is increasing fast in this region (Paraná 2015).
Agriculture is the economic activity that has a higher dependence on weather conditions, which are responsible for the oscillations of agricultural seasons (Souza 2014). Environmental factors directly affect plant growth and development. However, the relations between climatic parameters and agricultural production are quite complex. The influence of climate on sugarcane is remarkable because it is a semi-perennial crop, grown under different environmental conditions, causing production variations over the years (Silva et al. 2008).
ABSTRACT
RESUMO
The effect of water stress on sugarcane, at different development phases, is not well defined, making it difficult to estimate how the lack or excess of soil moisture affects yield (Wiedenfeld 2000). However, it is known that the damage promoted by stress depends on which developmental phase the plant is and the stress duration. The longer the period with low water availability, the greater the damage on stalks and saccharose yield (Inman-Bamber 2004, Farias et al. 2008).
In sugarcane management, it is always important to forecast the production, given the changes occurring in soil and climate throughout the cropping season
(Silva & Bergamasco 2001). Detailed knowledge on water dynamics in the soil-water-atmosphere system provides essential elements for the establishment or improvement of agricultural management practices aimed at optimizing yield (Souza 2014).
For a better understanding of plant-climate interaction, water-crop models have been used
1. Manuscript received in Sep./2015 and accepted for publication in Dec./2015 (http://dx.doi.org/10.1590/1983-40632015v4537687). 2. Universidade Federal do Paraná, Curitiba, PR, Brazil. E-mails: [email protected], [email protected],
Production models need to be tested at different locations to be used as an agricultural planning tool. Hydric relations and performances of water-crop production models were used to estimate ratoon sugarcane yield along nine production cycles, in Paranavaí, Paraná State, Brazil. The crop reference and real evapotranspiration, soil water storage,
water deficit and surplus were evaluated. The “Stewart” and “Jensen” models showed the best performance to
estimate ratoon sugarcane yield. Water availability in the
first development phase of ratoon sugarcane has the greatest influence on yield.
KEY-WORDS: Saccharum spp.; evapotranspiration; water relations.
Ajuste de modelos de produção água-cultura para cana-soca
Modelos de produção precisam ser testados em diferentes locais, para serem utilizados como instrumento de planejamento agrícola.Avaliaram-se, ao longo de nove ciclos de cultivo, as relações hídricas e o desempenho de modelos de produção água-cultura, na estimativa da produtividade de cana-soca, em Paranavaí (PR). Estimou-se a evapotranspiração de referência e real da
cultura, armazenamento de água no solo, deficiência e excedente hídrico. Os modelos de “Stewart” e “Jensen” obtiveram os
melhores desempenhos para estimar a produtividade de cana-soca. A disponibilidade hídrica na primeira fase de desenvolvimento da
cana-soca exerce a maior influência na produtividade.
to characterize the effects of temperature and precipitation variations on crop yield (Frizzone et al. 2005). Season forecasts from simulation models and other estimates can be successfully used in various situations to rationalize management practices (Souza 2013, 2014).
The use of water-crop models can have applications prior to sowing and during crop growth and development (Hoogenboom 2000). The information obtained may be used for planting planning and agricultural management, to improve the knowledge on the crop physiological mechanisms, minimize environmental risks, reduce production costs and provide greater sustainability in agricultural planning. However, for a model to be used under different conditions from those in which it was developed, it is necessary that their parameters be locally tested and adjusted, since its application depends on the obtained results (Araújo et al. 2011, Souza et al. 2013).
This study aimed at evaluating the water relations and the performance of simplified functions (linear, potential, exponential and logarithmic) and water-crop models to estimate ratoon sugarcane yield, in soil and climate conditions of Paranavaí.
MATERIAL AND METHODS
The RB72454 cultivar, with an average cycle of 365 days, was used. Ratoon sugarcane yield data were collected for nine production cycles, in the 1997/1998 and 2007/2008 cropping seasons. In every season, the harvest was carried out in July, with equal length of days after sowing.
Data were collected at the Experimental Station of the Universidade Federal do Paraná, in Paranavaí, Paraná State, Brazil (22º58’44”S, 52º27’51”W and average altitude of 480 m). The
site has a medium texture Oxisol and mildly hilly topography (Silva et al. 2005). The soil physical attributes showed textural uniformity in depth. The soil is very permeable, homogeneous and without impediment layers (Table 1).
Stalks were distributed in plant lines (grooves) arranged with 18 internodes per linear meter, spaced 1.40 m between rows. Soil chemical properties were evaluated before the sugarcane planting at every cycle. The base fertilizer used was 20 kg ha-1 of N, 100 kg ha-1 of K
2O and 100 kg ha -1 of P
2O5. Harvests were performed manually and cultural practices were carried out according to the standard management for sugarcane in the region.
The sugarcane yield was estimated using four simplified functions (linear, potential, logarithmic and exponential) and six water-crop models specific for the Paranavaí region. Regression and correlation analyses with four simplified functions were used to verify the adjustment of real yield, with the following water component data: reference evapotranspiration (ETo), crop evapotranspiration (ETc), real evapotranspiration (ETr), ETr/ETc and precipitation.
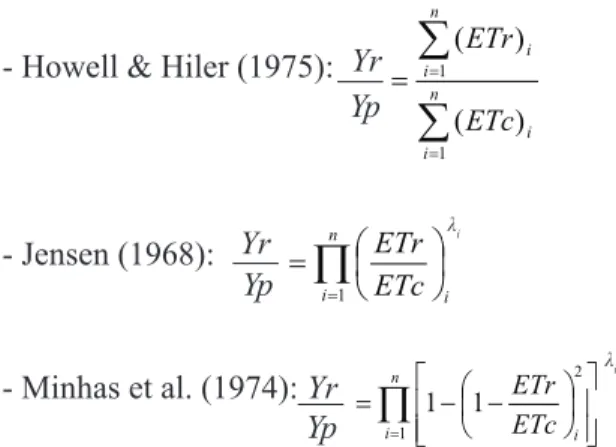
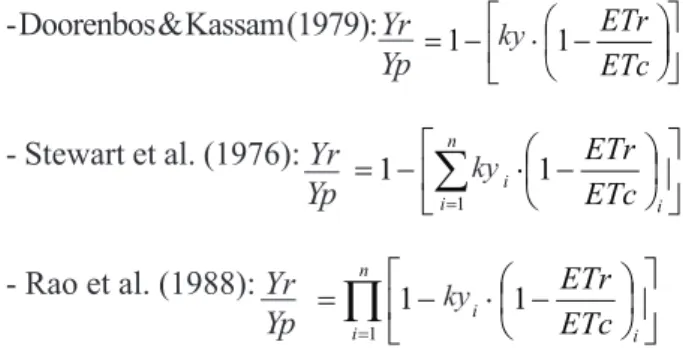
Following recommendations of Frizzone et al. (2005), the water-crop models bellow were used to estimate yield:
- Howell & Hiler (1975): Yr
∑
∑
= = = n i i n i i ETc ETr Y p Yr 1 1 ) ( ) ( Yp- Jensen (1968):
ëi i n i ETc ETr Yr
∏
= = 1 Yp Yr- Minhas et al. (1974): Yr
∏
= − − = n i ëi i ETc ETr Y p Yr 1 2 1 1 Yp
* Estimated parameters.
Depth Sand Silt Clay ρ θFC θPWP
________________________ % ________________________ kg m-3 ________________________ m3 m-3 ________________________
0-20 cm 83.3 1.1 15.5 1,640 0.10 0.06
20-40 cm 82.9 1.0 16.0 1,610 0.22 0.07
40-60 cm 84.1 1.3 14.5 1,620 0.21 0.07
60-80 cm* 84.1 1.3 14.5 1,620 0.21 0.07
Table 1. Texture (sand, silt and clay), specific soil mass (ρ) and volumetric moisture content at field capacity (θFC) and permanent
wilting point (θPWP) averages, in the 1997/1998 and 2007/2008 cropping seasons, at different depths (Paranavaí, Paraná
State, Brazil).
λi
- Doorenbos & Kassam (1979): Yr − ⋅ − = ETc ETr ky Yp Yr 1 1 Yp
- Stewart et al. (1976): Yr
− ⋅ − =
∑
= i n i i ETc ETr ky Yr 1 1 1 Yp- Rao et al. (1988): Yr
∏
= − ⋅ − = n i i i ETc ETr ky Yp Yr 1 1 1 Yp
where Yr: sugarcane estimated yield (kg ha-1); Yp: sugarcane potential yield in the region (kg ha-1);
ETri: real evapotranspiration at the i-th development phase (mm cycle-1); ETc
i: crop evapotranspiration at
the i-th development phase (mm cycle-1); ky or ky
i:
penalty coefficient of yield by deficit for the different sugarcane development phases (dimensionless); λi:
water factor penalty of yield by deficit for the different sugarcane development phases (dimensionless); i: crop development phases; n: number of development phases.
The sugarcane development phases and duration of the sub-periods were adapted from Machado et al. (1982), Sinclair et al. (2004) and Silva et al. (2005) (Table 2). The rooting system effective depth was defined according to Ido et al. (2006) and the crop coefficient values (kc) used to transform
ETo in ETc were adjusted for the period based on the figures provided by Doorenbos & Kassam (1979).
To obtain the main parameters and coefficients required in the water-crop models, potential yield (Yp) was considered the highest yield achieved during the period analyzed for the RB72454 cultivar, in the experiment site. The experimental data provided by PMGCA/UFPR/RIDESA (2008) indicated an average yield of 154.19 t ha-1, in the 2005/2006 season.
The estimated yield analyzes with water-crop models were performed using coefficients or penalty factors for the different phases of sugarcane
development. These coefficients and factors were obtained from: (a) the literature, i.e., with no adjustment; (b) kyi coefficients and λi factors adjusted with simple (ky) and multiple (kyi e λi) linear regression analyses (Souza 2014). These adjustments were made to the sugarcane relative yield (Y/Ym) and relative evapotranspiration (ETr/ETc) using climatic and cropping data from the nine studied cropping seasons. The regressions were resolved with the minimum square method and the linear equations system with the Gaussian elimination method (Souza 2013).
Yield estimates for each season were made from the integration of water-crop models, in a spreadsheet containing: a) the penalty factors and yield coefficients by deficit for the different sugarcane development phases (available in literature or adjusted); b) ETc and ETr values obtained in the calculation of daily water balance, in each i-th sugarcane development phase and j-th season, in the Paranavaí region.
The accuracy of the estimate of each water-crop model was determined from the linear regression analysis and correlation between the annual values of real and estimated yield (raised in the region). The agreement index “d” of Willmot et al. (1985) and the index “c” of Camargo & Sentelhas (1997) were used to assess the degree of accuracy between actual and estimated sugarcane yield values.
The estimated components of water balance were obtained according to Thornthwaite & Mather (1955). Precipitation and other climatic data required to estimate the daily reference evapotranspiration (ETo) were provided by the Paraná Meteorological System, from an automatic meteorological station. The ETo estimation was performed using the Penman-Monteith method (Allen et al. 1998).
The determination of soil physical properties (texture, density and moisture content at field capacity and permanent wilting point) was needed to
Source: adapted from Machado et al. (1982), Sinclair et al. (2004) and Silva et al. (2005). I: sprouting to intense tillering; II: growth in height; III: reduction of growth and sucrose accumulation.
Development phase Start End Duration Z kc
days m dimensionless
I July October 93 0.60 0.40
II October March 160 0.80 1.25
III March July 112 0.80 0.75
Table 2. Ratoon sugarcane development phases, rooting system effective depth (Z) and crop coefficient (kc) (Paranavaí, Paraná State, Brazil).
ky
ky
allow the calculation of soil available water capacity (AWC). Disturbed and undisturbed soil samples were collected in the experimental area, at eight collecting points, subdivided into three depths (0-0.20 m, 0.20-0.40 m and 0.40-0.60 m). The volumetric ring method (Embrapa 1997) was used to determine the density and points of the soil water retention curve. The parameters of the Van Genuchten (1980) equation were estimated with the Splintex software, version 1.0 (Prevedello 1999). The moisture content at field capacity and permanent wilting point were determined considering the tensions of 0.0098 MPa and 1.470 MPa, respectively.
AWC was determined by the following equation: AWCi = 0.01 . (θFC - θPWP) . zi,where AWCi: soil available water capacity in the i-th development phase (mm); θFC: volumetric soil moisture at field
capacity (%); θPWP: volumetric soil moisture at the wilting point (%); zi: effective depth of root system in the i-th crop development phase (mm).
Allen et al. (1998) present typical values of available water fraction (p) to different crops, indicating 0.65 for sugarcane, with which it was possible to calculate the soil available water (SAW). The cosine equation was used to determine the soil water storage and/or “negative accumulated” (Rijtema & Aboukhaled 1975).
RESULTS AND DISCUSSION
The yield in the 2007/2008 season was 16.04 % lower than the average yield of the region (80 t ha-1).
This was the only season that had yield below the regional average. The low performance observed occurred because the 2007/2008 season had the lowest values of ETr, precipitation and surplus, and the highest deficit (Table 3). Except for the 1999/2000 and 2007/2008 seasons, the precipitation values were always higher than the crop evapotranspiration (ETc) values. This fact caused high water surplus values, when considering the whole year, but did not prevent the occurrence of water deficit in specific periods, like during the growing season.
In the development phase I (budding to intense tillering), the average water deficit was 15.2 mm. Although Inman-Bamber & Smith (2005) say that sugarcane has resilience to moderate water stress during phase I, yield decreased mainly in 1998/1999 and 2007/2008, when the water deficit was more intense (Table 3). The water deficit occurred mainly in the development phase II (growth in height), possibly due to the fast crop development (Table 4). In phase II, plants have large leaf area and require a lot of water for gas exchange with the atmosphere (Ramesh 2000). In the development phase III (decreased growth and sucrose accumulation), the average deficiency was 41.4 mm. Data from phase III showed that water stress causes losses in sucrose production (Inman-Bamber & Smith 2005).
Obtaining models from commonly used functions (linear, potential, exponential and logarithmic), from simple regression analysis, when possible, is an excellent way to estimate a given
(1) Source: PMGCA/UFPR/RIDESA (2008); (2) standard deviation; (3) coefficient of variation. ETo: reference evapotranspiration; ETc: crop evapotranspiration; ETr: real
evapotranspiration.
Season ETo ETc ETr Precipitation Deficit Surplus ETr/ETc Yield
(1)
______________________________________________ mm season-1______________________________________________ t ha-1
1997/1998 1,279.5 1,180.0 1,067.3 1,625.0 112.7 551.6 0.90 130.60
1998/1999 1,235.3 1,174.0 1,020.6 1,492.6 153.5 443.0 0.87 130.16
1999/2000 1,442.5 1,320.0 913.7 1,251.6 406.3 341.1 0.69 98.99
2000/2001 1,268.0 1,198.6 1,068.3 1,659.0 130.4 586.9 0.89 140.83
2001/2002 1,387.6 1,270.6 1,043.2 1,439.0 227.5 464.2 0.82 127.94
2002/2003 1,330.9 1,233.7 1,056.5 1,479.2 177.2 408.6 0.86 115.79
2003/2004 1,327.8 1,250.5 962.0 1,508.8 288.4 500.3 0.77 141.60
2005/2006 1,294.6 1,203.9 951.0 1,373.8 252.9 433.1 0.79 154.19
2007/2008 1,363.4 1,252.6 791.9 1,003.6 460.7 147.6 0.63 67.92
Mean 1,325.5 1,231.5 986.1 1,425.8 245.5 430.7 0.80 123.11
S(2) 64.74 47.40 91.87 188.49 114.70 121.93 0.09 26.06
CV (%)(3) 4.90 3.80 9.30 13.20 46.70 28.30 10.90 21.20
phenomenon based on an independent variable. However, the attempt to adjust the yield data of the nine seasons of sugarcane with climatic parameters
(ETo, ETc, ETr, ETr/ETc and precipitation) had
no significant effect. The best coefficient of determination (R2) obtained was less than 0.32.
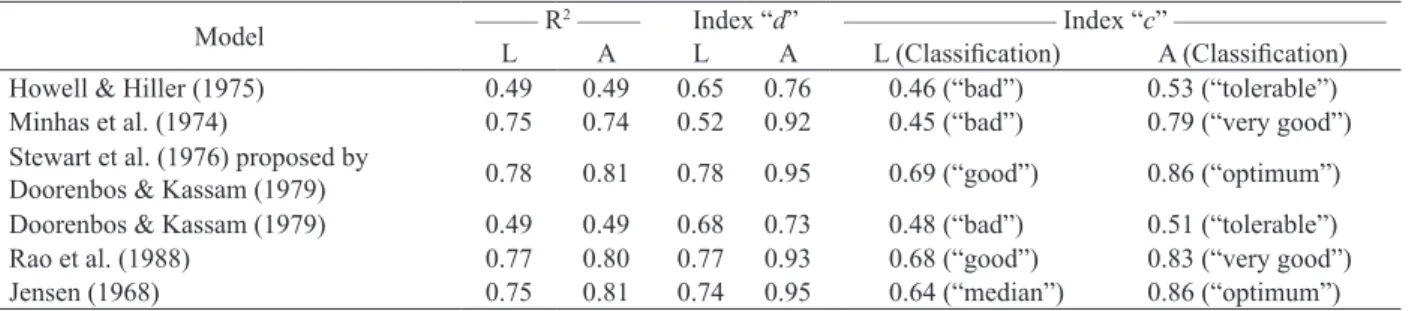
The next attempt consisted in evaluating water-crop models using coefficients recommended in the literature (Table 5), which improved yield estimates, when compared with linear, potential, logarithmic and exponential functions. However, the analysis did not render any model with “very good” or “excellent” fit (Table 6).
Another procedure recommended to improve the accuracy of estimated yield with models consisted of performing the statistical adjustment of coefficients or factors, with data from the nine studied seasons, with simple or multiple regression analysis. With statistical adjustment, the coefficients or factors (ky,
kyi and λ) found with the tested models were close
and similar to those recommended in the literature (Table 5), especially for the ky obtained by regression with the Stewart et al. (1976) model proposed by Doorenbos & Kassam (1979). The similarity between the coefficients or factors statistically adjusted and recommended in the literature (determined in other
Model
________ R2________ Index “d” ___________________________ Index “c” ___________________________
L A L A L (Classification) A (Classification)
Howell & Hiller (1975) 0.49 0.49 0.65 0.76 0.46 (“bad”) 0.53 (“tolerable”)
Minhas et al. (1974) 0.75 0.74 0.52 0.92 0.45 (“bad”) 0.79 (“very good”)
Stewart et al. (1976) proposed by
Doorenbos & Kassam (1979) 0.78 0.81 0.78 0.95 0.69 (“good”) 0.86 (“optimum”) Doorenbos & Kassam (1979) 0.49 0.49 0.68 0.73 0.48 (“bad”) 0.51 (“tolerable”)
Rao et al. (1988) 0.77 0.80 0.77 0.93 0.68 (“good”) 0.83 (“very good”)
Jensen (1968) 0.75 0.81 0.74 0.95 0.64 (“median”) 0.86 (“optimum”)
Table 6. Coefficients of determination (R2) and index “d” and “c” of the performance obtained in the analysis comparing real and estimated yield with water-crop models, for ratoon sugarcane, using the literature (L) and adjusted (A) coefficients
(Paranavaí, Paraná State, Brazil).
Coefficient or factor ____________________ Phases ____________________ All cicle Source
I II III
___________________________________________________________________ Recommended in literature ___________________________________________________________________
λ 0.43 0.39 0.07 - Jensen (1968)
ky 0.75 0.50 0.10 - Doorenbos & Kassam (1979)
Total ky - - - 1.20 Doorenbos & Kassam (1979)
___________________________________ Statistically adjusted in single or multiple regression with the season data ___________________________________
λ 0.95 0.31 0.17 - Multiple regression - Jensen (1968)
λ 1.91 1.55 0.90 - Multiple regression - Minhas et al. (1974)
ky 0.82 0.36 0.15 - Multiple regression
Total ky - - - 0.92 Simple regression
Table 5. Coefficients and/or factors (ky, kyi and λ) of water-crop models recommended in the literature and statistically adjusted for
ratoon sugarcane (Paranavaí, Paraná State, Brazil).
Table 4. Average components (seasons 1997/1998 to 2007/2008) of water balance in the different development phases of ratoon sugarcane (Paranavaí, Paraná State, Brazil).
Development phase AWC ETo ETc Precipitation ETr Deficit Surplus
mm ______________________________________________ mm phase-1______________________________________________
I 65.3 318.7 127.5 270.6 112.3 15.2 146.7
II 93.9 697.2 871.2 753.7 627.9 243.3 144.4
III 93.9 325.8 244.4 308.8 203.0 41.4 103.7
regions and conditions) shows that the tested water-crop models are meaningful and can potentially be applied to a broader region. Although many variables are involved in the sugarcane yield, water is considered one of the main factors. This is the reason that makes the coefficients and factors of water-crop models so similar, even when adjusted in different environments.
The analyses comparing real versus estimated yield values, using statistically adjusted coefficients with data from the nine seasons, improved the models to estimate ratoon sugarcane yield in Paranavaí (Table 6). Visually, it was found that the six models tested were sensitive to fluctuations of yield, even for models with a “c” index, classified as “poorly”
(Howell & Hiler 1975, Doorenbos & Kassam 1979) (Figure 1).
The Stewart et al. (1976) model proposed by Doorenbos & Kassam (1979), as well as the Jensen (1968) model, showed a better performance (Table 6) and enabled yield estimates with an average error of 6.72 % and 6.79 %, respectively (Figure 1). These models are product operator type (i.e., multiplicative), in which the adverse effects occurring in a given development phase impact the results of the remaining phases. The good performance obtained with these multiplicative models indicate that ratoon sugarcane may indeed behave like that. Conversely, the other evaluated models assume that the crop behave in a similar way independently of the water restrictions occurring on previous development phases, what is not true.
Sensitivity analyzes conducted with the Jensen (1968) model demonstrated that the occurrence of
ETri/ETciratio lower than 1.0 (deficit > 0), for the i-th phases, resulted in yield loss, and can reach null values if the ratio is close to zero. Plants were less sensitive in the development phase III, for which low values of the ETri/ETci ratio impacted less the sugarcane yield (Figure 2).
According to Embrapa (2009), an ETri/ ETciratio higher than 0.6, in the i-th development phases, is sufficient to provide an adequate development to sugarcane and to achieve good yield levels. However, the Jensen (1968) model indicates that when the ETri/ETciratio reaches 0.6 in a single development phase, significant yield loss is predicted. The loss magnitude depended on the development phase in which the water deficit occurred. Values of ETri/ETciequal to 0.6 occurred in the development phase I and resulted in a 38.3 % yield loss, in relation to the potential yield (154.19 t ha-1). For the development phases II and III, yield losses were 14.7 % and 8.2 %, respectively, in relation to the potential yield.
Variation in the ETr/ETc ratio, in the development phase III, impacted yield the least. This result is in agreement with Inman-Bamber & Smith (2005), who concluded that the early development phases of sugarcane are the most susceptible to water deficit. They also observed that deficiencies occurring in the development phase III might contribute to sucrose accumulation.
The estimated sugarcane yield based on the Jensen (1968) model, with ETri/ETciratio fixed in 0.6 (WRSI considered satisfactory), in the three developmental phases, is 74.4 t ha-1. The value is 52.0 % lower than the potential yield (154.19 t ha-1), indicating that sugarcane is sensitive to water stress.
Figure 1. Real and estimated ratoon sugarcane yield from the1997/1998 to the 2007/2008 season (Paranavaí, Paraná State, Brazil). 1 - Real yield; 2-7 - Estimated yield with models; 2 - Howell & Hiller (1975); 3 - Jensen (1968); 4 - Minhas et al. (1974); 5 - Doorenbos & Kassam (1979); 6 - Stewart et al. (1976) proposed by Doorenbos & Kassam (1979); 7 - Rao et al. (1988).
Figure 2. Yield reduction as a function of the ETr/ETc ratio, based on the Jensen (1968) model, using statistically
adjusted coefficients in the development phases I, II
and III (Paranavaí, Paraná State, Brazil).
Y
ield (t ha
-1)
Y
ield r
CONCLUSIONS
1. Water-crop models using yield coefficients or penalty factors “recommended in the literature” did not have a good performance to estimate ratoon sugarcane yield.
2. The “Stewart” and “Jensen” models reached the best performance, with index classified as “great”, to estimate ratoon sugarcane yield.
3. Water availability in the first development phase of ratoon sugarcane influences yield more than in the other two phases.
REFERENCES
ALLEN, R. G. et al. Crop evapotranspiration:guidelines for computing crop water requirements. Rome: FAO, 1998.
ARAÚJO, M. A.; SOUZA, J. L. M.; TSUKAHARA, R. Y. Modelos agrometeorológicos na estimativa da produtividade da cultura da soja na região de Ponta Grossa, Estado do Paraná. Acta Scientiarum Agronomy, Maringá, v. 33, n. 1, p. 23-31, 2011.
CAMARGO, A. P.; SENTELHAS, P. C. Avaliação do desempenho de diferentes métodos de estimativas de evapotranspiração potencial no Estado de São Paulo, Brasil. Revista Brasileira de Agrometeorologia, Porto Alegre, v. 5, n. 1, p. 89-97, 1997.
DOORENBOS, J.; KASSAM, A. H. Yield response to water. Rome: FAO, 1979.
E M P R E S A B R A S I L E I R A D E P E S Q U I S A AGROPECUÁRIA (Embrapa). Manual de métodos de análise de solo. 2. ed. Rio de Janeiro: Embrapa Solos, 1997.
E M P R E S A B R A S I L E I R A D E P E S Q U I S A AGROPECUÁRIA (Embrapa). Zoneamento agroecológico da cana-de-açúcar. Rio de Janeiro: Embrapa Solos, 2009.
FARIAS, C. H. et al. Índices de crescimento da cana-de-açúcar irrigada e de sequeiro no Estado da Paraíba. Revista Brasileira de Engenharia Agrícola e Ambiental, Campina Grande, v. 12, n. 3, p. 356-362, 2008.
FRIZZONE, J. A. et al. Planejamento de irrigação:análise e decisão de investimento. Brasília, DF: Embrapa, 2005.
HOOGENBOOM, G. Contribution of agrometeorology to the simulation of crop production and its application.
Agricultural and Forest Meteorology, Vancouver, v. 103, n. 1-2, p. 137-157, 2000.
HOWELL, T. A.; HILER, E. A. Optimization of water use
efficiency under high frequency irrigation. Transactions of the ASAE, Denver, v. 18, n. 5, p. 873-878, 1975.
IDO, O. T. et al. Crescimento e distribuição radicial de três cultivares de cana-de-açúcar, em cana soca, em dois tipos de solo, em rizotron: I. Uso do WinRHIZO. Scientia Agraria, Curitiba, v. 7, n. 1-2, p. 21-26, 2006.
INMAN-BAMBER, N. G. Sugarcane water stress criteria for irrigation and drying off. Field Crops Research, San Francisco, v. 89, n. 2, p. 107-122, 2004.
INMAN-BAMBER, N. G.; SMITH, D. M. Water relations
in sugarcane and response to water deficits. Field Crops Research, San Francisco, v. 92, n. 2, p.185-202, 2005.
JENSEN, M. E. Water consumption by agricultural plants. In: KOZLOWSKI, T. T. (Ed.). Water deficits and plant
growth. New York: Academic Press, 1968. p. 1-22.
MACHADO, E. C. et al. Índices biométricos de duas cultivares de cana-de-açúcar. Pesquisa Agropecuária Brasileira, Brasília, DF, v. 17, n. 9, p. 1323-1329, 1982.
MINHAS, B. S.; PARIKH, K. S.; SRINIVASAN, T. N. Towards the structure of a production function for wheat yields with dated inputs of irrigation water. Water Resource Research, David, v. 10, n. 3, p. 383-393, 1974.
PARANÁ. Secretaria da Agricultura e do Abastecimento. Departamento de Economia Rural. Prognóstico da cana-de-açúcar 2014/2015. 2015. Available at: <www.seab. pr.gov.br>. Access on: 22 Apr. 2015.
PREVEDELLO, C. L. Programa Splintex para estimar a curva de retenção de água a partir da granulometria (composição) do solo. Versão 1.0. Curitiba: UFPR, 1999.
PROGRAMA DE MELHORAMENTO GENÉTICO DA CANA-DE-AÇÚCAR (PMGCA/UFPR/RIDESA).
Dados de produtividade. Paranavaí: PMGCA/UFPR/ RIDESA, 2008.
RAMESH, P. Effect of different levels of drought during the formative phase on growth parameters and its relationship with dry matter accumulation in sugarcane.
Journal Agronomy & Crop Science, New York, v. 185, n. 1, p. 7-22, 2000.
RAO, N. H.; SARMA, P. B. S.; CHANDER, S. A simple dated water-production function for use in irrigated agriculture. Agricultural Water Management, Austin, v. 13, n. 1, p. 25-32, 1988.
RIJTEMA, P. E.; ABOUKHALED, A. Crop water use. In: ABOUKHALED, A. et al. Research on crop water use, salt affected soils and drainage in the Arab Republic of Egypt. Rome: FAO, 1975. p. 5-61.
SILVA, F. C.; BERGAMASCO, A. F. Levantamento de modelos matemáticos descritos para a cultura da cana-de-açúcar. Revista de Biociências, Porto Alegre, v. 7, n. 1, p. 7-14, 2001.
SILVA, M. D. et al. Yield Components as indicators of drought tolerance of sugarcane. Scientia Agricola, Piracicaba, v. 65, n. 6, p. 620-627, 2008.
SINCLAIR, T. R. et al. Sugarcane leaf area development under field conditions in Florida, USA. Field Crops Research, San Francisco, v. 88, n. 2, p. 171-178, 2004.
SOUZA, J. L. M. Ciclo da água na agricultura: fundamentos para o estudo do sistema solo, planta e atmosfera. Curitiba: DSEA/SCA/UFPR, 2014.
SOUZA, J. L. M. Fundamentos de matemática e estatística para formulação de modelos e análise de dados:aplicado às ciências agrárias. Curitiba: DSEA/SCA/UFPR, 2013.
SOUZA, J. L. M.; GERSTEMBERGER, E.; ARAÚJO, M. A. Calibração de modelos agrometeorológicos para estimar a produtividade da cultura do trigo, considerando sistemas de manejo do solo, em Ponta Grossa - PR. Revista
Brasileira de Meteorologia, Porto Alegre, v. 28, n. 4, p. 409-419, 2013.
STEWART, J. I.; HAGAN, R. M.; PRUITT, W. O.
Production functions and predicted irrigation programs for a principal crop as required for water resources
planning and increased water efficiency: final report. Washington, DC: Elsevier, 1976.
THORNTHWAITE, C. W.; MATHER, J. R. The water balance. New Jersey: Drexel Institute of Technology, 1955.
VAN GENUCHTEN, M. A closed-form equation for predicting the conductivity of unsaturated soils. Soil Science Society of America Journal, Madison, v. 44, n. 5, p. 892-898, 1980.
WIEDENFELD, R. P. Water stress during different sugarcane growth periods on yield and response to N fertilizer. Agricultural Water Management, Austin, v. 43, n. 2, p. 173-182, 2000.